Today's GOLD Analysis : MMC Structural Analysis + Reversal ZoneThis analysis is rooted in MMC – Mirror Market Concepts, a framework designed to track institutional behavior through liquidity patterns, QFL (Quick Flip Levels), trendline shifts, and volume bursts. The current 4H Gold chart demonstrates a smart money footprint that provides actionable insight for intraday and swing traders.
🔍 Detailed Technical Breakdown:
🟦 1. Previous Supply Completed | Demand Zone Reversal
At the lower end of the chart, price entered a key blue zone around $3,250–$3,280, previously a supply zone now flipped into demand. This zone represents where institutional buyers absorbed liquidity, forming the base for a bullish impulse.
The strong reaction from this zone, marked by long-wick candles and immediate reversal, indicates exhaustion of selling pressure.
This reversal is confirmed by a QFL structure, meaning price created a fast liquidity sweep before flipping direction.
MMC recognizes this as a high-probability area of reversal, a point where smart money typically enters.
📈 2. Trendline Breakout & Structure Shift
A descending trendline, representing bearish market control, was decisively broken to the upside. This shift marks:
End of the corrective phase
Beginning of a bullish structural change
Buyers now control the short-term narrative
The breakout was not only clean but also supported by a volume burst, which is a classic MMC indicator that institutional traders are entering the market.
🔶 3. Volume Burst Confirmation
Volume behavior plays a critical role in MMC. We see a clear volume spike post-breakout. This suggests that:
The breakout is not false
Buyers were aggressively positioned
A sustainable move is in development
This supports the validity of the trendline breakout and confirms the idea that price is ready to test higher liquidity zones.
🟢 4. Current Price Structure: Bullish Channel
After the breakout, the market formed a bullish channel, where price is steadily climbing while respecting parallel boundaries.
The channel support line acts as a dynamic entry point for retracement buys
MMC strategy uses this structure to identify scaling entries at channel lows or after successful pullbacks into key reversal zones
🟩 5. Mini Reversal Area (Short-Term Resistance Zone)
Price is currently testing a minor supply zone or what MMC defines as a "Mini Reversal Area". This is a reaction zone before continuing toward the major target above.
There are two possible reactions:
Short-term rejection, leading to a pullback into the lower channel support zone
Minor consolidation, forming a base for a breakthrough toward major resistance
🟦 6. Major & Minor Supply Zones Above
Marked in light blue and green, these zones represent areas where previous selling volume and distribution occurred.
The major supply zone (approx. $3,440–$3,470) is the next institutional target
The minor zone sits between $3,400–$3,420 and may cause initial resistance or a base for another impulse
These levels are prime for partial profit-taking or scouting short-term reversal trades.
📊 Trade Management Insights:
🛒 Buy Opportunities (Long Bias):
On pullback into channel support near $3,340–$3,350
On bullish confirmation from mini reversal area
On break and retest above minor resistance at $3,420
🛑 Stop-Loss Suggestion:
Below the channel support or below the blue demand zone (approx. $3,245)
🎯 Profit Targets:
TP1: $3,400 (first resistance)
TP2: $3,420 (minor supply)
TP3: $3,450–$3,470 (major institutional level)
🧠 Mirror Market Concepts (MMC) Highlights:
QFL Structures = Institutional Reversal Points
Volume Burst = Confirmation of Breakout Validity
Trendline Breakout = Momentum Shift
Channel Structure = Controlled Climb Pattern
Mini Reversal Zone = Key Decision Point Before Continuation
🧭 TradingView Summary for Minds Community:
This GOLD chart beautifully aligns with the MMC method — spotting smart money involvement early and aligning with their flow. After confirming structural reversal via trendline and QFL, the setup now looks poised for continuation toward the $3,440–$3,470 zone, making it a perfect chart to watch for buy-the-dip setups.
Goldupdate

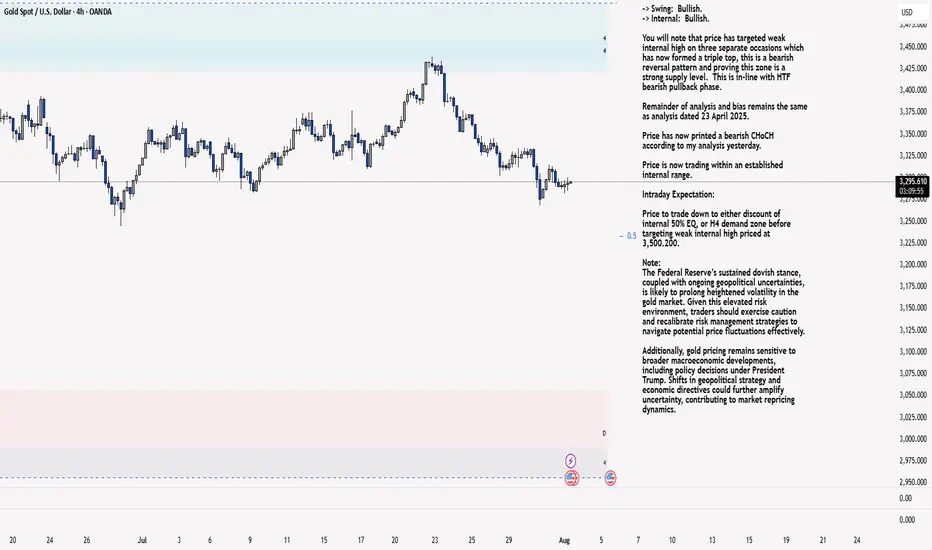
XAU/USD 01 August 2025 Intraday AnalysisH4 Analysis:
-> Swing: Bullish.
-> Internal: Bullish.
You will note that price has targeted weak internal high on three separate occasions which has now formed a triple top, this is a bearish reversal pattern and proving this zone is a strong supply level. This is in-line with HTF bearish pullback phase.
Remainder of analysis and bias remains the same as analysis dated 23 April 2025.
Price has now printed a bearish CHoCH according to my analysis yesterday.
Price is now trading within an established internal range.
Intraday Expectation:
Price to trade down to either discount of internal 50% EQ, or H4 demand zone before targeting weak internal high priced at 3,500.200.
Note:
The Federal Reserve’s sustained dovish stance, coupled with ongoing geopolitical uncertainties, is likely to prolong heightened volatility in the gold market. Given this elevated risk environment, traders should exercise caution and recalibrate risk management strategies to navigate potential price fluctuations effectively.
Additionally, gold pricing remains sensitive to broader macroeconomic developments, including policy decisions under President Trump. Shifts in geopolitical strategy and economic directives could further amplify uncertainty, contributing to market repricing dynamics.
H4 Chart:
M15 Analysis:
-> Swing: Bullish.
-> Internal: Bullish.
H4 Timeframe - Price has failed to target weak internal high, therefore, it would not be unrealistic if price printed a bearish iBOS.
The remainder of my analysis shall remain the same as analysis dated 13 June 2025, apart from target price.
As per my analysis dated 22 May 2025 whereby I mentioned price can be seen to be reacting at discount of 50% EQ on H4 timeframe, therefore, it is a viable alternative that price could potentially print a bullish iBOS on M15 timeframe despite internal structure being bearish.
Price has printed a bullish iBOS followed by a bearish CHoCH, which indicates, but does not confirm, bearish pullback phase initiation. I will however continue to monitor, with respect to depth of pullback.
Intraday Expectation:
Price to continue bearish, react at either M15 supply zone, or discount of 50% internal EQ before targeting weak internal high priced at 3,451.375.
Note:
Gold remains highly volatile amid the Federal Reserve's continued dovish stance, persistent and escalating geopolitical uncertainties. Traders should implement robust risk management strategies and remain vigilant, as price swings may become more pronounced in this elevated volatility environment.
Additionally, President Trump’s recent tariff announcements are expected to further amplify market turbulence, potentially triggering sharp price fluctuations and whipsaws.
M15 Chart:
Gold Slipping Lower — 3250 and 3200 in Sight!✅ Gold & DXY Update – Post-FOMC Price Action
Earlier today, before the U.S. interest rate decision, I released my outlook on both the Dollar Index and gold.
In that analysis, I highlighted the DXY’s readiness to move toward the key level of 100 — and as of now, price is actively testing that exact zone, just as expected.
As for gold, I repeatedly emphasized the visible weakness on the buy side. It was clear that there were very few remaining buy orders strong enough to hold price up in this region — and that’s exactly what played out. Price has started pushing lower, in line with our expectations.
Looking ahead, I believe the first target is 3250, followed by a deeper move toward the liquidity zone and the marked box around 3200, which could act as a key target area in the coming days.
🔁 This analysis will be updated whenever necessary.
Disclaimer: This is not financial advice. Just my personal opinion.

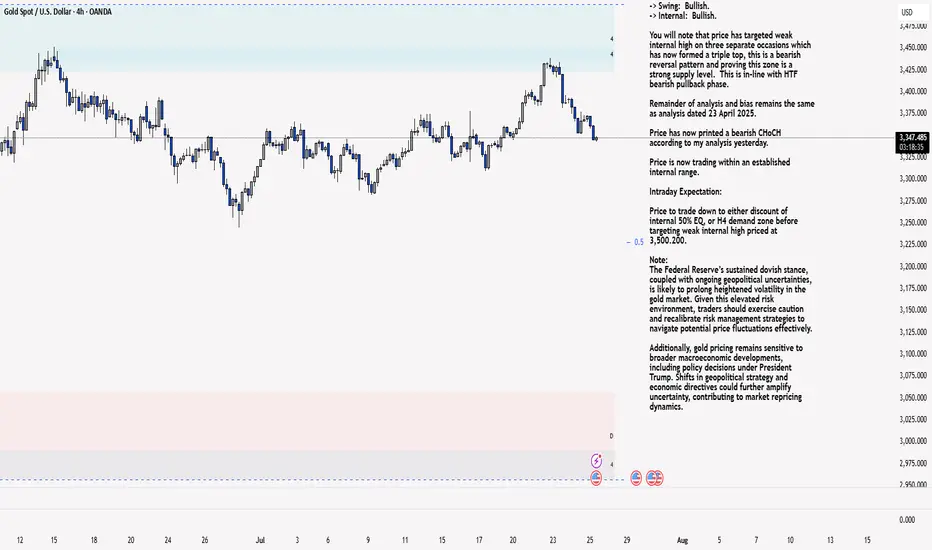
XAU/USD 25 July 2025 Intraday AnalysisH4 Analysis:
-> Swing: Bullish.
-> Internal: Bullish.
You will note that price has targeted weak internal high on three separate occasions which has now formed a triple top, this is a bearish reversal pattern and proving this zone is a strong supply level. This is in-line with HTF bearish pullback phase.
Remainder of analysis and bias remains the same as analysis dated 23 April 2025.
Price has now printed a bearish CHoCH according to my analysis yesterday.
Price is now trading within an established internal range.
Intraday Expectation:
Price to trade down to either discount of internal 50% EQ, or H4 demand zone before targeting weak internal high priced at 3,500.200.
Note:
The Federal Reserve’s sustained dovish stance, coupled with ongoing geopolitical uncertainties, is likely to prolong heightened volatility in the gold market. Given this elevated risk environment, traders should exercise caution and recalibrate risk management strategies to navigate potential price fluctuations effectively.
Additionally, gold pricing remains sensitive to broader macroeconomic developments, including policy decisions under President Trump. Shifts in geopolitical strategy and economic directives could further amplify uncertainty, contributing to market repricing dynamics.
H4 Chart:
M15 Analysis:
-> Swing: Bullish.
-> Internal: Bullish.
H4 Timeframe - Price has failed to target weak internal high, therefore, it would not be unrealistic if price printed a bearish iBOS.
The remainder of my analysis shall remain the same as analysis dated 13 June 2025, apart from target price.
As per my analysis dated 22 May 2025 whereby I mentioned price can be seen to be reacting at discount of 50% EQ on H4 timeframe, therefore, it is a viable alternative that price could potentially print a bullish iBOS on M15 timeframe despite internal structure being bearish.
Price has printed a bullish iBOS followed by a bearish CHoCH, which indicates, but does not confirm, bearish pullback phase initiation. I will however continue to monitor, with respect to depth of pullback.
Intraday Expectation:
Price to continue bearish, react at either M15 supply zone, or discount of 50% internal EQ before targeting weak internal high priced at 3,451.375.
Note:
Gold remains highly volatile amid the Federal Reserve's continued dovish stance, persistent and escalating geopolitical uncertainties. Traders should implement robust risk management strategies and remain vigilant, as price swings may become more pronounced in this elevated volatility environment.
Additionally, President Trump’s recent tariff announcements are expected to further amplify market turbulence, potentially triggering sharp price fluctuations and whipsaws.
M15 Chart:
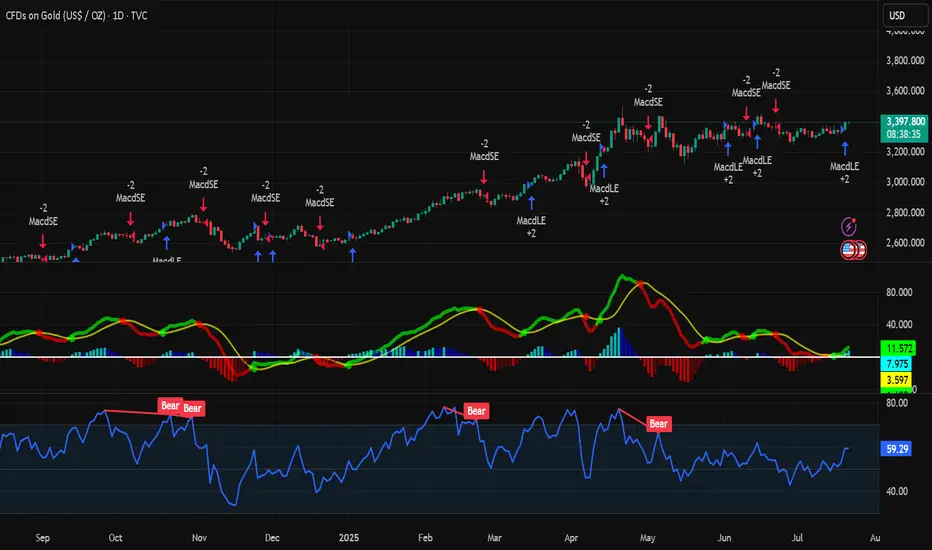
Analysis of short-term gold trading on July 22Technical aspects:
From the daily candlestick chart, gold has recently shown signs of breaking upward after five weeks of sideways fluctuations. In terms of MACD indicators, the MACD bar chart has turned from green to red, and the fast and slow lines have formed a "golden cross", strengthening the expectation of a short-term technical rebound.
At the same time, the 14-day RSI index rebounded to 57.67, still in the neutral and strong area, and has not yet entered the overbought area, indicating that the price still has room to rise. Analysis shows that the middle track of the Bollinger Band 3342 constitutes initial support, while the strong support below is at the two previous lows of 3247.87 and 3120.64.
If the bulls maintain their advantage above the integer position of 3400, they are expected to hit the high point of 3451.14 in the short term, and even further test the historical high of 3499.83; on the contrary, if they fall back below 3342, the short-term upward momentum will be tested.
Bull analysis:
If gold successfully stands above 3400, the market will turn its attention to the two key resistance areas of 3451 and 3499, the high point of the year. Breaking through the former will open up the space to test the historical high upward; combined with the current MACD golden cross pattern, if the capital side and the fundamentals continue to cooperate, it is not ruled out that there will be a short-term accelerated rise.
Bear analysis:
If the breakthrough fails, especially if gold falls back below the middle track of Bollinger, the adjustment pressure will be restarted, and the lower edge of the previous consolidation range of 3300 will constitute an important support. If it falls below again, it is necessary to pay attention to the important technical support near 3247 and the 100-day moving average of 3180.
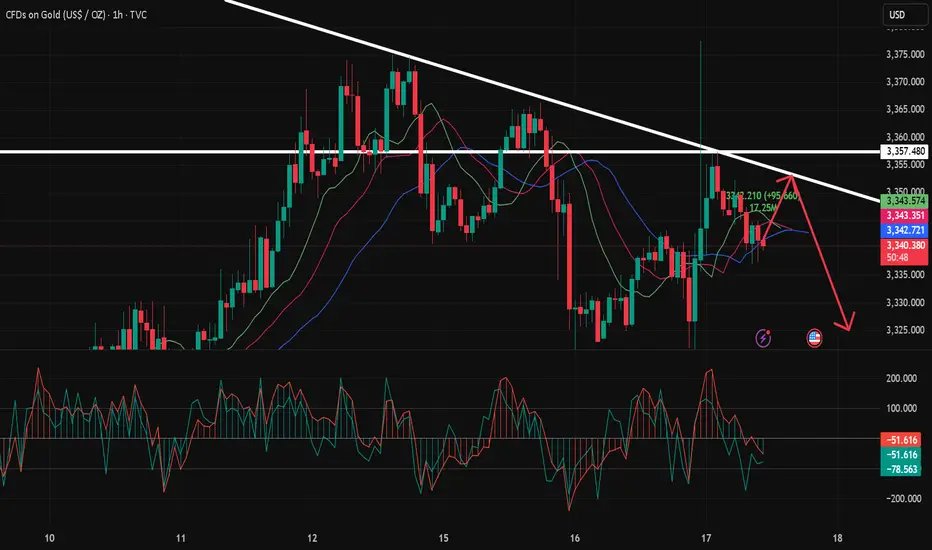
7.17 Gold Short-Term Operation Technical Analysis!!!After a strong rise in the 1-hour gold price, it quickly fell back and closed with a long upper shadow line. The gold bulls did not successfully stabilize the market. This market is actually a venting of the news. The gold bulls are not very confident about rising again. The 1-hour gold moving average is still in a dead cross short pattern. So the gold rebound will continue to be short. The 1-hour gold pattern excludes the influence of the upper shadow line stimulated by yesterday's news. In fact, the whole rhythm is still fluctuating and falling. The upper shadow line is not long, and it is probably just a lure to buy more. After the ups and downs of gold last night, it rebounded again to the 3357 line or continued to fall under pressure. So gold will continue to rebound in the early trading and continue to be short at highs under the pressure of 3357.
Gold is accelerating downward, pay attention to important supporThe U.S. inflation data for June was released overnight. The actual data showed that U.S. inflation rebounded slightly in June, but it did not exceed expectations. After the data was released, Trump made a speech at Truth A post on Social said that given the low consumer prices, the Fed should lower interest rates. He has been calling for a rate cut for some time, so the market still has some uncertainty about the timing of the Fed's subsequent rate cuts, but the probability is in September. The probability of keeping interest rates unchanged this month is high. The US dollar index is also supported and continues to rebound. Gold fluctuated higher from around 3344 in the morning of the previous trading day. During the European session, it refreshed the intraday high and touched the 3366 line under pressure and maintained repeated narrow consolidation. After the data was released, it first rebounded quickly to the 3360 line and then quickly fell back. After two repetitions, it finally moved downward. In the evening, it fell below the intraday low and once touched around 3320 and then stabilized and rebounded. The daily line closed with a middle shadow. Technically, the continuation of the previous convergence triangle after the break is currently returning to the downward channel again.
Pay attention to the pressure of 3342/44 during the day, and pay attention to the support near 3308 below. If it falls below 3308 again, it will return to the downward channel.

XAU/USD 15 July Intraday AnalysisH4 Analysis:
-> Swing: Bullish.
-> Internal: Bullish.
You will note that price has targeted weak internal high on two separate occasions forming a double top which is a bearish reversal pattern. This is in-line with HTF bearish pullback phase.
Remainder of analysis and bias remains the same as analysis dated 23 April 2025.
Price has now printed a bearish CHoCH according to my analysis yesterday.
Price is now trading within an established internal range.
Intraday Expectation:
Price to trade down to either discount of internal 50% EQ, or H4 demand zone before targeting weak internal high priced at 3,500.200.
Note:
The Federal Reserve’s sustained dovish stance, coupled with ongoing geopolitical uncertainties, is likely to prolong heightened volatility in the gold market. Given this elevated risk environment, traders should exercise caution and recalibrate risk management strategies to navigate potential price fluctuations effectively.
Additionally, gold pricing remains sensitive to broader macroeconomic developments, including policy decisions under President Trump. Shifts in geopolitical strategy and economic directives could further amplify uncertainty, contributing to market repricing dynamics.
H4 Chart:
M15 Analysis:
-> Swing: Bullish.
-> Internal: Bullish.
H4 Timeframe - Price has failed to target weak internal high, therefore, it would not be unrealistic if price printed a bearish iBOS.
The remainder of my analysis shall remain the same as analysis dated 13 June 2025, apart from target price.
As per my analysis dated 22 May 2025 whereby I mentioned price can be seen to be reacting at discount of 50% EQ on H4 timeframe, therefore, it is a viable alternative that price could potentially print a bullish iBOS on M15 timeframe despite internal structure being bearish.
Price has printed a bullish iBOS followed by a bearish CHoCH, which indicates, but does not confirm, bearish pullback phase initiation. I will however continue to monitor, with respect to depth of pullback.
Intraday Expectation:
Price to continue bearish, react at either M15 supply zone, or discount of 50% internal EQ before targeting weak internal high priced at 3,451.375.
Note:
Gold remains highly volatile amid the Federal Reserve's continued dovish stance, persistent and escalating geopolitical uncertainties. Traders should implement robust risk management strategies and remain vigilant, as price swings may become more pronounced in this elevated volatility environment.
Additionally, President Trump’s recent tariff announcements are expected to further amplify market turbulence, potentially triggering sharp price fluctuations and whipsaws.
M15 Chart:

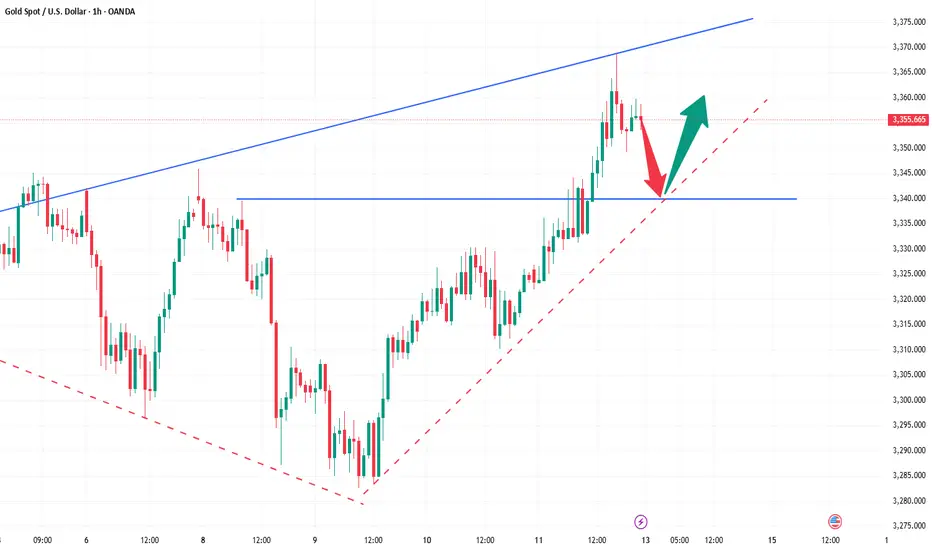
Two lines of defense for bulls: 3340 and 3330 are the key!Gold maintains a strong pattern in the short term, and it is recommended to mainly buy on dips. The short-term support below focuses on the neckline of the hourly line at 3340 last Friday. The more critical support is locked at the 3330 line. This range is an important watershed for judging the continuation of short-term bullish momentum. As long as the daily level can remain stable above the 3330 mark, the overall trend will remain upward. Before falling below this position, we should adhere to the idea of buying low and buying low, and rely on key support levels to arrange long orders. At present, the price has completed a technical breakthrough and broke through the upper edge of the 3330 convergence triangle under the dual positive factors of Trump's tariff landing to stimulate risk aversion and the support of the Fed's interest rate cut expectations, and formed three consecutive positive daily lines. It is necessary to pay attention to the short-term pressure at the 3375 line. The overall operation strategy will be combined with the real-time trend prompts during the trading session, and pay attention to the bottom in time.
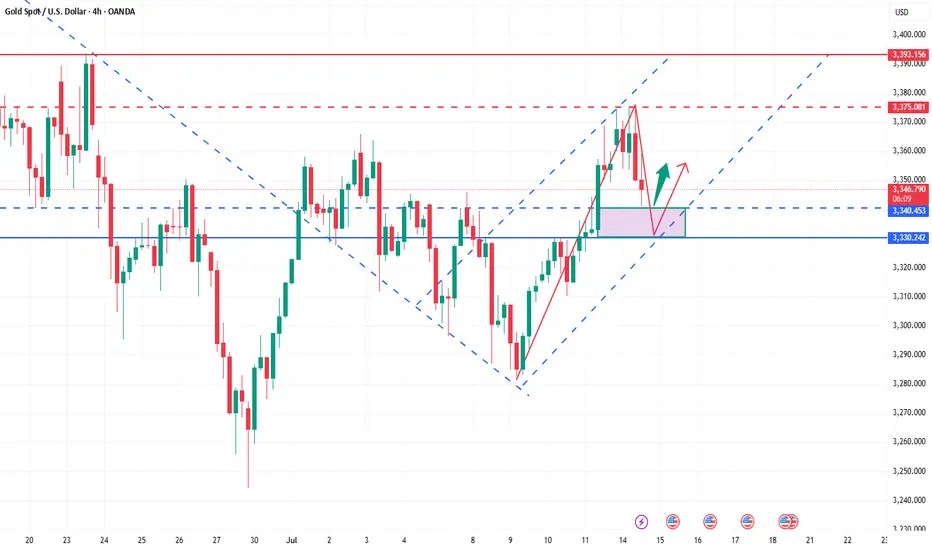
Gold rises strongly, aiming for a new high!Last Friday, gold continued to rise strongly, breaking through 3320 in the Asia-Europe session and accelerating its rise. The European session broke through the 3340 mark continuously. The US session broke through 3369 and then fell back. The daily line closed with a big positive line. It broke through the high for three consecutive days and returned to above 3360. The unilateral bullish pattern was re-established. Today, the gold price jumped high and broke through 3370 and then fluctuated at a high level. Although it rushed up, the strength was limited. It must be adjusted after a short-term retracement before it can continue to rise. Therefore, in terms of operation, we continue to maintain the main idea of retreating and multiplying. Pay attention to the 3340-3345 area for short-term support during the day, and look at the 3330 line for strong support. If it does not break, it will continue to be a good opportunity to buy low and do more. Taking advantage of the trend is still the current main tone. As long as the daily level does not break 3330, the bullish structure will not be destroyed.
🔹Support focus: 3340-3345, key support level 3330
🔹Resistance focus: 3380-3393 area
1️⃣ If the price falls back to 3340-3350, a light long position will be intervened, with the target of 3365-3370. A strong breakthrough can see a new high;
2️⃣ If the price rises to 3380-3393 and is under pressure, a short-term short position adjustment can be tried, with a short-term target of around 3360.
The specific real-time points and position arrangements will be updated at the bottom. Interested friends are advised to pay attention to my strategy tips in a timely manner and seize every opportunity reasonably.
It is the right time to go long after the shock and adjustmentGold opened higher at 3364 today, and after a brief surge to 3374, it entered a stage of shock and retracement. Our plan to arrange short orders near 3370 was successfully implemented, and we stopped profits in batches in the 3360-3355 range, making short-term profits. Overall, although it jumped higher due to the stimulus of news such as the increase in tariffs over the weekend, the momentum of the surge is limited, and the technical side still needs to retrace to digest the gains.
At present, the market has returned to the technical rhythm. The key support refers to the breakthrough point of 3340-3345 last Friday. Further exploration will look at the strong support of 3330. The overall rhythm is still mainly to arrange long orders near the low support, and going with the trend is the key. As long as the 3330 support is not broken, the daily line structure will still maintain a strong bullish trend. Do not blindly chase the short position. The operation of short orders against the trend needs to be particularly cautious. I will promptly remind you of the specific operation strategy according to the changes in the market. You can pay attention to the bottom notification. It is recommended that you keep paying attention and respond to the market rhythm steadily.
Reference for gold operation strategy: Go long on gold near the 3345-3355 area, target the 3365-3370 line. If it breaks above 3370, you can continue to hold and hope for further continuation.

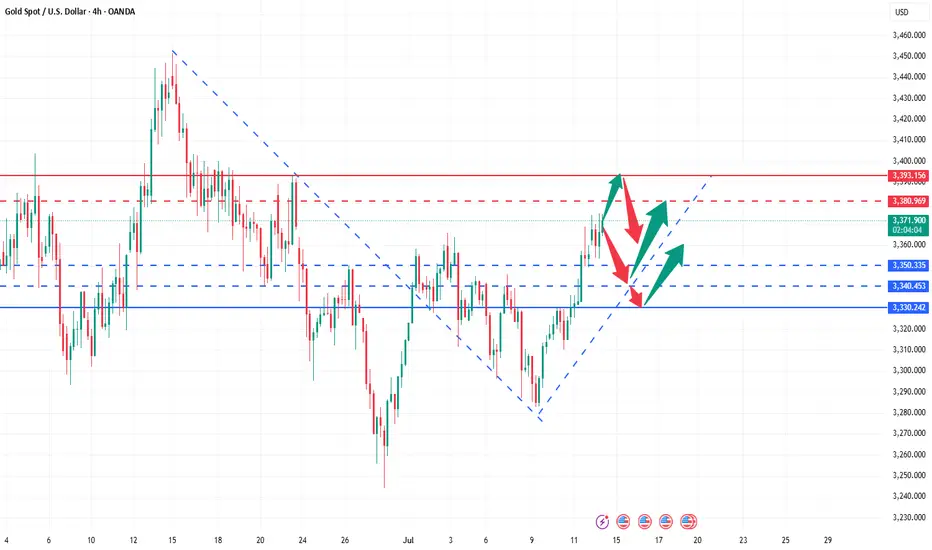
The 3400 mark will be the key for next week!Gold has been up and down this week, and the shock wash has intensified. It bottomed out and rebounded at 3282, and then steadily pulled up. After a slow rise to 3368 on Friday, the retracement was limited, and finally closed at 3355. So can gold be expected to be strong? Is it possible to reach 3400 next week? From the trend point of view, it is too early to say that it will turn strong. 3400 is an insurmountable barrier. Only by breaking through 3400 can we see a stable strong bull. If it is suppressed below 3400, the bulls will not be stable and may fall back at any time. We can only see large range fluctuations. From the overall trend point of view, gold is currently fluctuating widely in the large range of 3250-3400. It is safe to buy below 3300, and it is easy to go up. After all, it is still upward in the long run. Next week, we will focus on the gains and losses of the 3400 mark. It is not recommended to chase the high position directly on Monday. On the one hand, the interruption of the market after the weekend holiday can easily cause discontinuous rise. In addition, after three consecutive positive lines on the daily line, there will either be a negative correction and a fall, or a large positive volume. Combined with the current trend and rhythm of gold, be careful of a high-rise fall, and it is easy to get trapped by chasing long positions at high positions. Don't feel that it will soar as soon as it rises, and the high point of 3500 seems to be within reach; don't feel that it will fall sharply as soon as it falls, and the 3000 mark is not a dream. We should stay away from those who sing long when it rises and sing short when it falls. The direction is not because you see it, so you believe it, but because you believe it, so you see it. There will always be a time when you chase the rise and sell the fall and you will return with nothing.
Moreover, the high point of 3365 has not formed a substantial break and stabilized. On Monday, we still need to focus on the gains and losses of this position, so we need to look at it from two aspects:
1. If it rises directly at the opening, pay attention to the pressure near 3370-3380 and you can go short, and the target is 3350-3340!
2. If the market falls back at the opening, go long around 3340-3330, with the target above the high point of 3360-3368.
Gold has a big win this dayNews: In the early Asian session on Thursday (July 10), spot gold fluctuated slightly higher, once regaining the 3320 mark, and is currently trading around $3323/ounce. On Wednesday, gold prices rebounded strongly after hitting a two-week low of 3282.61, closing at $3313.38/ounce, showing strong momentum for recovery. Trump extended the tariff agreement to August 1 and began to collect tariffs again. Although it eased market tensions, his remarks will not be extended after the expiration, and he issued tariff threats, which increased global trade uncertainty and pushed up risk aversion. The market is still facing economic and inflation concerns brought about by tariffs, which will also weaken the dollar and support gold prices.
Analysis of gold trend: After the full-day trend of gold on Wednesday, the lowest price was 3282 and the highest price was 3322, with a range of $40, so the bullish strength has come out. However, Li Siyu would like to emphasize here that gold is in a bullish trend for the time being, but it is not an absolute unilateral trend, but a fluctuating trend under the bullish trend. There are opportunities both up and down on Thursday. If it rises, you can look at 3345, and if it falls, you can look at 3285. Therefore, before there is an absolute strong unilateral rise, it is recommended that everyone keep looking at this wave of gold fluctuations. However, today's market is more important. Today is Thursday, and Thursday is often the node of the weekly change time. Today is likely to continue the rebound on Wednesday and continue to rise.
From a technical point of view, the daily line closed positive under the rebound of 3282 and stood firmly above the lower Bollinger track. If it continues to close positive on Thursday, it is necessary to pay attention to the suppression of the middle Bollinger track, that is, the high point of 3345. After breaking through, there will be another wave of rise on Friday, and you can see 3365 and 3400. Therefore, today's gains and losses of 3345 are crucial. The strong rebound in the H4 cycle is quite obvious. When it falls, it is very weak and continuous. When it rises, it is very strong and continuous. It depends on whether the continuous positive trend on Thursday will continue. Now the K-line stands firmly on the middle track of Bollinger. If it continues to rise, the high point of the upper track is around 3340-3345. In principle, the continuation of the long position will test the high point of the upper track. Therefore, it is still possible to go long today. Of course, it is not an absolute long trend now, so don't chase the rise. The support below the small cycle is around 3310-3300. If it falls back to this price, you can continue to go long. Clearly define the target. Today, we will see the gains and losses of 3345.
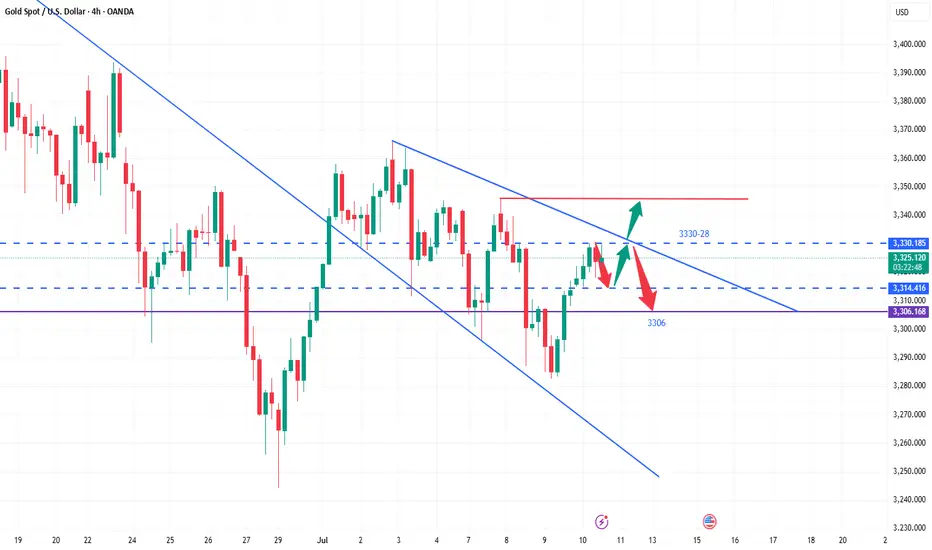
Repeated cycle, timing is keyMarket fluctuations are oscillating about 70% of the time, and only about 30% of the time are unilateral upward or downward, so accumulating small victories into big victories is the magic weapon for long-term success. What we need to do is to plan our positions well, and make this investment with a plan, direction, and guidance. A good trader will make your investment journey smoother. How to operate in a volatile market? The ancients said: Do not do good things because they are small, and do not do evil things because they are small. If we move it to financial management, it can be understood as: Don't be too greedy, enter the market in batches. When entering the market and covering positions, the position should be small. Although the profit is less, accumulating small victories into big victories is the key to success. The investment philosophy is composed of the investor's psychology, philosophy, motivation, and technical level. It mainly includes: stability, patience, independent thinking, discipline, trend, etc.
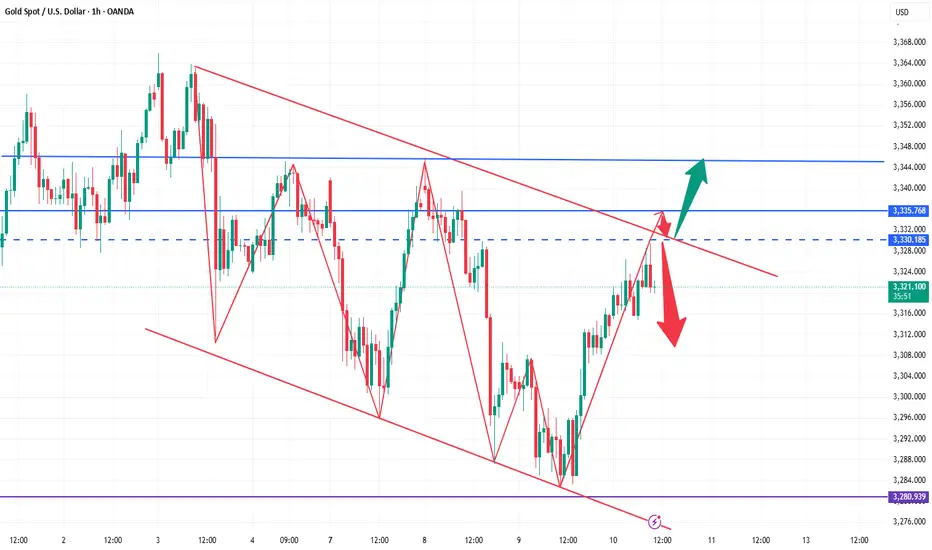
Judging from the current trend of gold, in the 4H cycle, it has touched 3330 many times under pressure, and the K-line has continuously closed with upper shadows, which is quite similar to yesterday's rhythm. So we must first look at the strength of the decline. The support below is at 3314 and 3306. In terms of operation, it should be treated as mainly long and auxiliary short. The upper pressure still focuses on the gains and losses of 3330.
Gold shows signs of slowing down, are the bears ready?This wave of bullish pull-up is a complete rebound. With the help of the timeliness of fundamentals, the highest rebound only reached around 3330 and then began to fall. At this time, many people probably think that the short-term trend has begun to change. I still stick to my bearish thinking. The important target pressure is definitely around 3330. As long as this position is under pressure and falls back to 3280 again, it will be shaky. At present, the stop loss is based on the break of 3335. If it really breaks, it will be similar to the break of 3280. Even if 3340-3345 is short, it is also a short-term bull correction. If the falling channel is broken, I can't convince myself to continue to be short and stick to it. Once 3335 breaks, I can really confirm the reversal of the short-term trend. Then 3280 will also be the bottom of the medium term. In short, since I am shorting near 3320-3330 in the direction of the band and the short-term negative, I think that the stop loss will be given to 3335. The stop profit target is uncertain. The channel has not been broken. Now the short-term long and short conversions are frequent. It is definitely the best choice in my own trading system. No one will win all the time. It is too fake to win all the time. Make your moves according to your own ideas without regrets. If this wave of strategy verification fails, everyone is welcome to supervise. We dare to take responsibility and review every judgment.
The risks of shorting at low levels have been informed!Today, I have reminded you many times not to chase short positions at low levels. Now you can see that gold has bottomed out and rebounded. We also bought gold in batches at 3285-3295, and the long positions also made perfect profits. I believe that friends who follow my articles can see that I have always emphasized not to short at low levels. It is also obvious to everyone that we bought long positions near 3295-3285. In the future, we will continue to pay attention to the suppression of the upper 3318-3325 line. If the rebound does not break, we will look for opportunities to short. I hope everyone can grasp the entry position and hold the profit. The rebound will first look at the previous break point of the 3325 line, and then short when the rebound is suppressed! If your current gold operation is not ideal, I hope I can help you avoid detours in your investment. Welcome to communicate with me!
From the current analysis of gold trend, today's upper short-term resistance focuses on the hourly top and bottom conversion position of 3318-3325. The intraday rebound relies on this position to go short once and look down. The lower short-term support focuses on 3280. The overall support relies on the 3280-3325 area to maintain the main tone of high-altitude low-multiple cycles. In the mid-line position, keep watching and do less, be cautious in chasing orders, and wait for the opportunity to enter the market after the key points are in place.
Gold operation strategy: short gold rebounds near 3318-3325, target 3305-3295.
7.4 Non-farm payrolls exploded, and expectations for the Fed’s rOn Thursday, as the strong US employment data dispelled the market's expectations of the Fed's recent rate cut, the US dollar index rose sharply before the US market, returned to above the 97 mark, and once rose to an intraday high of 97.42.
Spot gold fell sharply, once falling to $3311 during the session, a drop of more than $50 from the intraday high, and then recovered some of its losses and remained near 3330 for consolidation.
The current upper suppression position of the daily line is almost here at 3350, and the lower support is located at 3320-25.
So if it is maintained in the range of consolidation, it is likely to be rectified at 3320-50.
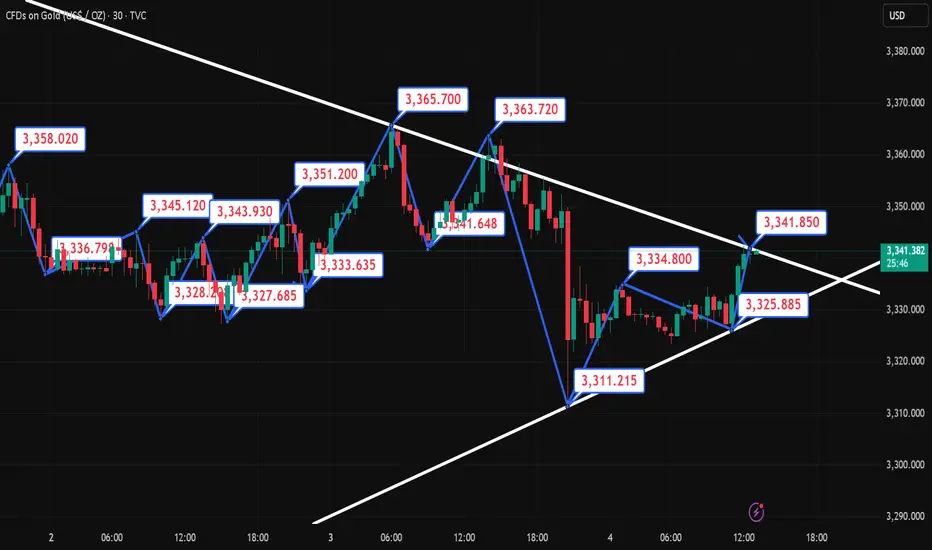
Secondly, from the hourly chart:
It can be seen from the trend of 3247 to 3365.
The Fibonacci 618 position is exactly here at 3320.
Although the lowest point last night was pierced to around 3311, it can be seen that the entity still closed above 3320.
As long as 3320 cannot be broken, the best case scenario is to maintain it at 3320-50 for consolidation. If not, once 3350 is broken, the high point of 3365 will definitely not be able to be maintained.
Therefore, for today's operation, try to maintain the high-selling and low-buying range of 3320-50.
How to accurately grasp gold trading opportunities?Gold rebounded as expected, and fell under pressure at the 3295-3296 line during the European session. This position was the key resistance level for the previous top and bottom conversion, and the range shock pattern continued. In terms of operation, the high-altitude and low-multiple ideas remain unchanged, and we will continue to pay attention to the short opportunities after the rebound.
📉 Operational ideas:
Short orders can be arranged in batches in the 3295-3311 area, and the target is 3280-3270 area;
If the support below 3260-3255 is effective, you can consider taking the opportunity to reverse long orders and participate in short-term.
📌Key position reference:
Upper pressure: 3295, 3311
Lower support: 3278-3275, 3260-3255
Gold strategy idea suggests shorting at 3291-3293, perfectly capturing the rebound high point! Smoothly reached the profit target of 3275, gaining 18pips! If you are not able to flexibly respond to the market in trading, and are not good at adjusting your trading ideas and rhythm in time with the market rhythm, you can pay attention to the bottom notification 🌐 to get more specific operation details and strategy updates. Let us work together to flexibly and steadily pursue more profits in the ever-changing market!

Gold remains strong, and we continue to buy on pullbacks!ADP employment unexpectedly turned negative, and the probability of a rate cut increased again
The ADP employment report released on the same day showed that the number of private sector jobs in the United States decreased by 33,000 in June, the first net loss since March 2023, and the May data was also significantly revised down to +29,000. After the release of the ADP data, the probability of the Federal Reserve's interest rate cut in July quickly rose from 20% before the data was released to about 27.4%. The market's bet on a rate cut before September has almost been fully factored in, and federal funds futures also show that the possibility of a 50 basis point rate cut has risen to 22%.
This "frown-making" data released a strong signal of cooling in the labor market before Thursday's non-farm report. If today's non-farm continues to be weaker than expected, it may force the Federal Reserve to act faster.
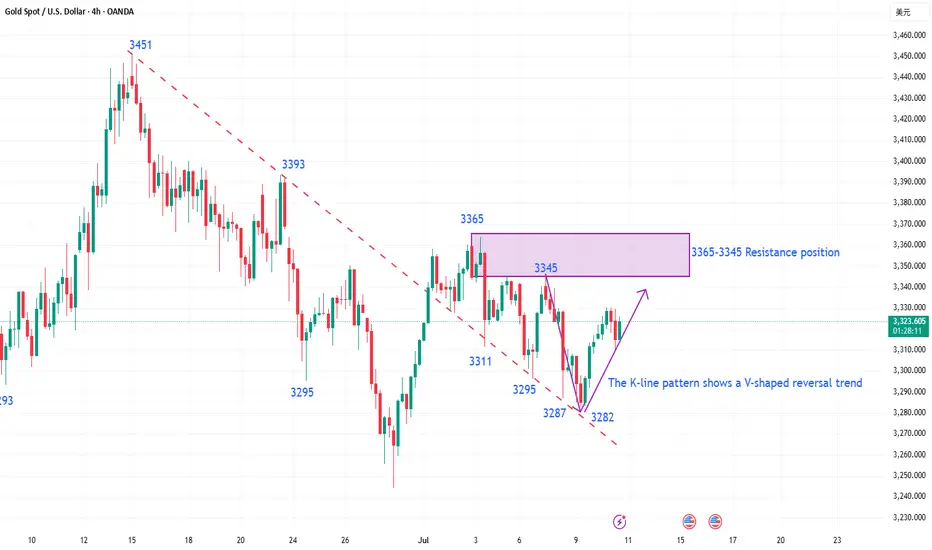
Gold opened high and then retreated continuously. From the daily chart, gold is still in an upward trend in the long term. The previous market rebounded effectively after touching the downward trend line, and the rebound force was considerable. With the restart of the bullish force, the main idea can carry the trend and do more on dips. In addition, from the 4-hour chart, gold has broken through the previous downward trend line and has gone out of the V-shaped reversal pattern, which means that the previous short-term downward trend has ended. At present, a new trend is also opening up in the 4-hour chart. The rise of gold has also established an upward trend line. You can consider buying on dips based on the upward trend line 3332. However, due to insufficient bottoming time in the previous stage, it may still face the risk of decline, so you should set the stop loss with caution. From the 1-hour chart, gold fell after opening high, and the bullish trend remains unchanged. The points for long orders can consider 3334 and 3328.
Gold operation suggestions: Go long on gold near 3325-3335, with a target of 3350-3360.
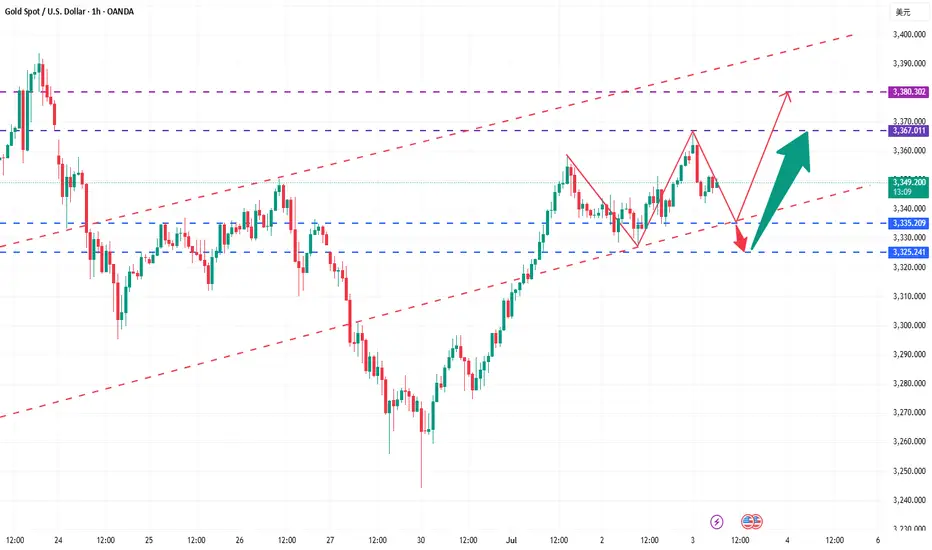
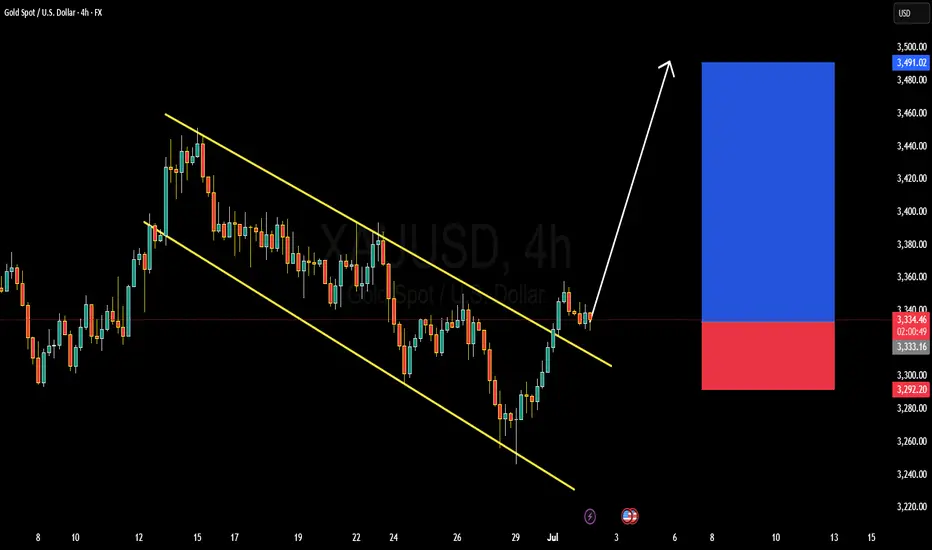
XAUUSD BULLISH OR BEARISH DETAILED ANALYSISXAUUSD has officially broken out of a well-structured descending channel on the 4H timeframe, suggesting a potential shift in market sentiment from bearish to bullish. After multiple rejections from the lower boundary and consistent pressure on the upper trendline, the breakout above the channel confirms a strong upside bias. Price is currently holding near 3330, and I’m now eyeing 3450 as the next key resistance level. This setup aligns perfectly with a textbook channel breakout, offering a solid risk-to-reward scenario for bullish continuation.
The breakout comes at a time when macro fundamentals are supportive of gold strength. With rising uncertainty surrounding global inflation trends and mixed economic signals from the US, investors are leaning back into gold as a defensive hedge. The US dollar has shown signs of softening amid increasing speculation that the Fed could pivot to a more neutral stance in the coming months. This gives gold more breathing room to the upside, especially as real yields begin to flatten out.
Geopolitical tensions, especially renewed volatility around global trade and Middle East developments, are further fueling demand for safe-haven assets like XAUUSD. The recent breakout is backed by rising volume and momentum indicators turning bullish, making this move more sustainable than a short-term spike. Gold typically thrives during periods of uncertainty and shifting rate expectations, and that’s exactly the phase we are entering now.
From a technical and macroeconomic perspective, gold is showing strength just as the broader markets begin to wobble. This breakout isn’t just about structure—it’s supported by real macro catalysts and seasonal demand strength. I'm bullish toward the 3450 zone, and any retest of the broken channel resistance now turned support would offer an attractive entry. Staying focused on gold as a top performer in Q3 could offer strong upside with controlled risk.
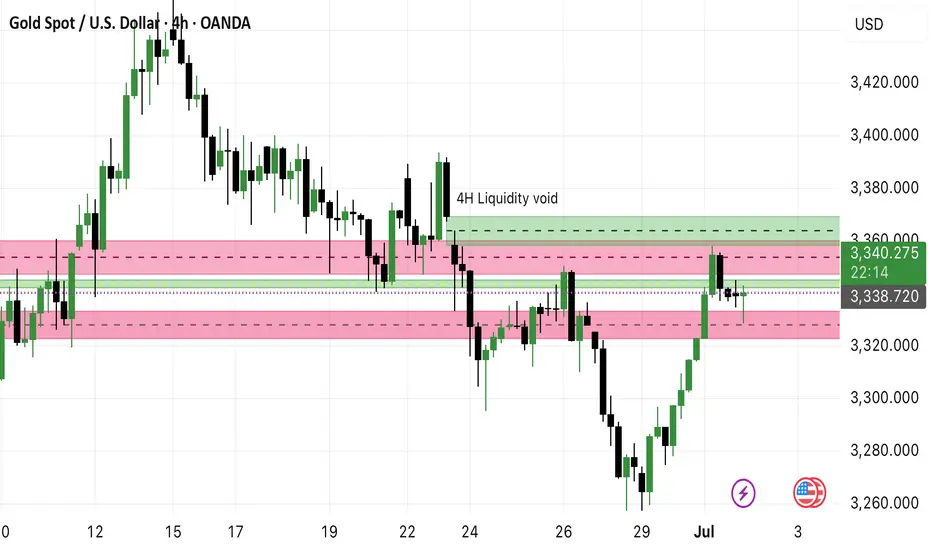
Gold(XAU/USDT) Analysis - Targeting 4H Liquidity VoidOANDA:XAUUSD
**Gold (XAUUSD) Trade Idea 🚀**
**🔍 Setup:**
- Price bounced from **Daily FVG (red)** & is now in **4H FVG (green)** ✅
- Targeting **4H liquidity void at 3400** 🎯
**⚡ Key Levels:**
- **Support:** 3338 / 3320
- **Resistance:** 3360 / 3380 / **3400 (main target)**
**🎯 Plan:**
- **Entry:** Hold above 3341 or pullback to 4H FVG
- **Stop:** Below 3320
- **Target:** 3400
*(Chart attached 👆)*
Liquidity Void: Its an imbalance which has high probability of getting filled
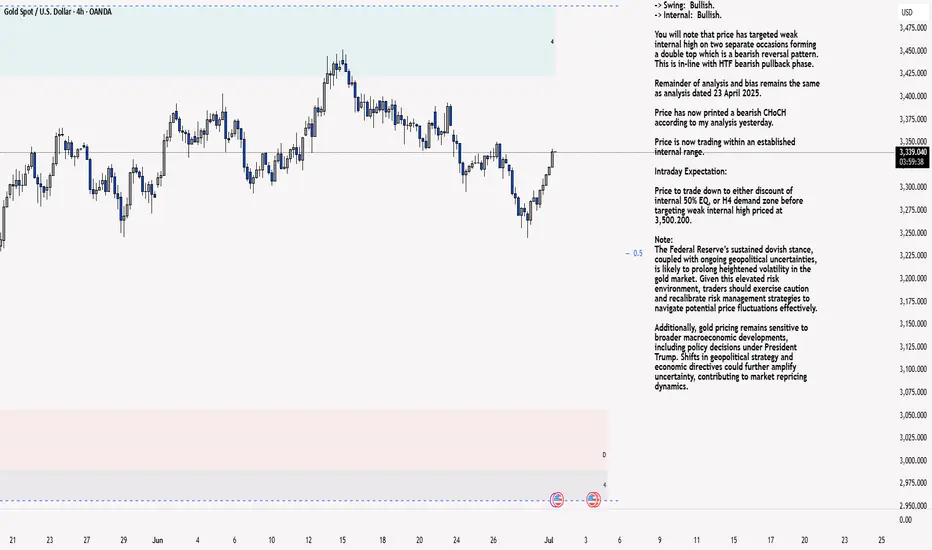
XAU/USD 01 July 2025 Intraday AnalysisH4 Analysis:
-> Swing: Bullish.
-> Internal: Bullish.
You will note that price has targeted weak internal high on two separate occasions forming a double top which is a bearish reversal pattern. This is in-line with HTF bearish pullback phase.
Remainder of analysis and bias remains the same as analysis dated 23 April 2025.
Price has now printed a bearish CHoCH according to my analysis yesterday.
Price is now trading within an established internal range.
Intraday Expectation:
Price to trade down to either discount of internal 50% EQ, or H4 demand zone before targeting weak internal high priced at 3,500.200.
Note:
The Federal Reserve’s sustained dovish stance, coupled with ongoing geopolitical uncertainties, is likely to prolong heightened volatility in the gold market. Given this elevated risk environment, traders should exercise caution and recalibrate risk management strategies to navigate potential price fluctuations effectively.
Additionally, gold pricing remains sensitive to broader macroeconomic developments, including policy decisions under President Trump. Shifts in geopolitical strategy and economic directives could further amplify uncertainty, contributing to market repricing dynamics.
H4 Chart:
M15 Analysis:
-> Swing: Bullish.
-> Internal: Bullish.
H4 Timeframe - Price has failed to target weak internal high, therefore, it would not be unrealistic if price printed a bearish iBOS.
The remainder of my analysis shall remain the same as analysis dated 13 June 2025, apart from target price.
As per my analysis dated 22 May 2025 whereby I mentioned price can be seen to be reacting at discount of 50% EQ on H4 timeframe, therefore, it is a viable alternative that price could potentially print a bullish iBOS on M15 timeframe despite internal structure being bearish.
Price has printed a bullish iBOS followed by a bearish CHoCH, which indicates, but does not confirm, bearish pullback phase initiation. I will however continue to monitor, with respect to depth of pullback.
Intraday Expectation:
Price to continue bearish, react at either M15 supply zone, or discount of 50% internal EQ before targeting weak internal high priced at 3,451.375.
Note:
Gold remains highly volatile amid the Federal Reserve's continued dovish stance, persistent and escalating geopolitical uncertainties. Traders should implement robust risk management strategies and remain vigilant, as price swings may become more pronounced in this elevated volatility environment.
Additionally, President Trump’s recent tariff announcements are expected to further amplify market turbulence, potentially triggering sharp price fluctuations and whipsaws.
M15 Chart:
XAUUSD I Trade Update Welcome back! Let me know your thoughts in the comments!
** XAUUSD Analysis - Listen to video!
We recommend that you keep this pair on your watchlist and enter when the entry criteria of your strategy is met.
Please support this idea with a LIKE and COMMENT if you find it useful and Click "Follow" on our profile if you'd like these trade ideas delivered straight to your email in the future.
Thanks for your continued support!Welcome back! Let me know your thoughts in the comments!
