GOLD (XAUUSD): Learn What to Expect This Week🥇
Price action analysis on Gold.
Directional bias & key levels.
Trading plan & thoughts.
❤️Please, support this video with like and comment!❤️
Goldusd

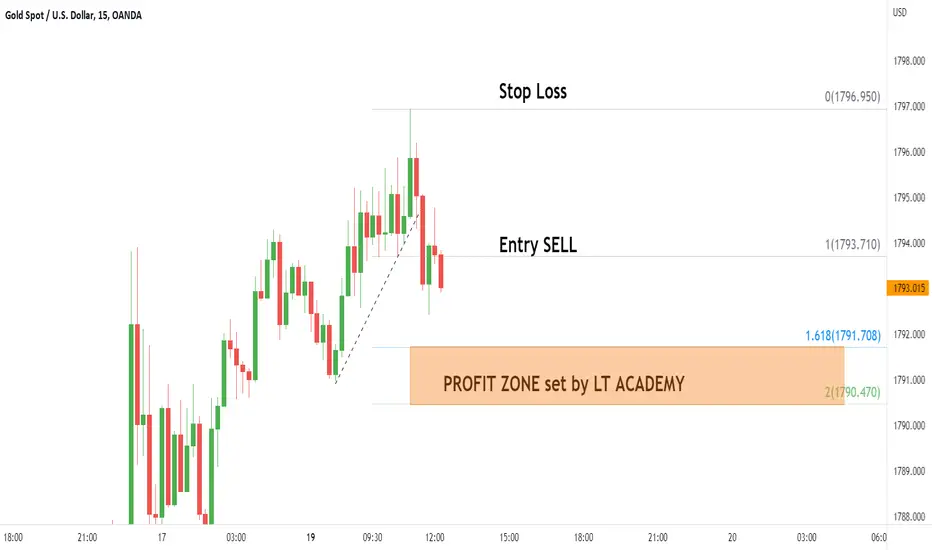
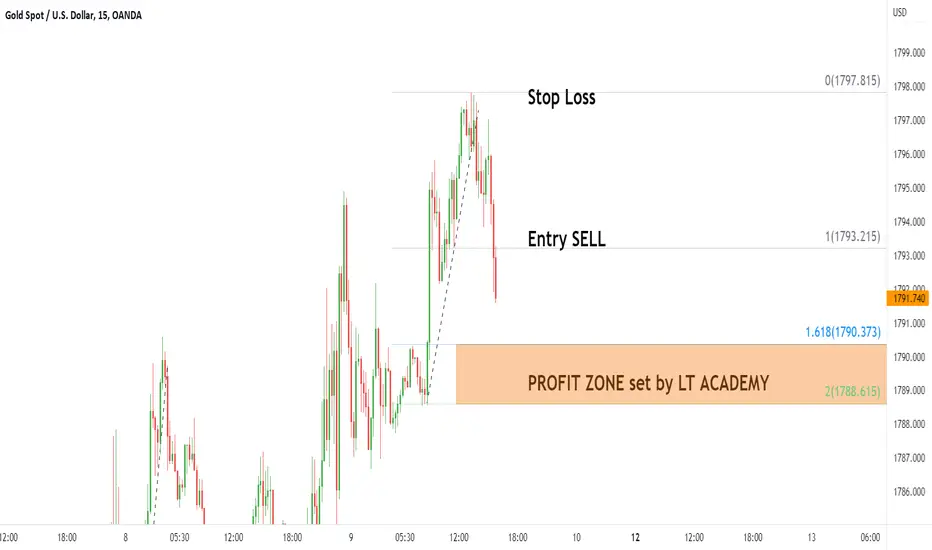
Xauusd intraday trading & Back to the earth 📉 19 DEC 2022Gold intraday trading alerts
3 steps must fullfil before entry
1. 1st breakout done
2. Retracement done
3. 2nd breakout and see you at home📉
Trading alerts always available to give
Good luck traders....
FOMC Rates Decision and the Effect on Gold**Repost from Dec 13th 2022 since the original post disappeared**
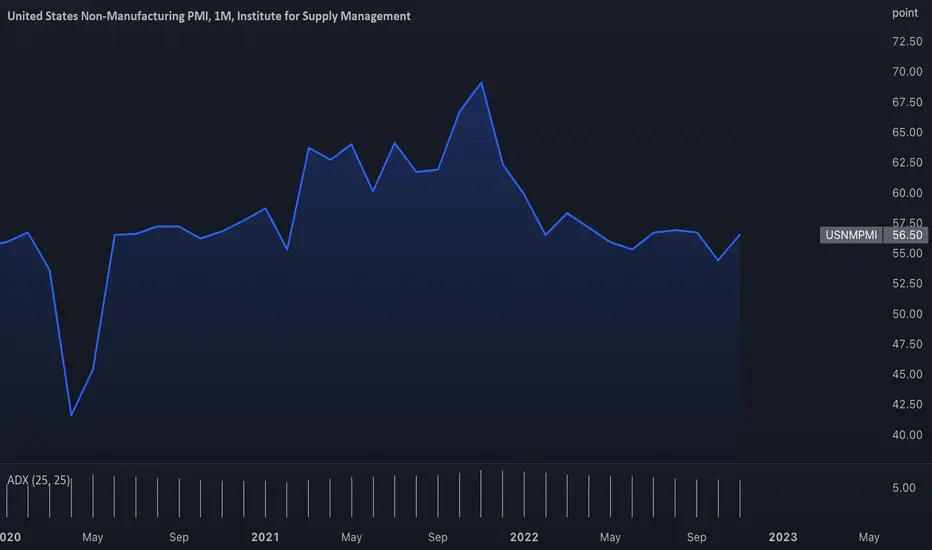
Economic indicators from the past month indicate that the price of services is the key factor that helps prevent a rapid decline in inflation , although the price of goods had already dropped considerably and the labor market remained strong, showing no signs of slowing down the inflation rate.
ECONOMICS:USCPMI
In the graph above, one of the key economic indicators, the ISM Service Sector Index for the month of November, accelerated to 56.5, above the forecasted rate of 53.5 and the previous month's level of 54.4. Despite the rise in interest rates from the FED, the ISM indicated that the services sector is still going strong, correlating with the positive outcome in labor market data.
FOMC Rates Decision 15 December 2022
Previous = 3.75-4.00% - Prediction from Bloomberg, OE, Forex Factory, Trading Economics = 4.25-4.50%
Bloomberg, Oxford Economics, the Forex Factory, and Trading Economics predict that the Federal Reserve's interest rate will rise by 0.50%. The market forecast for the highest interest rate as of December 9, 2022 is 4.75-5.00% in May 2023, with a gradual decrease beginning in the third quarter of 2023.
However, because the services sector has been performing well, the FED's interest rate cut may come later than expected by the market. Thus, from a fundamental standpoint, the USD is expected to continue appreciating, albeit not as strongly as in recent months. On the other hand, the gold price is expected to fall.
Gold (XAUUSD): Bearish Outlook For Next Week 🟡
Hey traders,
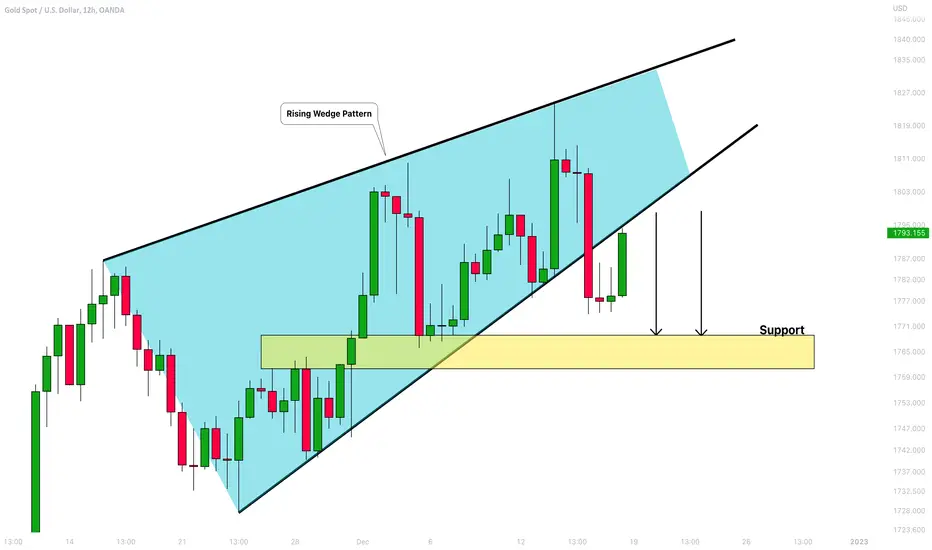
Gold has nicely dropped this week.
The price broke and closed below a support line of a rising wedge pattern with a high momentum bullish candle.
I believe that we may expect a bearish continuation next week.
Next support on focus will be 1760 - 1769 area.
❤️If you have any questions, please, ask me in the comment section.
Please, support my work with like, thank you!❤️
gold simple break down this I my take on gold for the upcoming market open gold looks to be shifting into a short term selling bias and has broken structure on the 4h where i will ne looking for confirmations along with other time frames that
gold will be continuing to sell
happy trading

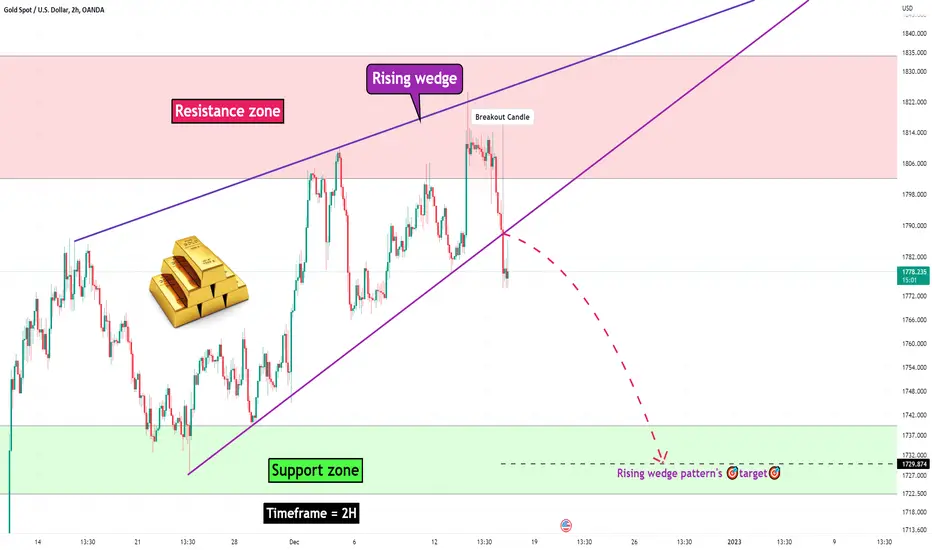
🥇Gold🥇 Analyze (Short term, 12/15/2022)!!!Gold completed the rising wedge pattern on the resistance zone.
Gold was able to break the lower line of the rising wedge pattern with a red candle with a long body.
I expect Gold will go down at least until the support zone.
Gold Analyze ( XAUUSD ), Timeframe 2H⏰.
Do not forget to put Stop loss for your positions (For every position you want to open).
Please follow your strategy, this is just my idea, and I will be glad to see your ideas in this post.
Please do not forget the ✅' like '✅ button 🙏😊 & Share it with your friends; thanks, and Trade safe.
GOLD (XAUUSD): Detailed Technical Outlook🥇
Multiple time frame analysis on Gold.
Price action & key levels.
Potential scenarios explained.
❤️Please, support this video with like and comment!❤️

Gold: Still the best for the long runEven if the price drops, the rate will be higher than today in the long run, Gold isn't going anywhere anytime soon.
This is called investment, not trading.

GOLD BULLISH PROJECTIONGOLD has been liquidating for some days, Following yesterday FOMC news Gold showed a bearish momentum which Is a fake inducement move ,Usually news creates fake moves. I am looking forward to taking a buy at around 1789 where strong imbalance were created ,If the 1789 imbalance level will be taken out It is possible that a very deep retracement to 1820 is about to happen..My target on Buy is 1820
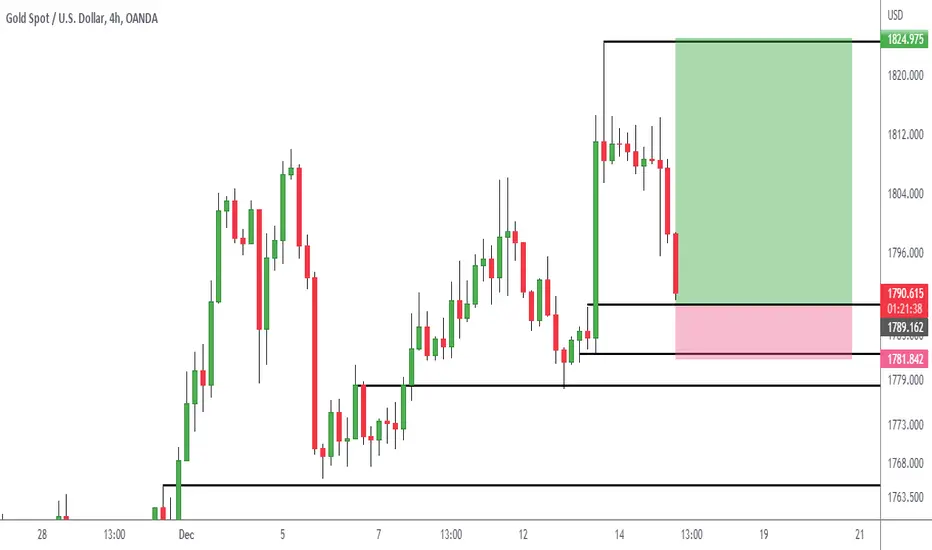
Can we get a RETEST @1790?My overall direction is Bearish since I think the DXY will go up after the fed meeting. That being the case, I feel a good entry will be up around the 90 area. IF it doesnt blow right through i'll be looking to get in around there.

🥇Gold🥇 Analyze (Short term, 12/13/2022)!!!🌊Since microwave 3 was a sharpie wave, we can expect microwave 5 to be truancated.
After confirming the end of the 5th, we can expect Gold to fall until the end of the microwave 4.
Gold Analyze ( XAUUSD ), Timeframe 15min⏰.
Do not forget to put Stop loss for your positions (For every position you want to open).
Please follow your strategy, this is just my idea, and I will be glad to see your ideas in this post.
Please do not forget the ✅' like '✅ button 🙏😊 & Share it with your friends; thanks, and Trade safe.
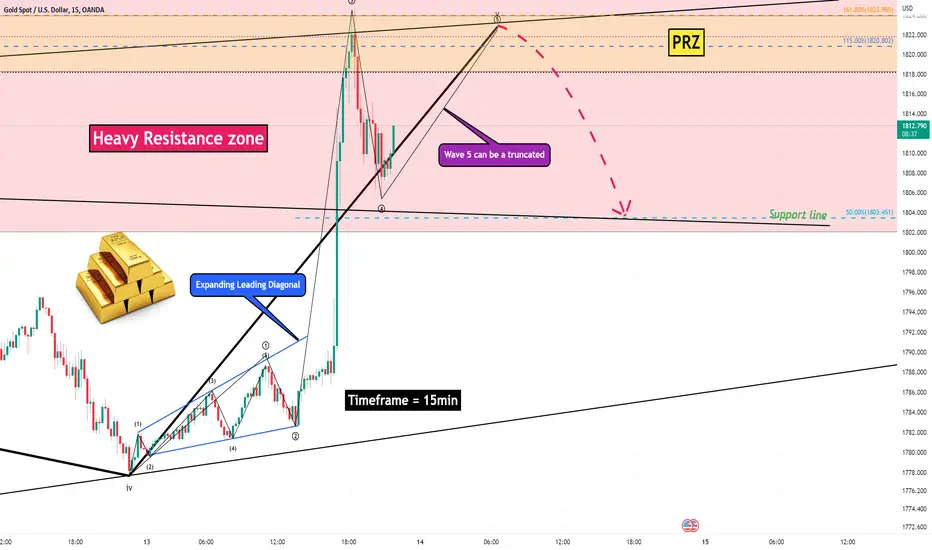
🥇Gold🥇 Analyze (Short term, 12/13/2022)!!!Gold is running near the PRZ(Price Reversal Zone) & the trend line & lower line of descending channel.
I expect Gold will go up at least to the upper line of descending channel.
Gold Analyze ( XAUUSD ), Timeframe 15min⏰.
Do not forget to put Stop loss for your positions (For every position you want to open).
Please follow your strategy, this is just my idea, and I will be glad to see your ideas in this post.
Please do not forget the ✅' like '✅ button 🙏😊 & Share it with your friends; thanks, and Trade safe.

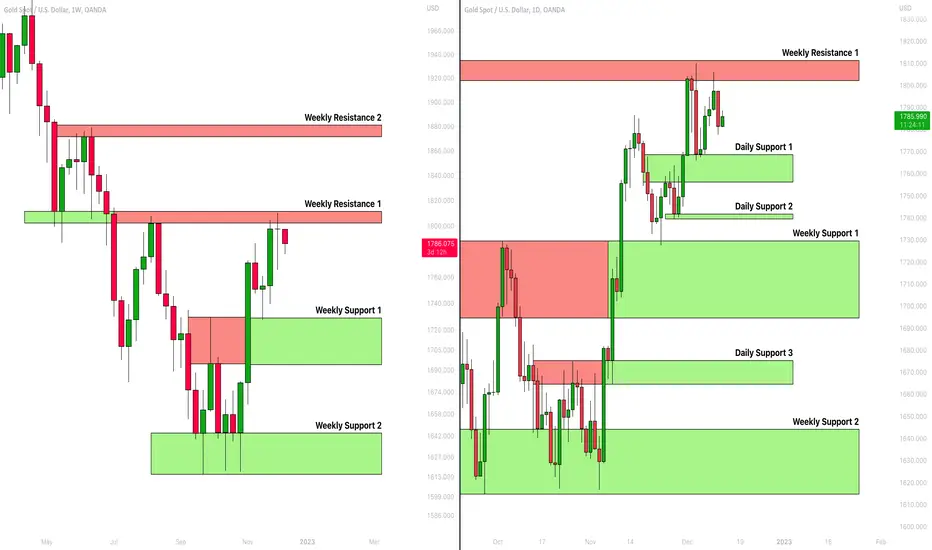
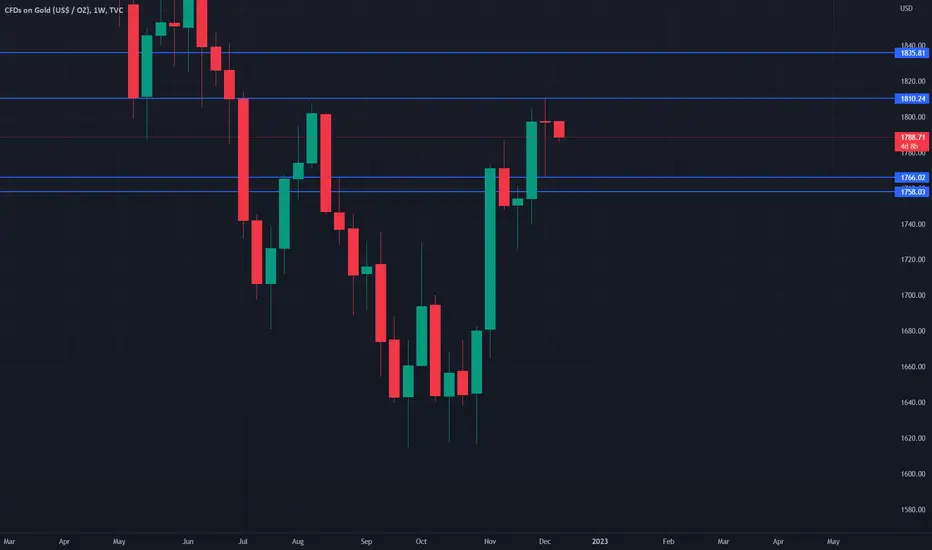
GOLD (XAUUSD): Detailed Structure Analysis 🥇
Here is my latest structure analysis on Gold.
Weekly Structures:
Resistance 1: 1802 - 1811 area
Resistance 2: 1871 - 1881 area
Support 1: 1693 - 1728 area
Support 2: 1615 - 1645 area
Daily Structures:
Support 1: 1756 - 1768 area
Support 2: 1739 - 1741 area
Support 3: 1664 - 1675 area
Consider these structure for pullback/breakout trading.
❤️If you have any questions, please, ask me in the comment section.
Please, support my work with like, thank you!❤️
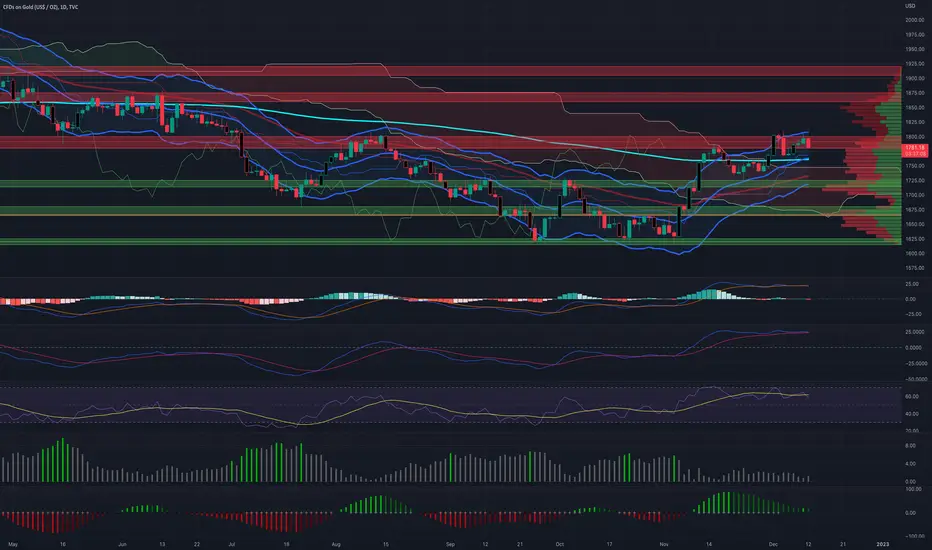
Gold's Double TopGold has a much more calm market compared to other assets I track and trade. Here would be where I would start opening short positions.
We've seen a double top on the 1-day chart, also breaking out and back into our Keltner Channel, a sign of a reversal.
If we break support of the 200-day EMA, which I believe we will, we'll retest our $1,720 area for support.
My last call on gold was in the $1,620 area.
We've seen a convergence in our TSI MACD and RSI.
our RSI is highly overvalued.
TSI and MACD seem to be on the cusp of a bearish crossover.
GOLD Weekly Volatility Analysis 12-16 Dec 2022 GOLD Weekly Volatility Analysis 12-16 Dec 2022
We can see that currently the implied volatility for this week is around 2.14%, down from 2.18% from last week according to DVOL data
With this in mind, currently from ATR point of view we are located in the 2nd percentile,
while according to GVZ, we are on 4th percentile.
Based on this, we can expect that the current weekly candles ( from open to close ) are going to between:
Bullish: 1.677% movement
Bearish: 1.694% movement
At the same time, with this data, we can make a top/bot channel which is going to contain inside the movement of this asset,
meaning that there is a 22.3% that our close of the weekly candle of this asset is going to be either above/below the next channel:
TOP: 1836
BOT: 1758
Taking into consideration the previous weekly high/low, currently for this candle there is :
30% probability we are going to touch previous high 1810
67% probability we are going to touch previous low 1766
Lastly, from the technical analysis point of view, currently from
Weekly timeframe indicates 50% BULLISH trend from the moving averages index
Daily timeframe indicates 64% BULLISH trend from the moving averages index
4H timeframe indicates 27% BULLISH trend from the moving averages index
Gold (XAUUSD): Detailed Video Analysis & Trading Plan 🟡
Multiple time frame analysis on Gold.
Price action & key levels.
Directional bias & thoughts.
❤️Please, support this video with like and comment!❤️

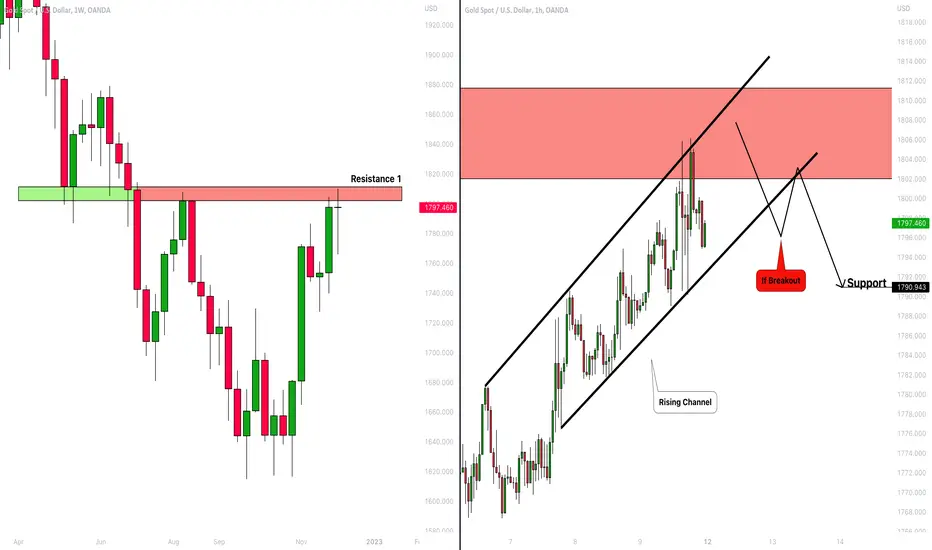
Gold (XAUUSD): Technical Outlook & Things to Watch Next Week 🟡
Hey traders,
This week was very bullish for gold and the price managed to return to a key weekly resistance cluster
from where it retraced earlier.
Next week, I will look for a pullback trade.
I spotted a rising parallel channel on 1H time frame and my trigger to short will be its bearish breakout - 1H candle close below its support.
A bearish continuation will be expected to 1790 then.
Alternatively, the next bullish move will initiate ONLY AFTER a breakout of the underlined resistance.
If you want to buy, I would suggest you waiting for its bullish breakout.
❤️If you have any questions, please, ask me in the comment section.
Please, support my work with like, thank you!❤️
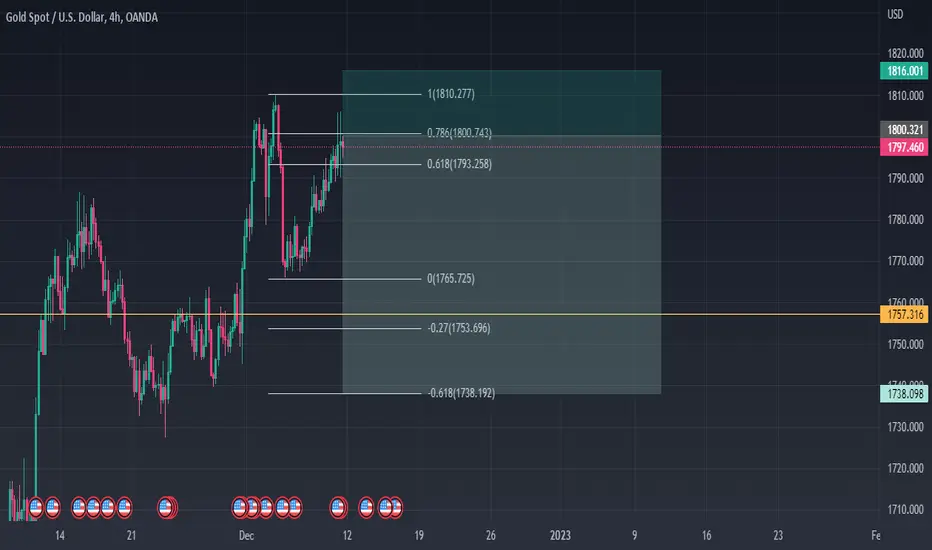
Gold short from 1800.Gold looks good for a short position. Lets give it a try.
Short entry:1800.
Stop loss: 1816.
Target :1739.
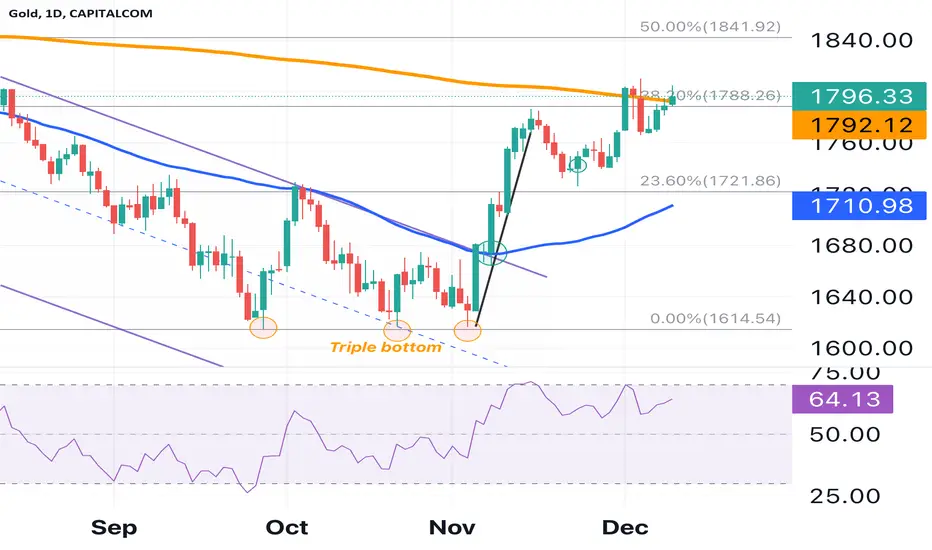
Gold: Strategies to Consider Ahead of US CPI and FOMCGold continues to hover around the 1,800-mark level, currently testing a multiple resistance zone, which includes the major 200DMA at 1,790, the 38.2% Fibonacci retracement level of the 2022 lows to highs and the December high at 1,810.
The recent gold rally has been supported by a weaker USD, therefore the US CPI and FOMC meeting next week will provide important new information for gold. These significant events have the potential to steer patterns in both the US dollar and US interest rates moving into the beginning of the new year.
A higher-than-expected inflation rate or reading over the 7.7% estimate for October might be the major negative risk for gold.
Although an increase in inflation is unlikely to influence the Fed's decision to raise rates by 50 basis points the next day, which appears to be a done deal according to the swap market, it could lead to a rate repricing in 2023, with the market already pricing in about 50 basis point cuts in the second half of the year.
So all eyes will be on how the dollar reacts to the CPI report, as well as the Fed's new macroeconomic forecasts and Powell's remarks.
The market may be pricing in an extremely dovish Federal Reserve in 2023; if expectations are not reached, this may generate negative responses in assets that are more sensitive to fluctuations in US interest rates, such as gold.
Gold's last month rally has been aided by a weaker dollar
Gold is trading "rich" vs US real yields
The price of the precious metal is now also trading at a level that is richer than what would be predicted by US 10-year real yields. US 10-year nominal yields have dropped below 3.5%, sending real yields down to 1.2%.
However, if US rate expectations shift due to a hawkish Fed or higher-than-expected CPI, gold may see profit taking and bearish pressure from here.
How could gold react next week?
There is a non-negligible risk of seeing a higher-than-expected CPI and the Fed reassessing the importance of tackling inflation, signalling that there is still room to hike, especially given last week's extraordinarily strong NFP print (270K vs. 200K forecast) and this week's strong services PMI and PPI data.
Consequently, the headwinds that have characterised gold's movement this year might return next week. Therefore, if there is a repricing of real rates as a result of a hawkish Federal Reserve, gold prices may decline and fall below $1,750/oz (-1std of the 20DMA Bollinger band).
If downside risks do not materialise, a lower-than-expected November US CPI reading and a Federal Reserve warning of rising recession risks in 2023 would be viewed as the ideal cocktail for gold prices to push decisively above $1,810 levels and attempt to attack $1,841/oz, where they would have completed a 50% retracement from 2022 lows to highs. This would be a significant change in the gold trend, indicating that the worst is likely behind us.
🥇Gold🥇 Analyze (12/09/2022)!!!Gold made a Rising Wedge pattern on PRZ(Price Reversal Zone).
Also, Gold was able to break the lower line of the rising wedge.
I expect Gold will go down at least to the uptrend line.
Gold Analyze ( XAUUSD ), Timeframe 30min⏰.
Do not forget to put Stop loss for your positions (For every position you want to open).
Please follow your strategy, this is just my idea, and I will be glad to see your ideas in this post.
Please do not forget the ✅' like '✅ button 🙏😊 & Share it with your friends; thanks, and Trade safe.

XAUUSD top-down analysis, UPDATED!!Hello traders, this is a complete multiple timeframe analysis of this pair. We see could find significant trading opportunities as per analysis upon price action confirmation we may take this trade. Smash the like button if you find value in this analysis and drop a comment if you have any questions or let me know which pair to cover in my next analysis.

Xauusd intraday trading & Back to the earth 📉 09 DEC 2022Gold intraday trading alerts
3 steps must fullfil before entry
1. 1st breakout done
2. Retracement done
3. 2nd breakout and see you at home📉
Trading alerts always available to give
Good luck traders....
Gold (XAUUSD): Bullish Outlook 🟡
Hey traders,
As we discussed on a live stream yesterday, Gold looks very bullish locally.
The price has nicely respected a wide intraday demand zone and formed a double bottom on that breaking its neckline.
Probabilities are high that the market will keep growing.
Goals: 1795 / 1806
❤️If you have any questions, please, ask me in the comment section.
Please, support my work with like, thank you!❤️
