Goldusd

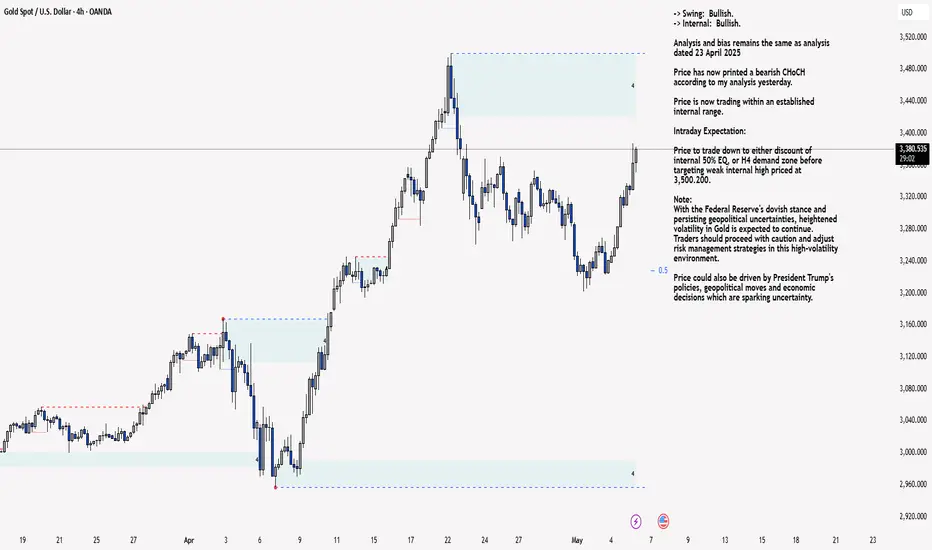
XAU/USD 09 May 2025 Intraday AnalysisH4 Analysis:
-> Swing: Bullish.
-> Internal: Bullish.
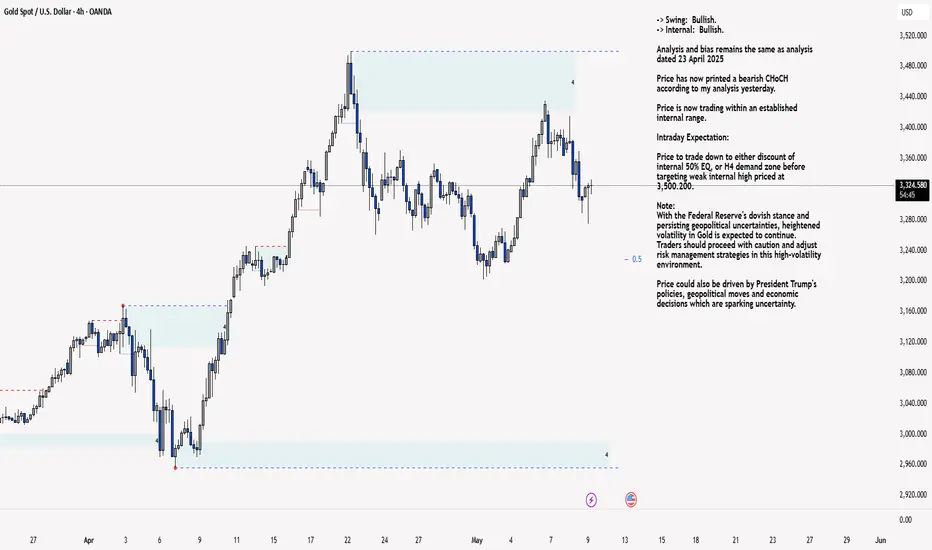
Analysis and bias remains the same as analysis dated 23 April 2025
Price has now printed a bearish CHoCH according to my analysis yesterday.
Price is now trading within an established internal range.
Intraday Expectation:
Price to trade down to either discount of internal 50% EQ, or H4 demand zone before targeting weak internal high priced at 3,500.200.
Note:
With the Federal Reserve's dovish stance and persisting geopolitical uncertainties, heightened volatility in Gold is expected to continue. Traders should proceed with caution and adjust risk management strategies in this high-volatility environment.
Price could also be driven by President Trump's policies, geopolitical moves and economic decisions which are sparking uncertainty.
H4 Chart:
M15 Analysis:
-> Swing: Bullish.
-> Internal: Bullish.
Analysis and bias remains remains the same as analysis dated 07 May 2025.
As mentioned in yesterday's analysis that I would continue to monitor price and depth of bearish pullback following previous bullish iBOS.
Price did not pull back with any significance, therefore, I will apply discretion and not mark the previous iBOS. I have however marked this in red.
Price continued bullish and subsequently printed a bearish iBOS to indicate, but not confirm bearish pullback phase initiation.
Price is now trading within an established internal range, however, I will continue to monitor depth of pullback.
Intraday Expectation:
Price to trade down to either discount of internal 50% EQ, or M15 supply zones before targeting weak internal high priced at 3,435.055
Note:
With the Federal Reserve maintaining a dovish stance and ongoing geopolitical tensions, volatility in Gold prices is expected to remain elevated. Traders should exercise caution, adjust risk management strategies, and stay prepared for potential price whipsaws in this high-volatility environment.
Trump's tariff announcement will most likely cause considerably increased volatility and whipsaws.
M15 Chart:
XAU/USD 08 May 2025 Intraday AnalysisH4 Analysis:
-> Swing: Bullish.
-> Internal: Bullish.
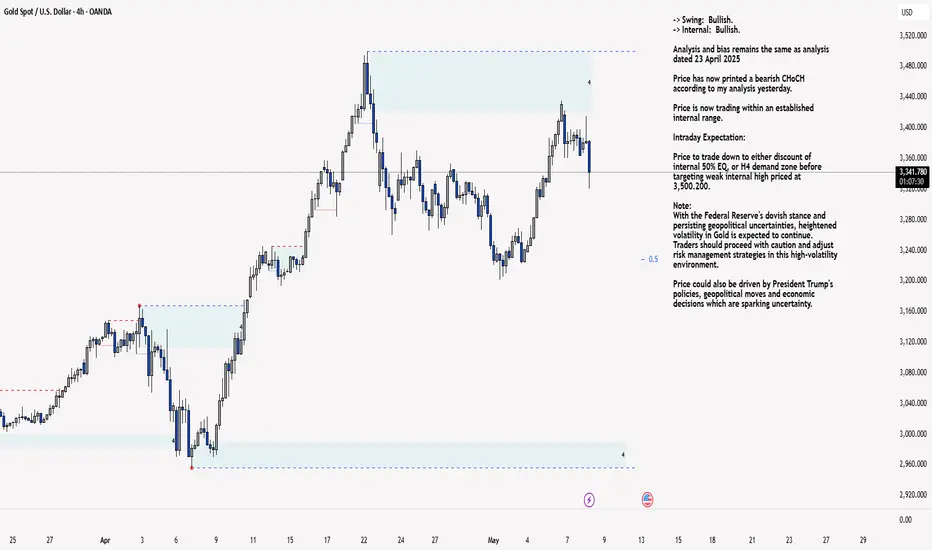
Analysis and bias remains the same as analysis dated 23 April 2025
Price has now printed a bearish CHoCH according to my analysis yesterday.
Price is now trading within an established internal range.
Intraday Expectation:
Price to trade down to either discount of internal 50% EQ, or H4 demand zone before targeting weak internal high priced at 3,500.200.
Note:
With the Federal Reserve's dovish stance and persisting geopolitical uncertainties, heightened volatility in Gold is expected to continue. Traders should proceed with caution and adjust risk management strategies in this high-volatility environment.
Price could also be driven by President Trump's policies, geopolitical moves and economic decisions which are sparking uncertainty.
H4 Chart:
M15 Analysis:
-> Swing: Bullish.
-> Internal: Bullish.
analysis and bias remains remains the same as yesterday's analysis dated 07 May 2025.
As mentioned in yesterday's analysis that I would continue to monitor price and depth of bearish pullback following previous bullish iBOS.
Price did not pull back with any significance, therefore, I will apply discretion and not mark the previous iBOS. I have however marked this in red.
Price continued bullish and subsequently printed a bearish iBOS to indicate, but not confirm bearish pullback phase initiation.
Price is now trading within an established internal range, however, I will continue to monitor depth of pullback.
Intraday Expectation:
Price to trade down to either discount of internal 50% EQ, or M15 supply zones before targeting weak internal high priced at 3,435.055
Note:
With the Federal Reserve maintaining a dovish stance and ongoing geopolitical tensions, volatility in Gold prices is expected to remain elevated. Traders should exercise caution, adjust risk management strategies, and stay prepared for potential price whipsaws in this high-volatility environment.
Trump's tariff announcement will most likely cause considerably increased volatility and whipsaws.
M15 Chart:
XAU/USD 07 May 2025 Intraday AnalysisH4 Analysis:
-> Swing: Bullish.
-> Internal: Bullish.
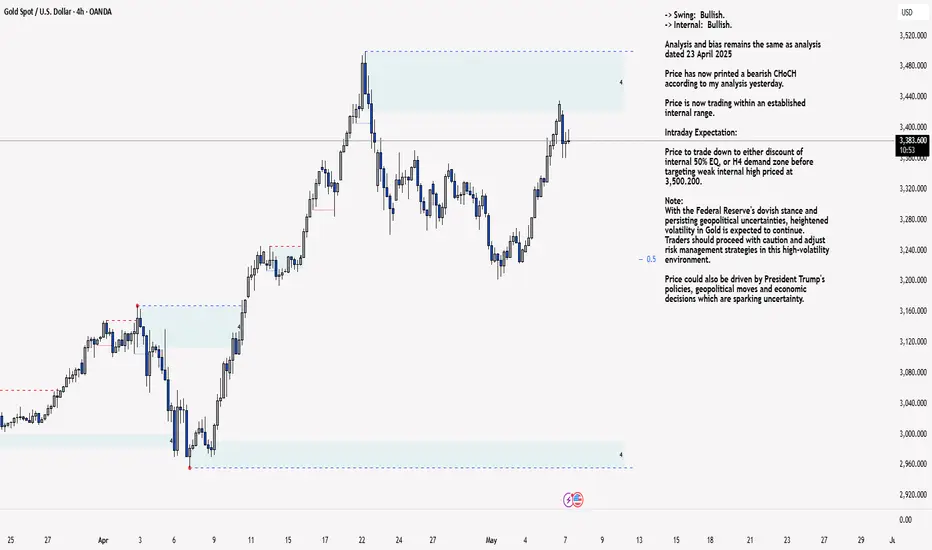
Analysis and bias remains the same as analysis dated 23 April 2025
Price has now printed a bearish CHoCH according to my analysis yesterday.
Price is now trading within an established internal range.
Intraday Expectation:
Price to trade down to either discount of internal 50% EQ, or H4 demand zone before targeting weak internal high priced at 3,500.200.
Note:
With the Federal Reserve's dovish stance and persisting geopolitical uncertainties, heightened volatility in Gold is expected to continue. Traders should proceed with caution and adjust risk management strategies in this high-volatility environment.
Price could also be driven by President Trump's policies, geopolitical moves and economic decisions which are sparking uncertainty.
H4 Chart:
M15 Analysis:
-> Swing: Bullish.
-> Internal: Bullish.
As mentioned in yesterday's analysis that I would continue to monitor price and depth of bearish pullback following previous bullish iBOS.
Price did not pull back with any significance, therefore, I will apply discretion and not mark the previous iBOS. I have however marked this in red.
Price continued bullish and subsequently printed a bearish iBOS to indicate, but not confirm bearish pullback phase initiation.
Price is now trading within an established internal range, however, I will continue to monitor depth of pullback.
Intraday Expectation:
Price to trade down to either discount of internal 50% EQ, or M15 supply zones before targeting weak internal high priced at 3,435.055
Note:
With the Federal Reserve maintaining a dovish stance and ongoing geopolitical tensions, volatility in Gold prices is expected to remain elevated. Traders should exercise caution, adjust risk management strategies, and stay prepared for potential price whipsaws in this high-volatility environment.
Trump's tariff announcement will most likely cause considerably increased volatility and whipsaws.
M15 Chart:
XAU/USD 06 May 2025 Intraday AnalysisH4 Analysis:
-> Swing: Bullish.
-> Internal: Bullish.
Analysis and bias remains the same as analysis dated 23 April 2025
Price has now printed a bearish CHoCH according to my analysis yesterday.
Price is now trading within an established internal range.
Intraday Expectation:
Price to trade down to either discount of internal 50% EQ, or H4 demand zone before targeting weak internal high priced at 3,500.200.
Note:
With the Federal Reserve's dovish stance and persisting geopolitical uncertainties, heightened volatility in Gold is expected to continue. Traders should proceed with caution and adjust risk management strategies in this high-volatility environment.
Price could also be driven by President Trump's policies, geopolitical moves and economic decisions which are sparking uncertainty.
H4 Chart:
M15 Analysis:
-> Swing: Bullish.
-> Internal: Bearish.
Price did not print according to previous analysis by failing to target weak internal low.
Price has now printed a bullish iBOS. This is potentially due to the fact that H4 TF was in a bearish pullback phase and reacted at discount of 50% internal EQ which could mean that H4 TF bearish pullback phase is now over and targeting the weak internal high, which is mentioned in H4 analysis.
Price has also printed a bearish CHoCH which indicates, but not confirms bearish pullback phase initiation.
Price is now trading within an established internal range, however, I will continue to monitor depth of pullback.
Intraday Expectation:
Price to trade down to either discount of internal 50% EQ, or M15 supply zones before targeting weak internal high priced at
Note:
With the Federal Reserve maintaining a dovish stance and ongoing geopolitical tensions, volatility in Gold prices is expected to remain elevated. Traders should exercise caution, adjust risk management strategies, and stay prepared for potential price whipsaws in this high-volatility environment.
Trump's tariff announcement will most likely cause considerably increased volatility and whipsaws.
M15 Chart:
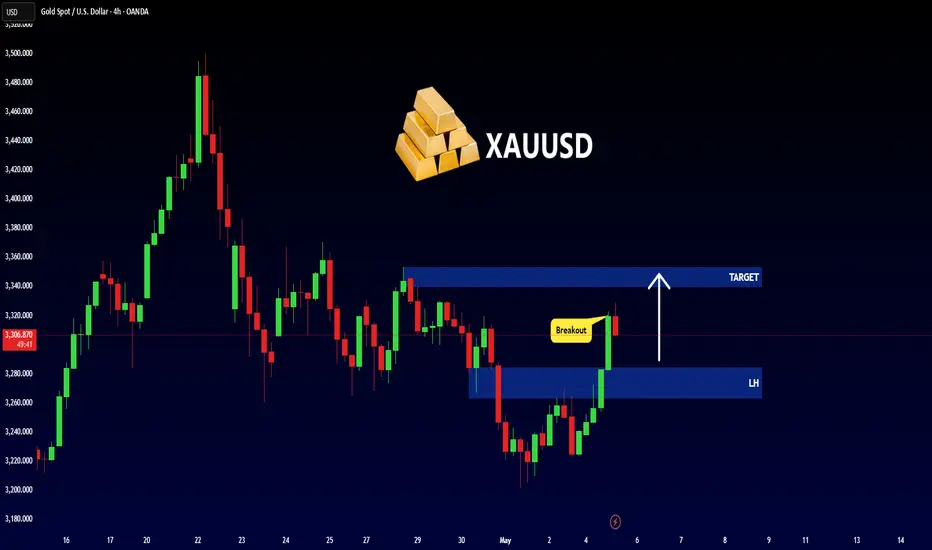
GOLD - NEW BREAKOUT !Hello Traders !
The Gold price failed to create a new lower low.
The Last lower high is broken (change of character).
So, I expect a bullish move🚀
______________
TARGET: 3340.000🎯
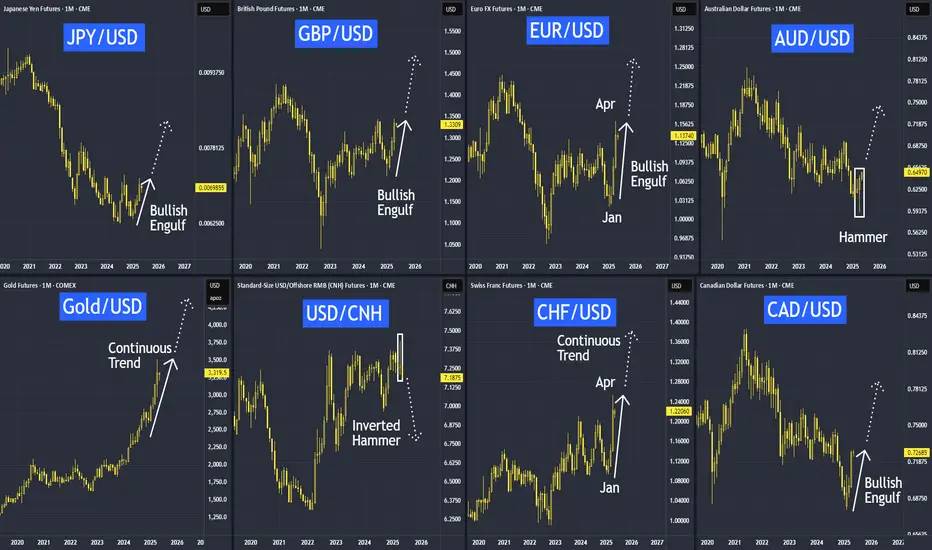
Dollar Decline Against All Major CurrenciesThe Dollar’s decline didn’t start with the recent ‘Liberation Day’ tariffs. In fact, it has been gradually weakening since the 1970s.
More recently, however, the Dollar has lost value against many currencies since January. Why is that?
Why have the USD/CHF and USD/SGD strengthened against the US Dollar over the past few decades? One reason is that both countries have managed their money supply with discipline. For example, as of end-2024, Switzerland’s net federal debt stood at 141 billion Swiss franc, their debt to GDP ratio at 17.2%.
In contrast, the United States has expanded its national debt at an alarming rate. Some might point out that Japan’s debt-to-GDP ratio is even higher—around 230%. That is why the Japanese Yen has also been in decline for decades.
Why does printing more money through QE and increasing the money supply weaken a currency?
Just imagine in a close economy with 10 people and 1 central bank. If the central bank printed $100 and distributed equally to the 10, each of them will receive $10 to buy 10 available cheesecakes.
But now the central bank decided to print $1,000 and each person will have $100 to buy 10 available cheesecakes.
The global economy is not a close, but an open system.
When the US and other major economies printed massive amounts of money, they didn’t just inflate their own economies—they exported inflation worldwide. This contributes to rising cost of living not all around the world.
In my view, Gold is also a currency pair against the US at the start of 1971. The moment dollar unpeg itself from gold, gold appreciates. With each QE, we can see how the currencies have diluted with gold and inflation appreciating over these years.
Why different currencies have started to appreciate against the USD since January this year?
We can see all the currencies have either reached its bottomed in January and started moving higher or it formed a reversal pattern like the Aussie dollar and the Dollar Yuan, in this case with this inverted hammer, it is indicating Dollar Yuan to reverse downward, meaning dollar coming off and yuan to appreciate.
January was President Trump inauguration and February was when he rolled out tariffs against Canada, Mexico and China, and the market do not like that and has been selling the USD against the rest of the currencies?
If US has printed the so much money, but why other than Swiss franc and Singapore Dollar, many other currencies have been depreciating against dollars over the past decades?
I’d like to hear your thoughts on this.
Euro FX Futures & Options
Ticker: 6E
Minimum fluctuation:
0.000050 per Euro increment = $6.25
Disclaimer:
• What presented here is not a recommendation, please consult your licensed broker.
• Our mission is to create lateral thinking skills for every investor and trader, knowing when to take a calculated risk with market uncertainty and a bolder risk when opportunity arises.
CME Real-time Market Data help identify trading set-ups in real-time and express my market views. If you have futures in your trading portfolio, you can check out on CME Group data plans available that suit your trading needs tradingview.sweetlogin.com
Trading the Micro: www.cmegroup.com
XAU/USD 02 May 2025 Intraday AnalysisH4 Analysis:
-> Swing: Bullish.
-> Internal: Bullish.
Analysis and bias remains the same as analysis dated 23 April 2025
Price has now printed a bearish CHoCH according to my analysis yesterday.
Price is now trading within an established internal range.
Intraday Expectation:
Price to trade down to either discount of internal 50% EQ, or H4 demand zone before targeting weak internal high priced at 3,500.200.
Note:
With the Federal Reserve's dovish stance and persisting geopolitical uncertainties, heightened volatility in Gold is expected to continue. Traders should proceed with caution and adjust risk management strategies in this high-volatility environment.
Price could also be driven by President Trump's policies, geopolitical moves and economic decisions which are sparking uncertainty.
H4 Chart:
M15 Analysis:
-> Swing: Bullish.
-> Internal: Bearish.
As mentioned in yesterday's analysis dated 01 May 2025 whereby I mentioned that I would continue to monitor price and depth of bullish pullback following the printing of a bearish iBOS followed by a bullish CHoCH.
Price did not pullback significantly enough to warrant a further bearish iBOS, therefore, I will apply discretion and not classify this as such, I have however marked in red.
Price has since continued bearish, subsequently printing a bullish CHoCH.
Internal structure is now established, however, I will continue to monitor price regarding depth of pullback as previous.
Intraday Expectation:
Price to trade up to either premium of internal 50% EQ, or M15 supply zone before targeting weak internal low priced at 3,201.955
Note:
With the Federal Reserve maintaining a dovish stance and ongoing geopolitical tensions, volatility in Gold prices is expected to remain elevated. Traders should exercise caution, adjust risk management strategies, and stay prepared for potential price whipsaws in this high-volatility environment.
Trump's tariff announcement will most likely cause considerably increased volatility and whipsaws.
M15 Chart:

XAU/USD 01 May 2025 Intraday AnalysisH4 Analysis:
-> Swing: Bullish.
-> Internal: Bullish.
Analysis and bias remains the same as analysis dated 23 April 2025
Price has now printed a bearish CHoCH according to my analysis yesterday.
Price is now trading within an established internal range.
Intraday Expectation:
Price to trade down to either discount of internal 50% EQ, or H4 demand zone before targeting weak internal high priced at 3,500.200.
Note:
With the Federal Reserve's dovish stance and persisting geopolitical uncertainties, heightened volatility in Gold is expected to continue. Traders should proceed with caution and adjust risk management strategies in this high-volatility environment.
Price could also be driven by President Trump's policies, geopolitical moves and economic decisions which are sparking uncertainty.
H4 Chart:
M15 Analysis:
-> Swing: Bullish.
-> Internal: Bearish.
Price has printed as per my analysis dated 24 April 2025 by targeting weak internal low and printing a bearish iBOS.
Price has subsequently printed a bullish CHoCH to indicate, but not confirm bullish pullback phase initiation.
Internal structure is now established, however, I will continue to monitor price regarding depth of pullback.
Intraday Expectation:
Price to trade up to either premium of internal 50% EQ, or M15 supply zone before targeting weak internal low priced at 3,221.320
Note:
With the Federal Reserve maintaining a dovish stance and ongoing geopolitical tensions, volatility in Gold prices is expected to remain elevated. Traders should exercise caution, adjust risk management strategies, and stay prepared for potential price whipsaws in this high-volatility environment.
Trump's tariff announcement will most likely cause considerably increased volatility and whipsaws.
M15 Chart:

XAU/USD 30 April 2025 Intraday AnalysisH4 Analysis:
-> Swing: Bullish.
-> Internal: Bullish.
Analysis and bias remains the same as analysis dated 23 April 2025
Price has now printed a bearish CHoCH according to my analysis yesterday.
Price is now trading within an established internal range.
Intraday Expectation:
Price to trade down to either discount of internal 50% EQ, or H4 demand zone before targeting weak internal high priced at 3,500.200.
Note:
With the Federal Reserve's dovish stance and persisting geopolitical uncertainties, heightened volatility in Gold is expected to continue. Traders should proceed with caution and adjust risk management strategies in this high-volatility environment.
Price could also be driven by President Trump's policies, geopolitical moves and economic decisions which are sparking uncertainty.
H4 Chart:
M15 Analysis:
-> Swing: Bullish.
-> Internal: Bearish.
Analysis and Bias remains the same as analysis dated 24 April 2025.
Price printed as per my note yesterday whereby I mentioned that we should be surprised if price printed a bearish iBOS as all HTF's require a pullback.
Price subsequently printed a bearish iBOS which confirms internal structure.
Intraday Expectation:
Price has traded up to just short of premium of internal 50% EQ where we are seeing a reaction. Price could potentially trade further into premium of 50%, or H4/M15 nested supply zone before targeting weak internal low priced at 3,260.190.
Note:
With the Federal Reserve maintaining a dovish stance and ongoing geopolitical tensions, volatility in Gold prices is expected to remain elevated. Traders should exercise caution, adjust risk management strategies, and stay prepared for potential price whipsaws in this high-volatility environment.
Trump's tariff announcement will most likely cause considerably increased volatility and whipsaws.
M15 Chart:

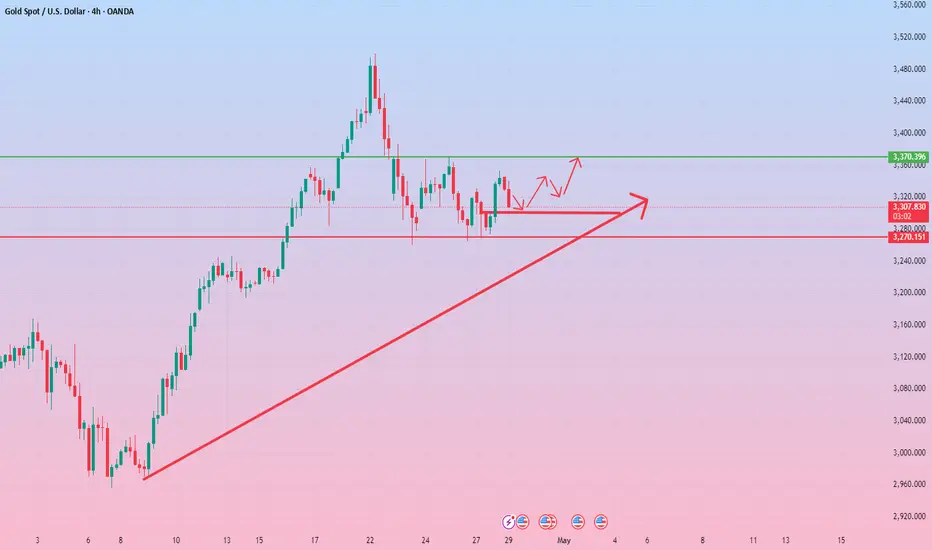
Doubletop suppressionVS multi-bottom support Entry at key pointsGold rose sharply in the U.S. market yesterday, and the daily line finally closed the Yang cross star, approaching the end of the monthly line. Recently, it has been a yin-yang cycle sweep pattern. Therefore, today we need to be careful to prevent the market from falling back and then closing in the negative range. The wide sweeping range remains at 3370-3270. If the position is broken, look at the unilateral direction. In the 4H cycle, the continuous positive pattern breaks through the mid-track, and the short-term trend is stronger. , but Bollinger has not opened his mouth, and is not optimistic about the breakthrough range. The short-term support is around 3315, which is also yesterday's low point. If it falls below, it will go to 3302. Therefore, today's operation will continue to grasp the key positions. The upper pressure will focus on 3354 and 3370, and the lower support will focus on 3315 and 3300. Go high and low in the range! Do high-altitude and low-multiple in the range!
Operation suggestion: Buy gold near 3305-3300, look at 3320 and 3345!
XAU/USD 28 April - 02 May 2025 Weekly AnalysisWeekly Analysis:
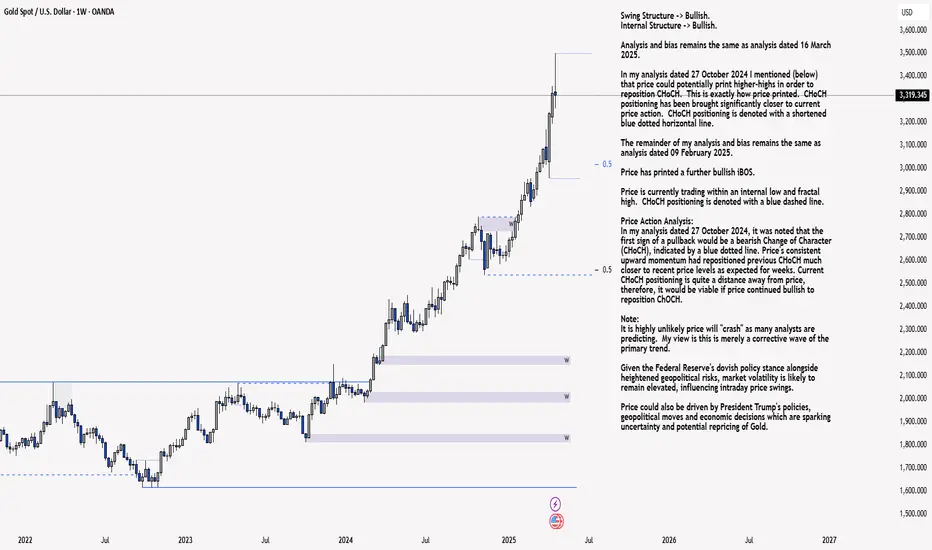
Swing Structure -> Bullish.
Internal Structure -> Bullish.
Analysis and bias remains the same as analysis dated 16 March 2025.
In my analysis dated 27 October 2024 I mentioned (below) that price could potentially print higher-highs in order to reposition CHoCH. This is exactly how price printed. CHoCH positioning has been brought significantly closer to current price action. CHoCH positioning is denoted with a shortened blue dotted horizontal line.
The remainder of my analysis and bias remains the same as analysis dated 09 February 2025.
Price has printed a further bullish iBOS.
Price is currently trading within an internal low and fractal high. CHoCH positioning is denoted with a blue dashed line.
Price Action Analysis:
In my analysis dated 27 October 2024, it was noted that the first sign of a pullback would be a bearish Change of Character (CHoCH), indicated by a blue dotted line. Price's consistent upward momentum had repositioned previous CHoCH much closer to recent price levels as expected for weeks. Current CHoCH positioning is quite a distance away from price, therefore, it would be viable if price continued bullish to reposition ChOCH.
Note:
It is highly unlikely price will "crash" as many analysts are predicting. My view is this is merely a corrective wave of the primary trend.
Given the Federal Reserve's dovish policy stance alongside heightened geopolitical risks, market volatility is likely to remain elevated, influencing intraday price swings.
Price could also be driven by President Trump's policies, geopolitical moves and economic decisions which are sparking uncertainty and potential repricing of Gold.
Weekly Chart:
Daily Analysis:
Swing -> Bullish.
Internal -> Bullish.
Since my last weekly analysis price has printed a
further bullish iBOS.
Price is now trading within an internal low and fractal high.
CHoCH positioning is denoted with a shortened blue horizontal dotted line.
First indication, but not confirmation of bearish pullback phase initiation is for price to print bearish CHoCH.
Note:
With the Fed maintaining a dovish policy stance and the continued rise in geopolitical tensions, we should anticipate elevated market volatility, which may impact both intraday and longer-term price action.
Price could also be driven by President Trump's policies, geopolitical moves and economic decisions which are sparking uncertainty and the repricing of Gold.
Daily Chart:
H4 Analysis:
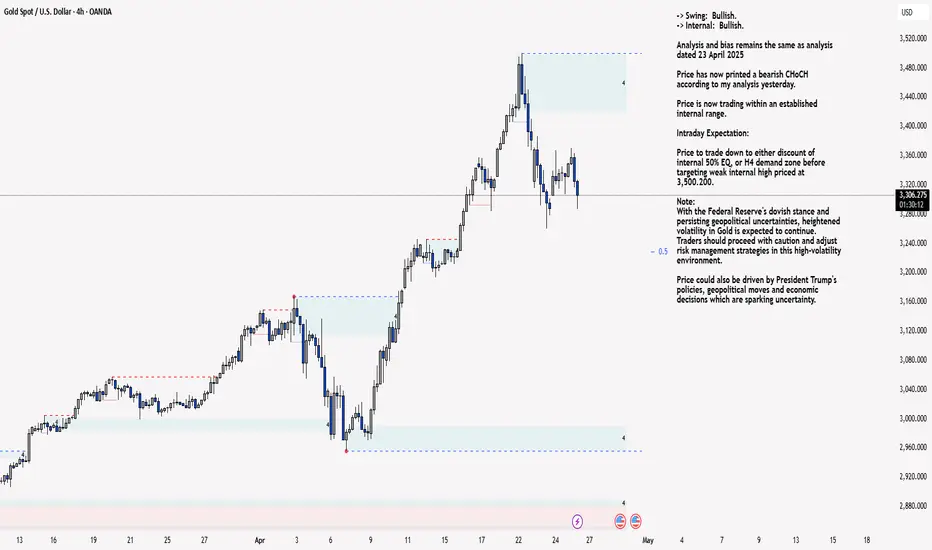
-> Swing: Bullish.
-> Internal: Bullish.
Analysis and bias remains the same as analysis dated 23 April 2025
Price has now printed a bearish CHoCH according to my analysis yesterday.
Price is now trading within an established internal range.
Intraday Expectation:
Price to trade down to either discount of internal 50% EQ, or H4 demand zone before targeting weak internal high priced at 3,500.200.
Note:
With the Federal Reserve's dovish stance and persisting geopolitical uncertainties, heightened volatility in Gold is expected to continue. Traders should proceed with caution and adjust risk management strategies in this high-volatility environment.
Price could also be driven by President Trump's policies, geopolitical moves and economic decisions which are sparking uncertainty.
H4 Chart:
XAU/USD 25 April 2025 Intraday AnalysisH4 Analysis:
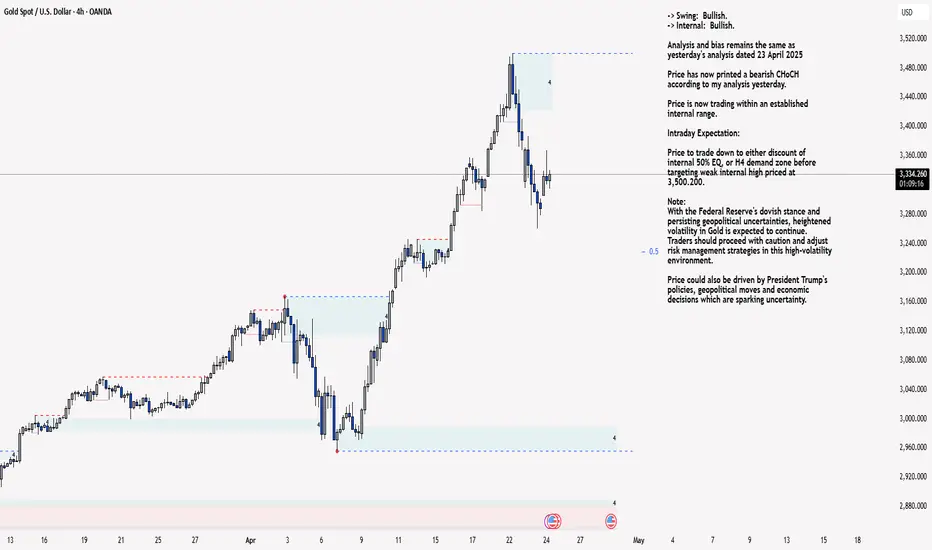
-> Swing: Bullish.
-> Internal: Bullish.
Analysis and bias remains the same as yesterday's analysis dated 23 April 2025
Price has now printed a bearish CHoCH according to my analysis yesterday.
Price is now trading within an established internal range.
Intraday Expectation:
Price to trade down to either discount of internal 50% EQ, or H4 demand zone before targeting weak internal high priced at 3,500.200.
Note:
With the Federal Reserve's dovish stance and persisting geopolitical uncertainties, heightened volatility in Gold is expected to continue. Traders should proceed with caution and adjust risk management strategies in this high-volatility environment.
Price could also be driven by President Trump's policies, geopolitical moves and economic decisions which are sparking uncertainty.
H4 Chart:
M15 Analysis:
-> Swing: Bullish.
-> Internal: Bearish.
Analysis and Bias remains the same as yesterday's analysis dated 24 April 2025.
Price printed as per my note yesterday whereby I mentioned that we should be surprised if price printed a bearish iBOS as all HTF's require a pullback.
Price subsequently printed a bearish iBOS which confirms internal structure.
Intraday Expectation:
Price has traded up to just short of premium of internal 50% EQ where we are seeing a reaction. Price could potentially trade further into premium of 50%, or H4/M15 nested supply zone before targeting weak internal low priced at 3,260.190.
Note:
With the Federal Reserve maintaining a dovish stance and ongoing geopolitical tensions, volatility in Gold prices is expected to remain elevated. Traders should exercise caution, adjust risk management strategies, and stay prepared for potential price whipsaws in this high-volatility environment.
Trump's tariff announcement will most likely cause considerably increased volatility and whipsaws.
M15 Chart:
XAU/USD 24 April 2025 Intraday AnalysisH4 Analysis:
-> Swing: Bullish.
-> Internal: Bullish.
Analysis and bias remains the same as yesterday's analysis dated 23 April 2025
Price has now printed a bearish CHoCH according to my analysis yesterday.
Price is now trading within an established internal range.
Intraday Expectation:
Price to trade down to either discount of internal 50% EQ, or H4 demand zone before targeting weak internal high priced at 3,500.200.
Note:
With the Federal Reserve's dovish stance and persisting geopolitical uncertainties, heightened volatility in Gold is expected to continue. Traders should proceed with caution and adjust risk management strategies in this high-volatility environment.
Price could also be driven by President Trump's policies, geopolitical moves and economic decisions which are sparking uncertainty.
H4 Chart:
M15 Analysis:
-> Swing: Bullish.
-> Internal: Bearish.
Price printed as per my note yesterday whereby I mentioned that we should be surprised if price printed a bearish iBOS as all HTF's require a pullback.
Price subsequently printed a bearish iBOS which confirms internal structure.
Intraday Expectation:
Price has traded up to just short of premium of internal 50% EQ where we are seeing a reaction. Price could potentially trade further into premium of 50%, or H4/M15 nested supply zone before targeting weak internal low priced at 3,260.190.
Note:
With the Federal Reserve maintaining a dovish stance and ongoing geopolitical tensions, volatility in Gold prices is expected to remain elevated. Traders should exercise caution, adjust risk management strategies, and stay prepared for potential price whipsaws in this high-volatility environment.
Trump's tariff announcement will most likely cause considerably increased volatility and whipsaws.
M15 Chart:
XAU/USD 23 April 2025 Intraday AnalysisH4 Analysis:
-> Swing: Bullish.
-> Internal: Bullish.
Price has now printed a bearish CHoCH according to my analysis yesterday.
Price is now trading within an established internal range.
Intraday Expectation:
Price to trade down to either discount of internal 50% EQ, or H4 demand zone before targeting weak internal high priced at 3,500.200.
Note:
With the Federal Reserve's dovish stance and persisting geopolitical uncertainties, heightened volatility in Gold is expected to continue. Traders should proceed with caution and adjust risk management strategies in this high-volatility environment.
Price could also be driven by President Trump's policies, geopolitical moves and economic decisions which are sparking uncertainty.
H4 Chart:
M15 Analysis:
-> Swing: Bullish.
-> Internal: Bullish.
Analysis and bias remains the same as yesterday's analysis dated 22 April 2025.
In addition we should be mindful that All HTF's require a pullback and H$ TF has indicated the start of bearish pullback phase as a bearish CHoCH has been printed, therefore, it should not come as a surprise if price printed a bearish iBOS.
You will note that currently price has mitigated an M15 demand zone and strong low is currently holding.
Price printed as per analysis dated 18 April 2025 by targeting weak internal high.
Price has continued to print higher-highs with minimal pullbacks.
Multiple CHoCH's have been printed, however, I will apply discretion and not classify them as CHoCH's in order not to distort internal structure due to very minimal pullbacks.
Since most recent all time high price has printed a bearish CHOCH and is now trading within an established internal structure which I will continue to monitor.
Intraday Expectation:
Price to trade down to either discount of 50% internal EQ, or M15 demand zone before targeting weak internal high priced at 3,500.200
Note:
With the Federal Reserve maintaining a dovish stance and ongoing geopolitical tensions, volatility in Gold prices is expected to remain elevated. Traders should exercise caution, adjust risk management strategies, and stay prepared for potential price whipsaws in this high-volatility environment.
Trump's tariff announcement will most likely cause considerably increased volatility and whipsaws.
M15 Chart:
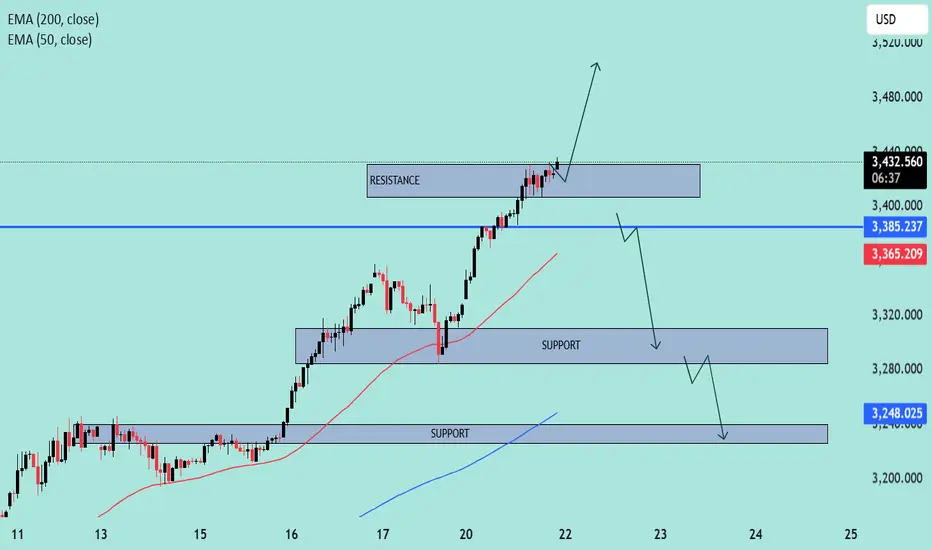
GOLD (XAU/USD) Breakout Watch –Bullish Continuation or Pullback?🔍 Instrument Analysis: XAU/USD (Gold vs USD)
Timeframe: Likely 1H or 4H (based on candle structure)
Indicators:
EMA 50 (Red) – Current value: 3,365.25
EMA 200 (Blue) – Current value: 3,248.04
📈 Current Market Structure
Price: Trading at 3,433.62, in a strong uptrend with higher highs and higher lows.
Trend: Bullish, supported by price trading above both the 50 EMA and 200 EMA.
Key Zones:
Immediate Resistance: ~3,430 - 3,440 zone (currently being tested).
First Support Zone: ~3,315 - 3,330
Second Support Zone: ~3,250 - 3,270
🧠 Scenario Analysis
✅ Bullish Scenario (Primary Bias)
Price is attempting a break and retest of the resistance zone.
If a successful retest confirms it as support, next upside leg could target 3,480+.
Bullish continuation is favored as long as price holds above 3,385 (recent breakout level).
⚠️ Bearish Scenario (Secondary Bias)
If price fails to hold above 3,385, we may see a pullback to:
3,315 - 3,330 support area (reaction likely due to proximity to EMA 50).
A deeper retracement toward the 3,250 zone, aligned with EMA 200, which would be a critical level for bullish continuation or breakdown.
📊 EMA Insight
EMA 50 > EMA 200: Confirms bullish momentum.
The slope of both EMAs is upward, reinforcing current upward trend.
A test of the EMA 50 may offer a buy opportunity if structure holds.
🔔 Trade Outlook
Bullish bias remains intact above 3,385.
Look for bullish price action confirmation (bullish engulfing, pin bars, etc.) on retest of resistance-turned-support.
Monitor volume/activity around 3,385-3,400 for potential rejection or continuation clues.
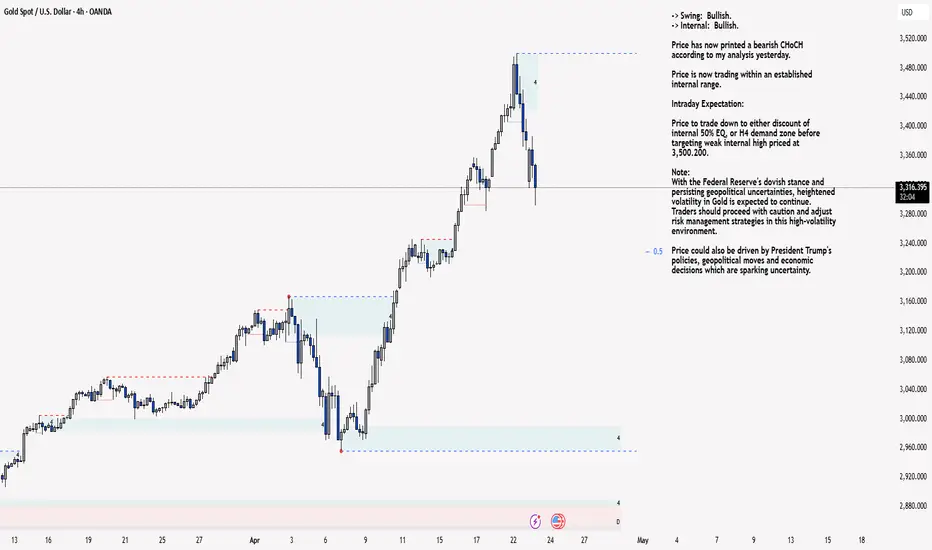
XAU/USD 22 April 2025 Intraday AnalysisH4 Analysis:
-> Swing: Bullish.
-> Internal: Bullish.
As mentioned in my analysis dated 16 April 2025 I that will wait for price to print a bearish CHoCH but will also continue to monitor price.
Price printed a bearish CHoCH, however, the pullback was very minimal with price continuing to print higher-highs. As a result I will again apply discretion and mark the CHoCH in red in order not to distort internal structure.
Intraday Expectation:
Await for price to print bearish CHoCH to indicate bearish pullback initiation phase. Bearish CHoCH positioning is denoted with a blue dotted line.
Note:
With the Federal Reserve's dovish stance and persisting geopolitical uncertainties, heightened volatility in Gold is expected to continue. Traders should proceed with caution and adjust risk management strategies in this high-volatility environment.
Price could also be driven by President Trump's policies, geopolitical moves and economic decisions which are sparking uncertainty.
H4 Chart:
M15 Analysis:
-> Swing: Bullish.
-> Internal: Bullish.
Price printed as per analysis dated 18 April 2025 by targeting weak internal high.
Price has continued to print higher-highs with minimal pullbacks.
Multiple CHoCH's have been printed, however, I will apply discretion and not classify them as CHoCH's in order not to distort internal structure due to very minimal pullbacks.
Since most recent all time high price has printed a bearish CHOCH and is now trading within an established internal structure which I will continue to monitor.
Intraday Expectation:
Price to trade down to either discount of 50% internal EQ, or M15 demand zone before targeting weak internal high priced at 3,500.200
Note:
With the Federal Reserve maintaining a dovish stance and ongoing geopolitical tensions, volatility in Gold prices is expected to remain elevated. Traders should exercise caution, adjust risk management strategies, and stay prepared for potential price whipsaws in this high-volatility environment.
Trump's tariff announcement will most likely cause considerably increased volatility and whipsaws.
M15 Chart:
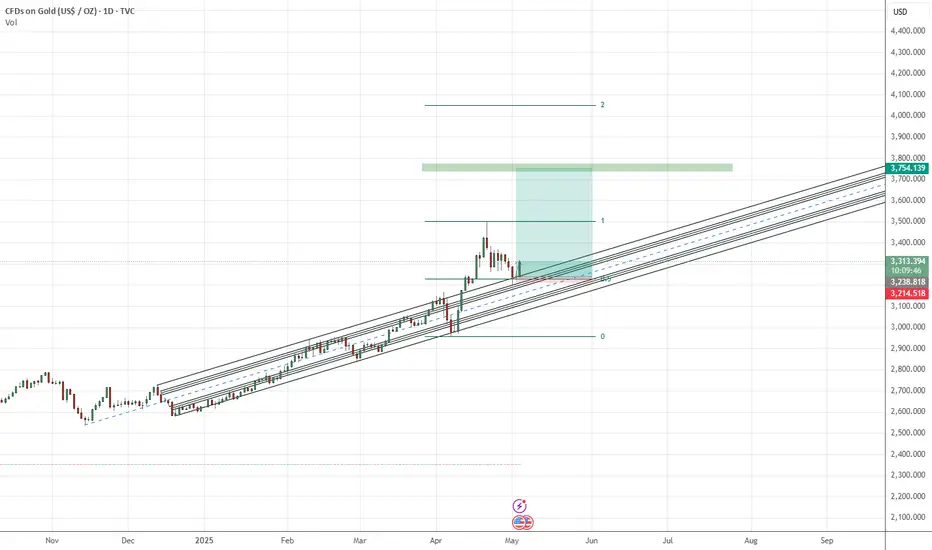
Gold - Bitcoin Close to a Vital Ray. Volatility Alert.Gold, in terms of Bitcoin, is getting close to an important ray that crosses through the two significant tops.
Should we expect a strong reaction?
If we take a look at the third rejection from the bottom, we can see that it was able to get below the bottom ray but quickly reversed upward. So, we should definitely expect a strong reaction to the upper ray. Especially, as the BTCUSD price was reject at the linear ray that connected the last two bull peaks, this should be treated as seriously.
The 1 day EMA400 is above the MA400, which means that price is likely to rise to hit it, although it has entered the KC (Keltner Channels/EMA Bands), so I wouldn't count on the EMA400 being hit.
Saying that, it will act as resistance at about the same place as the upper ray.
What should we expect?
If gold breaks the upper ray, then we could be in for a very significant rise in price (BTC).
If gold is rejected, then we should expect a decision on direction by the start of August at the latest. If it takes that long, then we should expect to see gold drop to about 0.0248BTC.
We can look for clues in the RSI, depending on which way it breaks out. On the weekly chart, the RSI peaked at 65, not yet in overbought territory.
What to do?
As gold, and charts in general, do not offer a BTC pairing yet (with the exception of tethered gold on a crypto exchange), you'll have to use this chart as a guide and watch both Gold and BTC priced in something like USD or, the oldest currency still in use, GBP.
Gold has been up for a significant amount of time , is overbought and recently hit a Fibonacci Retracement level when priced in USD. If gold cools off and Bitcoin rises then the lower ray won't take long to encounter.
Gold in BTC could pump very up very high and reverse. This would seem likely caused by BTC crashing in that scenario, however, Bitcoin might be entering a bear market. I suspect it will either be very short or very long, based on the 6M and 12M RSI.
Main takeaways:
The gold and bitcoin markets are about to get very volatile, so take caution/avoid high or any leverage.
Use the GOLDUSD chart and change the currency to BTC for clues on direction in the coming days or weeks.
This could lead to a long term direction, but unfortunately, you cannot add alerts to a chart with an altered pairing, so perhaps use the PAXGBTC chart and add alerts there.
[*}BTCUSD hit the 1 day MA/EMA400 at the bottom and is getting close on this chart. I suggest adding BB400 (at various SDs) and KC400 to your charts, even if you use BB20.
You might want to use HLC Area instead of candles/bars as price appears to jump around willy-nilly else.
When you find a chart difficult to read, try swapping to BTC for more clues. If the chart is Tesla, then you might even want to try Dogecoin!
In addition to these charts, the BTC Dominance chart shows that BTC has hit the same pitchfork line that it hit when the first alt season began! So, I expect a strong move there too.
So, if BTC does rise then we might get an alt season very soon.
This is my first Idea that I've published, so please forgive any mistakes, omissions or poor formatting. I am open to critical feedback.
I just wanted to put this out there as I haven't seen anyone cover this online. If you have or know of related ideas, then please
share, as I am always interested in finding ways to predict major market moves.

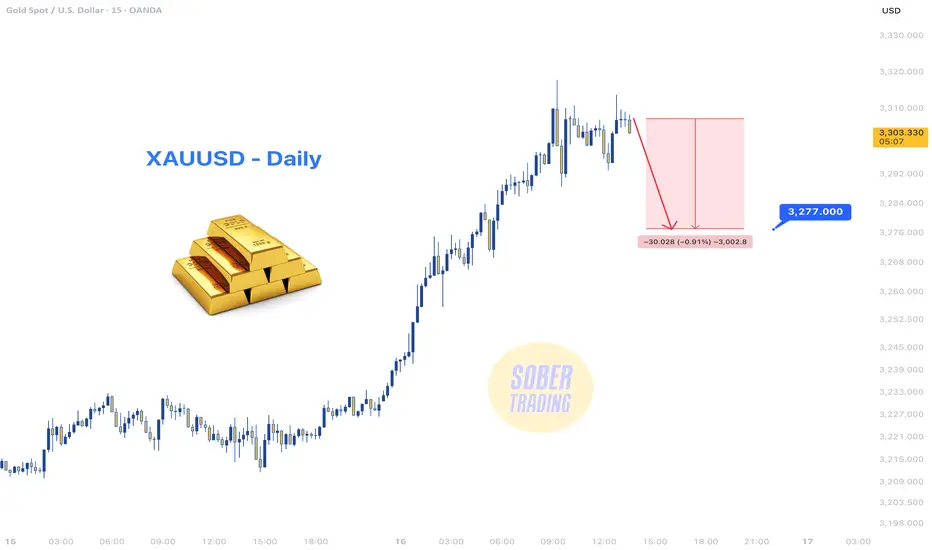
XAUUSD - 15m Sell SetupXAUUSD - Daily Sell Setup 🔻
After a strong and extended rally, Gold (XAUUSD) has reached an overheated level and is now showing signs of short-term exhaustion.
We’re eyeing a $30 correction, which translates to nearly 300 pips of opportunity for short sellers.
📉 Current Price: ~$3,307
🎯 Target: ~$3,277
With momentum slowing and candles printing hesitation, this could be a great time to catch a quick pullback. Ideal for short-term traders who thrive in volatility.
💡 Manage your risk, don’t chase — wait for confirmation before entry.
💸 Ready for 300 pips? Follow us and ride the wave with precision! 🚀
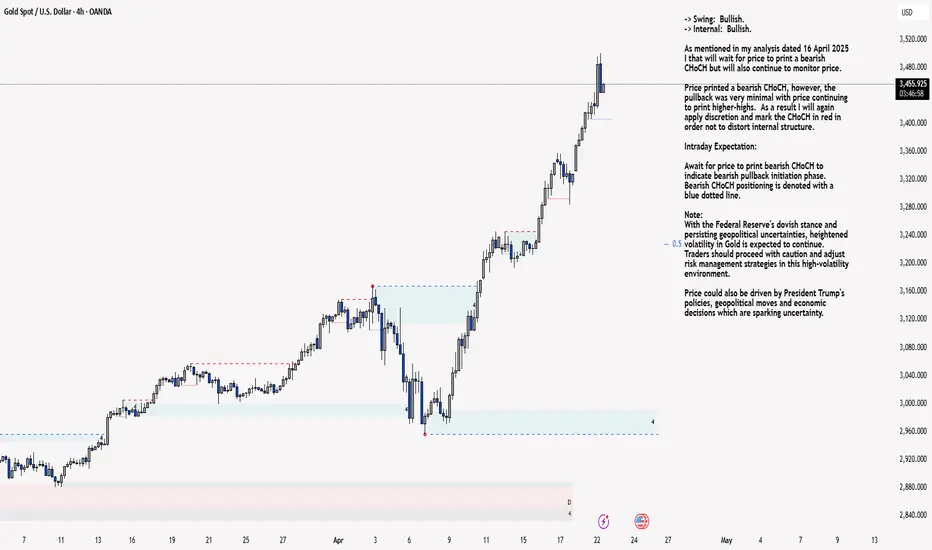
XAU/USD 16 April 2025 Intraday AnalysisH4 Analysis:
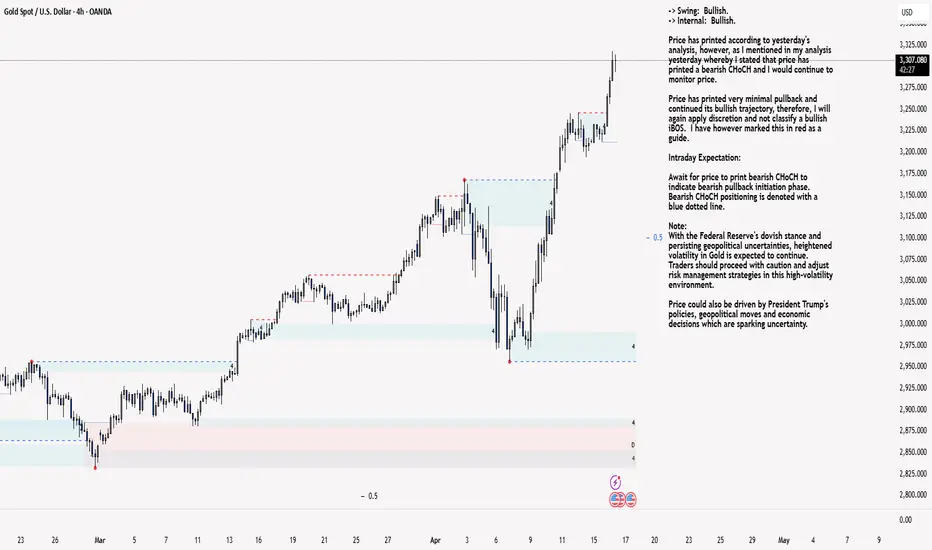
-> Swing: Bullish.
-> Internal: Bullish.
Price has printed according to yesterday's analysis, however, as I mentioned in my analysis yesterday whereby I stated that price has printed a bearish CHoCH and I would continue to monitor price.
Price has printed very minimal pullback and continued its bullish trajectory, therefore, I will again apply discretion and not classify a bullish iBOS. I have however marked this in red as a guide.
Intraday Expectation:
Await for price to print bearish CHoCH to indicate bearish pullback initiation phase. Bearish CHoCH positioning is denoted with a blue dotted line.
Note:
With the Federal Reserve's dovish stance and persisting geopolitical uncertainties, heightened volatility in Gold is expected to continue. Traders should proceed with caution and adjust risk management strategies in this high-volatility environment.
Price could also be driven by President Trump's policies, geopolitical moves and economic decisions which are sparking uncertainty.
H4 Chart:
M15 Analysis:
-> Swing: Bullish.
-> Internal: Bullish.
Price did not print according to yesterday's analysis, failing to target weak internal low by printing a bullish iBOS. This is most probably due to Trump's tariff policy and ongoing uncertainty.
Price has now printed a bearish CHoCH to indicate bearish pullback phase initiation.
Price is now trading within an established internal range. However, I will continue to monitor price.
Intraday Expectation:
Price to trade down to either discount of 50% internal EQ, or M15 demand zone before targeting weak internal high priced at 3,317.920
Note:
With the Federal Reserve maintaining a dovish stance and ongoing geopolitical tensions, volatility in Gold prices is expected to remain elevated. Traders should exercise caution, adjust risk management strategies, and stay prepared for potential price whipsaws in this high-volatility environment.
Trump's tariff announcement will most likely cause considerably increased volatility and whipsaws.
M15 Chart:
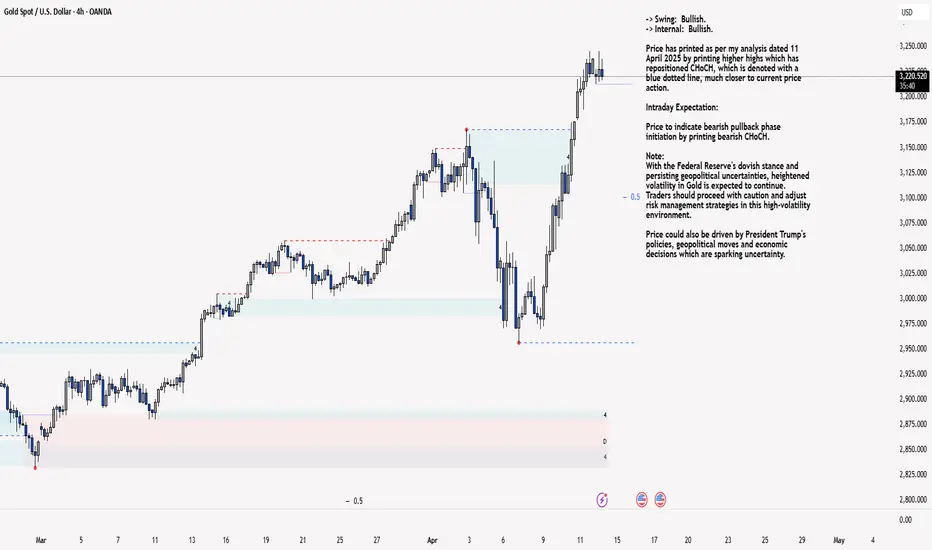
XAU/USD 14 April 2025 Intraday AnalysisH4 Analysis:
-> Swing: Bullish.
-> Internal: Bullish.
Price has printed as per my analysis dated 11 April 2025 by printing higher highs which has repositioned CHoCH, which is denoted with a blue dotted line, much closer to current price action.
Intraday Expectation:
Price to indicate bearish pullback phase initiation by printing bearish CHoCH.
Note:
With the Federal Reserve's dovish stance and persisting geopolitical uncertainties, heightened volatility in Gold is expected to continue. Traders should proceed with caution and adjust risk management strategies in this high-volatility environment.
Price could also be driven by President Trump's policies, geopolitical moves and economic decisions which are sparking uncertainty.
H4 Chart:
M15 Analysis:
-> Swing: Bullish.
-> Internal: Bullish.
As mentioned in previous analysis that I will continue to monitor internal structure following the printing of a bearish CHoCH.
Due to the extreme bullishness of the market I will be mapping internal structure as it appears.
The reasoning behind this due to the fact of the increasing range of the internal structure. By mapping internal structure as it appears we are more likely to be in a good position to have an early warning of all HTF bearish pullback phase initiations.
Price has printed a double bullish iBOS since last analysis and we are now trading within an establish internal range where you will note that price has printed a double top and has been unable to close above weak internal high.
Intraday Expectation:
Technically price should target weak internal high priced at 3,244.340.
Alternative scenario:
Due to the narrowing of internal range, it could be a potential early signal that all HTF's are beginning their bearish pullback phase initiation. I would therefore not be surprised if price printed a bearish iBOS.
Note:
With the Federal Reserve maintaining a dovish stance and ongoing geopolitical tensions, volatility in Gold prices is expected to remain elevated. Traders should exercise caution, adjust risk management strategies, and stay prepared for potential price whipsaws in this high-volatility environment.
Trump's tariff announcement will most likely cause considerably increased volatility and whipsaws.
M15 Chart:
XAU/USD 11 April 2025 Intraday AnalysisH4 Analysis:
-> Swing: Bullish.
-> Internal: Bullish.
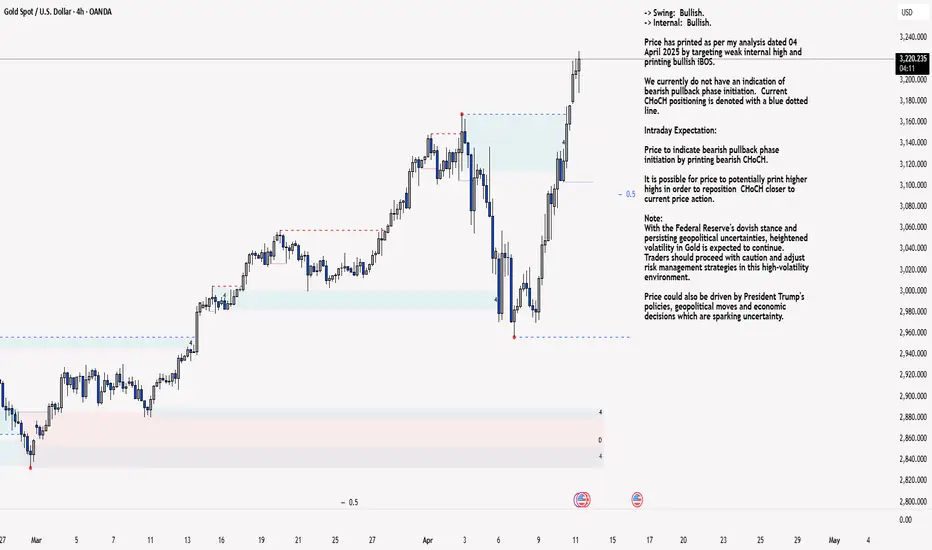
Price has printed as per my analysis dated 04 April 2025 by targeting weak internal high and printing bullish iBOS.
We currently do not have an indication of bearish pullback phase initiation. Current CHoCH positioning is denoted with a blue dotted line.
Intraday Expectation:
Price to indicate bearish pullback phase initiation by printing bearish CHoCH.
It is possible for price to potentially print higher highs in order to reposition CHoCH closer to current price action.
Note:
With the Federal Reserve's dovish stance and persisting geopolitical uncertainties, heightened volatility in Gold is expected to continue. Traders should proceed with caution and adjust risk management strategies in this high-volatility environment.
Price could also be driven by President Trump's policies, geopolitical moves and economic decisions which are sparking uncertainty.
H4 Chart:
M15 Analysis:
-> Swing: Bullish.
-> Internal: Bullish.
As mentioned in yesterday's analysis that I will continue to monitor internal structure following the printing of a bearish CHoCH.
Price has continued higher without a meaningful pullback, therefore, I will not classify previous iBOS, which is marked in red, as a bullish iBOS.
Intraday Expectation:
Price to indicate bearish pullback phase initiation by printing bearish CHoCH. Current CHoCH positioning is denoted with a blue dotted line.
Note:
With the Federal Reserve maintaining a dovish stance and ongoing geopolitical tensions, volatility in Gold prices is expected to remain elevated. Traders should exercise caution, adjust risk management strategies, and stay prepared for potential price whipsaws in this high-volatility environment.
Trump's tariff announcement will most likely cause considerably increased volatility and whipsaws.
M15 Chart: