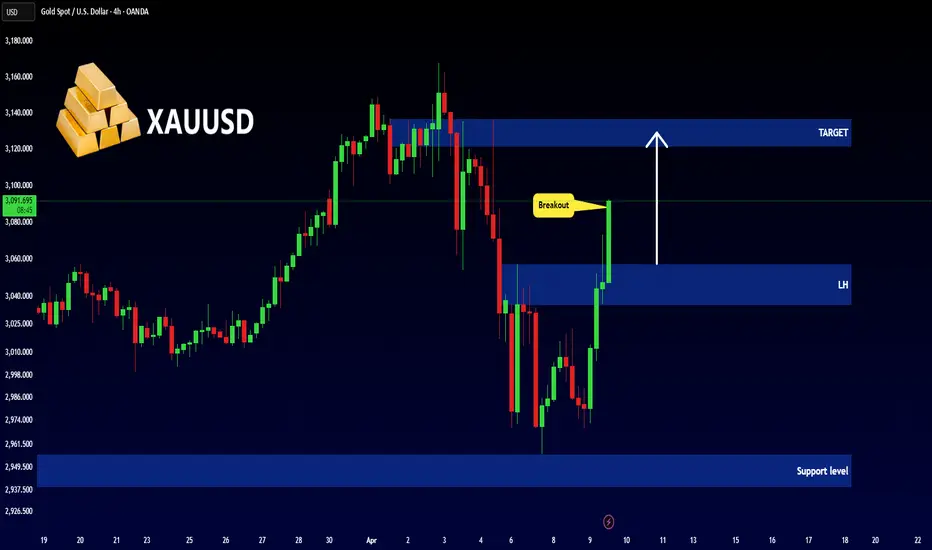
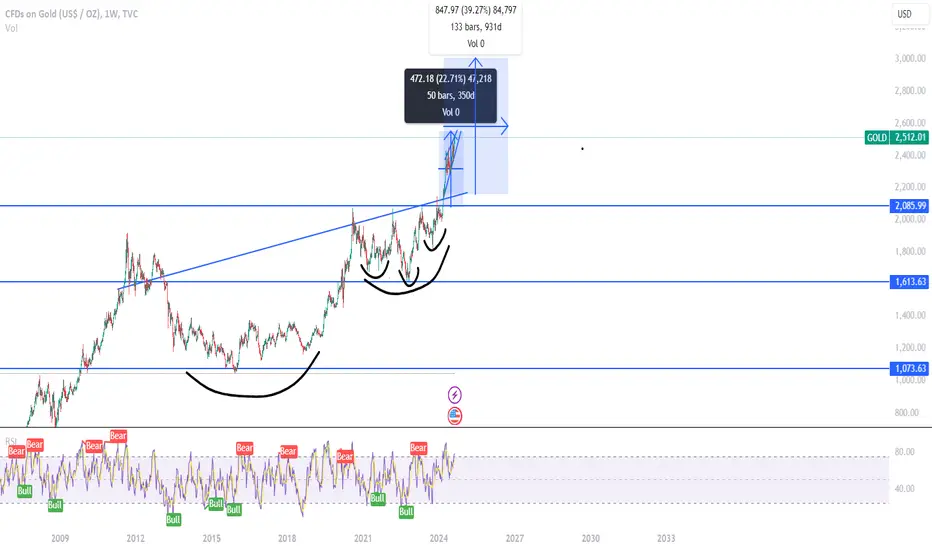
GOLD - NEW BREAKOUT !Hello Traders !
The Gold price failed to create a new lower low !
Currently, The lower high is broken (change of character).
So, I expect a bullish move🚀
______________
TARGET: 3122🎯
Goldusd
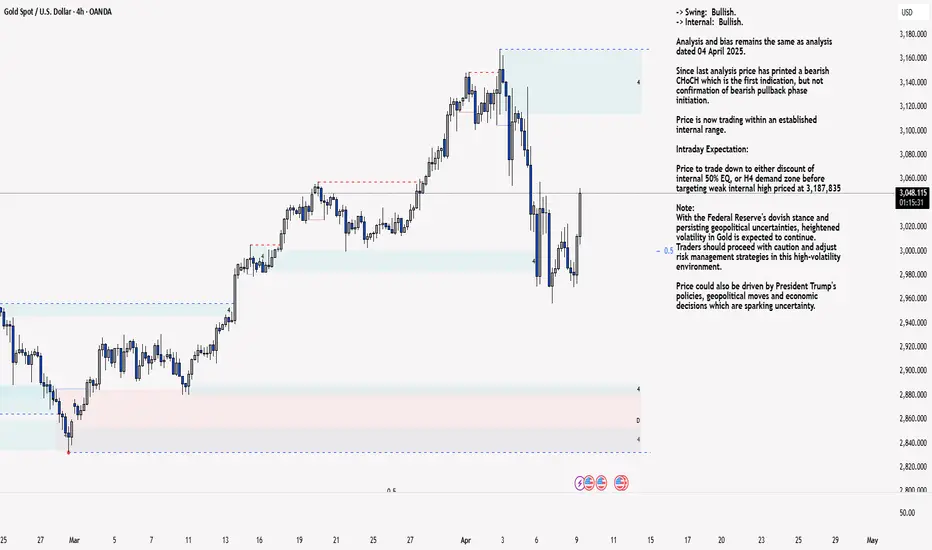
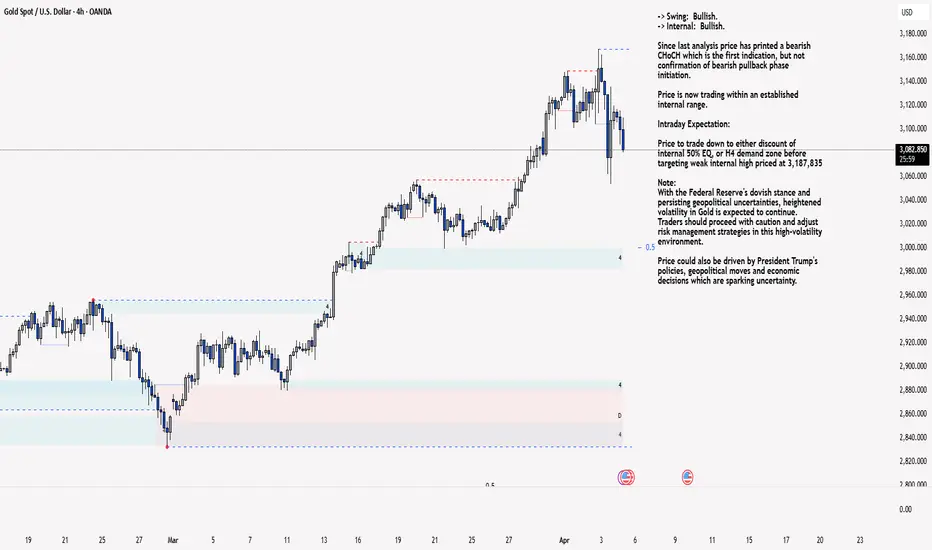
XAU/USD 09 April 2025 Intraday AnalysisH4 Analysis:
-> Swing: Bullish.
-> Internal: Bullish.
Analysis and bias remains the same as analysis dated 04 April 2025.
Since last analysis price has printed a bearish CHoCH which is the first indication, but not confirmation of bearish pullback phase initiation.
Price is now trading within an established internal range.
Intraday Expectation:
Price to trade down to either discount of internal 50% EQ, or H4 demand zone before targeting weak internal high priced at 3,187,835
Note:
With the Federal Reserve's dovish stance and persisting geopolitical uncertainties, heightened volatility in Gold is expected to continue. Traders should proceed with caution and adjust risk management strategies in this high-volatility environment.
Price could also be driven by President Trump's policies, geopolitical moves and economic decisions which are sparking uncertainty.
H4 Chart:
M15 Analysis:
-> Swing: Bullish.
-> Internal: Bearish.
Analysis and bias remains the same as yesterday's analysis dated 08 April 2025.
However, it would be worthwhile to note that price could potentially print a bullish iBOS as H4 TF has printed a bullish reaction from discount of 50% EQ.
Price has printed as per yesterday's analysis by targeting weak internal low and printing a bearish iBOS.
Price has subsequently printed a bullish CHoCH (I mentioned in yesterday's analysis bullish iBOS in error) indicating bullish phase initiation.
Price is now trading within an established internal range and appears to be stuck in between close supply and demand zones where we could see extended rangebound conditions.
Intraday Expectation:
Price to continue bullish, react at either premium of internal 50% EQ, or M15 supply zone before targeting weak internal low priced at 2,956.565
Note:
With the Federal Reserve maintaining a dovish stance and ongoing geopolitical tensions, volatility in Gold prices is expected to remain elevated. Traders should exercise caution, adjust risk management strategies, and stay prepared for potential price whipsaws in this high-volatility environment.
Trump's tariff announcement will most likely cause considerably increased volatility and whipsaws.
M15 Chart:
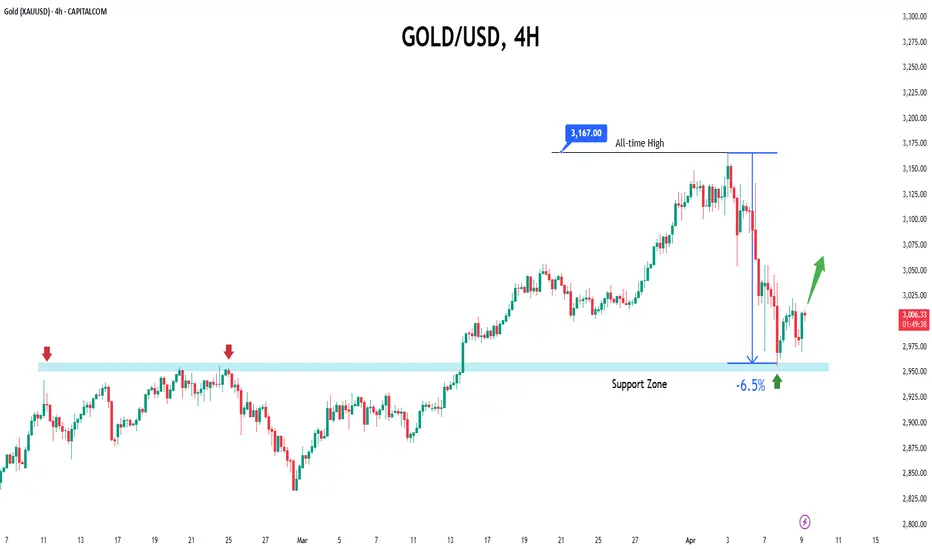
Gold on the Go: Prices Set to Surge Amid Uncertainty● Gold prices have recovered from a 6.5% fall and are now trading above $3000 per ounce.
● Tariff developments and US President Trump's comments are influencing market sentiment and gold prices.
● A record $21 billion inflow into Gold ETFs was recorded in Q1 2025, indicating strong interest in gold as a safe-haven asset.
● Technical analysis suggests a key support level for gold prices between $2950 and $2960, which could impact market trends.
XAU/USD 07 April 2025 Intraday AnalysisH4 Analysis:
-> Swing: Bullish.
-> Internal: Bullish.
Analysis and bias remains the same as analysis dated 04 April 2025.
Since last analysis price has printed a bearish CHoCH which is the first indication, but not confirmation of bearish pullback phase initiation.
Price is now trading within an established internal range.
Intraday Expectation:
Price to trade down to either discount of internal 50% EQ, or H4 demand zone before targeting weak internal high priced at 3,187,835
Note:
With the Federal Reserve's dovish stance and persisting geopolitical uncertainties, heightened volatility in Gold is expected to continue. Traders should proceed with caution and adjust risk management strategies in this high-volatility environment.
Price could also be driven by President Trump's policies, geopolitical moves and economic decisions which are sparking uncertainty.
H4 Chart:
M15 Analysis:
-> Swing: Bullish.
-> Internal: Bearish.
Price has printed as per last Friday's analysis by targeting weak internal low and printing a bearish iBOS.
Price has subsequently printed a bullish iBOS indicating bullish phase initiation.
Price is now trading within an established internal range.
Intraday Expectation:
Price to continue bullish, react at either premium of internal 50% EQ, or M15/H4 nested supply zone before targeting weak internal low priced at 2,970.215
Note:
With the Federal Reserve maintaining a dovish stance and ongoing geopolitical tensions, volatility in Gold prices is expected to remain elevated. Traders should exercise caution, adjust risk management strategies, and stay prepared for potential price whipsaws in this high-volatility environment.
Trump's tariff announcement will most likely cause considerably increased volatility and whipsaws.
M15 Chart:

Gold is GOLD yet not be OLD!!Buy GOLD in all dips
Can be Multibagger!!
Target1 - 2600 USD
Target2 - 2899 USD
Target3 - 3050 USD
Long Term can be anything, if its closed above 3000 USD..
Disclaimer :-
I am not SEBI registered. The information provided here is for education purposes only.
I will not be responsible for any of your profit/loss with this channel suggestions.
Consult your financial advisor before taking any decisions
XAU/USD 04 April 2025 Intraday AnalysisH4 Analysis:
-> Swing: Bullish.
-> Internal: Bullish.
Since last analysis price has printed a bearish CHoCH which is the first indication, but not confirmation of bearish pullback phase initiation.
Price is now trading within an established internal range.
Intraday Expectation:
Price to trade down to either discount of internal 50% EQ, or H4 demand zone before targeting weak internal high priced at 3,187,835
Note:
With the Federal Reserve's dovish stance and persisting geopolitical uncertainties, heightened volatility in Gold is expected to continue. Traders should proceed with caution and adjust risk management strategies in this high-volatility environment.
Price could also be driven by President Trump's policies, geopolitical moves and economic decisions which are sparking uncertainty.
H4 Chart:
M15 Analysis:
-> Swing: Bullish.
-> Internal: Bearish.
Price has printed as per yesterday's alternative scenario whereby price has printed a bearish iBOS due to H4 TF being in, although not as yet confirmed, in bearish pullback phase.
Intraday Expectation:
Price has already traded up to premium of internal 50% EQ, therefore, price to target weak internal low priced at
Note:
With the Federal Reserve maintaining a dovish stance and ongoing geopolitical tensions, volatility in Gold prices is expected to remain elevated. Traders should exercise caution, adjust risk management strategies, and stay prepared for potential price whipsaws in this high-volatility environment.
Trump's tariff announcement will most likely cause considerably increased volatility and whipsaws.
M15 Chart:
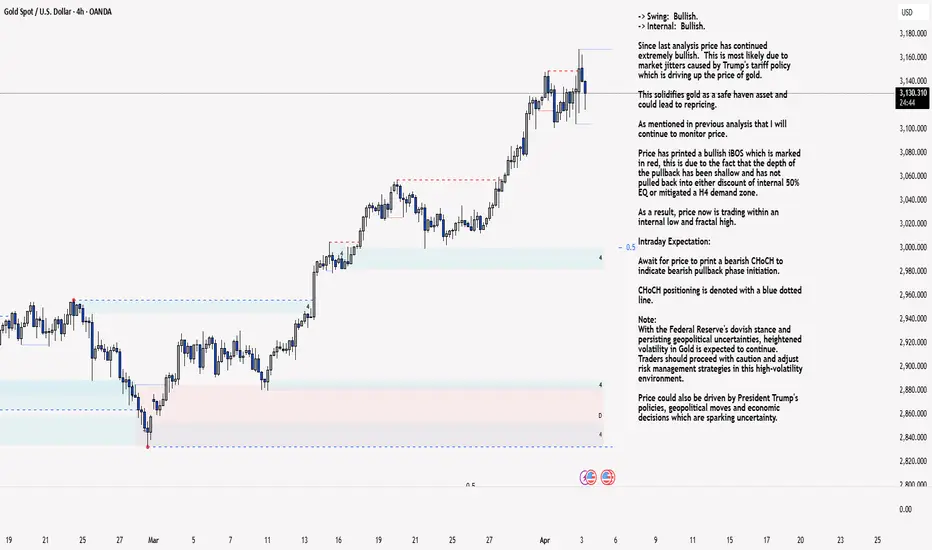
XAU/USD 03 April 2025 Intraday AnalysisH4 Analysis:
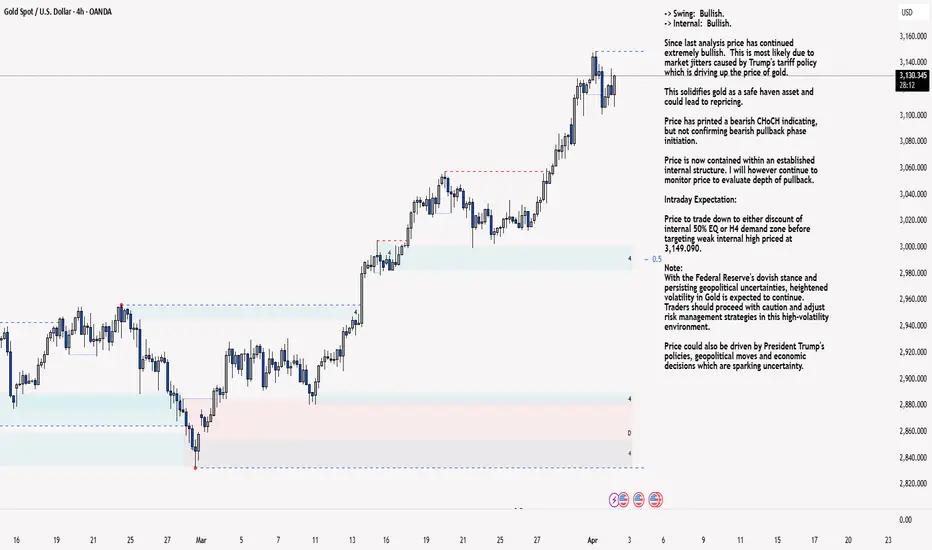
-> Swing: Bullish.
-> Internal: Bullish.
Since last analysis price has continued extremely bullish. This is most likely due to market jitters caused by Trump's tariff policy which is driving up the price of gold.
This solidifies gold as a safe haven asset and could lead to repricing.
As mentioned in previous analysis that I will continue to monitor price.
Price has printed a bullish iBOS which is marked in red, this is due to the fact that the depth of the pullback has been shallow and has not pulled back into either discount of internal 50% EQ or mitigated a H4 demand zone.
As a result, price now is trading within an internal low and fractal high.
Intraday Expectation:
Await for price to print a bearish CHoCH to indicate bearish pullback phase initiation.
CHoCH positioning is denoted with a blue dotted line.
Note:
With the Federal Reserve's dovish stance and persisting geopolitical uncertainties, heightened volatility in Gold is expected to continue. Traders should proceed with caution and adjust risk management strategies in this high-volatility environment.
Price could also be driven by President Trump's policies, geopolitical moves and economic decisions which are sparking uncertainty.
H4 Chart:
M15 Analysis:
-> Swing: Bullish.
-> Internal: Bullish.
Analysis and bias remains the same as yesterday's analysis dated 01 April 2025
Since last analysis price has continued extremely bullish. This is most likely due to market jitters caused by the trump tariffs.
This solidifies gold as a safe haven asset and could lead to repricing.
You will note price has printed a bullish followed by a bearish CHoCH to indicate, but not confirm, bearish pullback phase initiation.
Whilst I am aware that price has not traded into discount of internal 50% or mitigated any demand zone, I will mark this as an iBOS due to time spent.
Intraday Expectation:
Price to trade down to either discount of 50% internal EQ or M15 demand zone before targeting weak internal high, priced at 3,167.835.
Alternative scenario:
As H4 appears to be in bearish pullback phase, although we do not currently have any indication, it would not come a surprise if price prints a bearish iBOS.
Note:
With the Federal Reserve maintaining a dovish stance and ongoing geopolitical tensions, volatility in Gold prices is expected to remain elevated. Traders should exercise caution, adjust risk management strategies, and stay prepared for potential price whipsaws in this high-volatility environment.
M15 Chart:
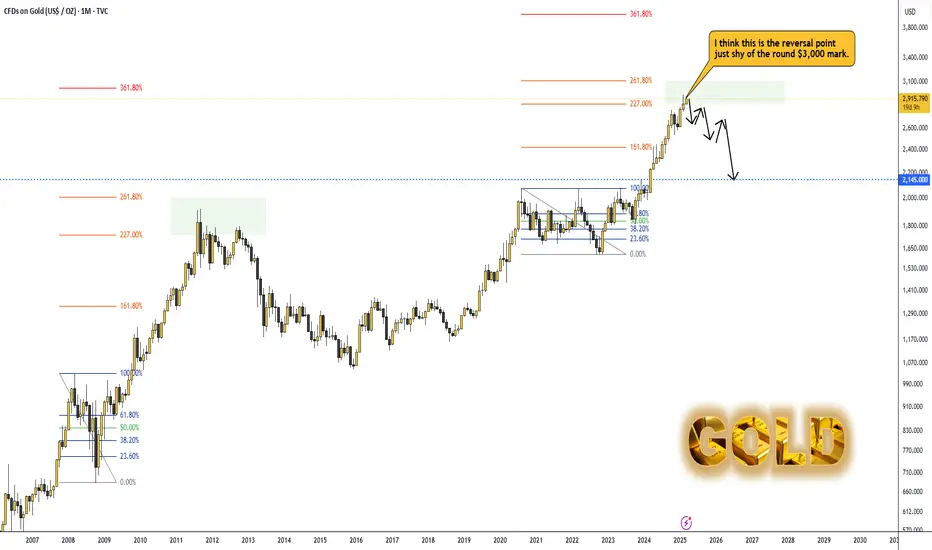
Gold is reversing before reaching the round $3,000 mark.Gold is reversing before reaching the round $3,000 mark.
As you can see on the chart, we’ve hit the 227% Fibonacci level.
— Back in 2008, after testing this level, we went into a correction.
— I think we might see a similar scenario play out from here.
Dollar Index:
SP500/SPY:
XAU/USD 02 April 2025 Intraday AnalysisH4 Analysis:
-> Swing: Bullish.
-> Internal: Bullish.
Since last analysis price has continued extremely bullish. This is most likely due to market jitters caused by Trump's tariff policy which is driving up the price of gold.
This solidifies gold as a safe haven asset and could lead to repricing.
Price has printed a bearish CHoCH indicating, but not confirming bearish pullback phase initiation.
Price is now contained within an established internal structure. I will however continue to monitor price to evaluate depth of pullback.
Intraday Expectation:
Price to trade down to either discount of internal 50% EQ or H4 demand zone before targeting weak internal high priced at 3,149.090.
Note:
With the Federal Reserve's dovish stance and persisting geopolitical uncertainties, heightened volatility in Gold is expected to continue. Traders should proceed with caution and adjust risk management strategies in this high-volatility environment.
Price could also be driven by President Trump's policies, geopolitical moves and economic decisions which are sparking uncertainty.
H4 Chart:
M15 Analysis:
-> Swing: Bullish.
-> Internal: Bullish.
Analysis and bias remains the same as yesterday's analysis dated 01 April 2025
Since last analysis price has continued extremely bullish. This is most likely due to market jitters caused by the trump tariffs.
This solidifies gold as a safe haven asset and could lead to repricing.
You will note price has printed a bearish CHoCH which indicates, but does not confirm, bearish pullback phase initiation. I will however continue to monitor price.
Intraday Expectation:
Price to trade down to either discount of 50% internal EQ or M15 demand zone before targeting weak internal high, priced at 3,149.090.
Note:
With the Federal Reserve maintaining a dovish stance and ongoing geopolitical tensions, volatility in Gold prices is expected to remain elevated. Traders should exercise caution, adjust risk management strategies, and stay prepared for potential price whipsaws in this high-volatility environment.
M15 Chart:
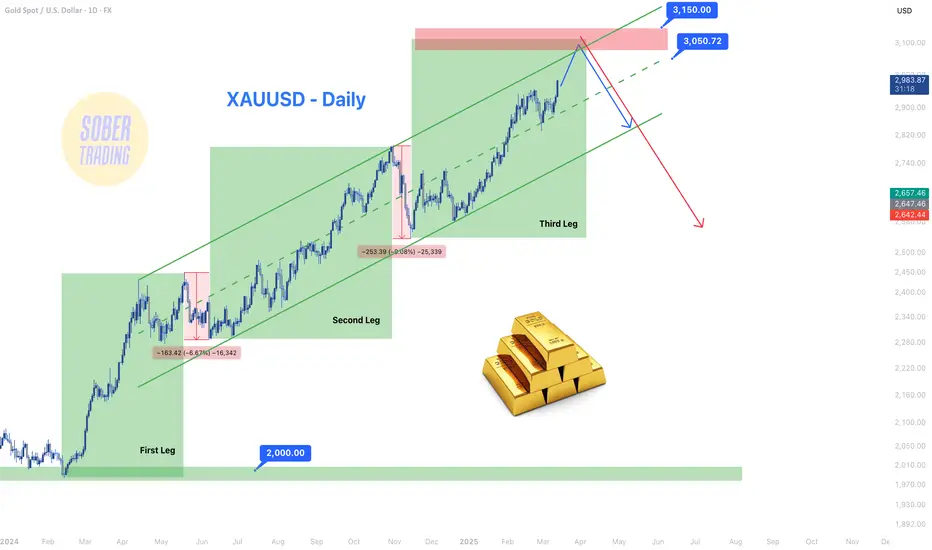
XAUUSD - Daily, Gold’s Next Big Move: Be Ready!XAUUSD - Daily Update 📈
With most analysts focusing on Gold’s bullish momentum, let’s step back and analyze where we are in the bigger picture and where we should secure profits before a potential correction.
Gold has been in a strong uptrend since the $2,000 zone, forming three major bullish legs as highlighted in the chart:
🔹 First leg correction: ~$150 drop
🔹 Second leg correction: ~$250 drop
🔹 Third correction may be deeper, so caution is needed in the target zone.
Key Levels to Watch:
📌 Potential Target Zone: $3,050 - $3,150
✔️ Measured Move: Previous legs suggest an extension into this zone.
✔️ Liquidity Grab: Gold tends to hunt liquidity over round numbers—just as it did at $2,000 → $2,060, it may break $3,050 before reversing.
✔️ Ascending Channel: The price is approaching the top of the channel, where market makers may trigger a fake breakout before a significant pullback.
🚨 Trading Strategy:
Swing traders: Secure profits near $3,050 - $3,150.
Daily traders: Use pullbacks as short-term profit opportunities.
💸 If you missed this rally, stay ahead for reversal signs & upcoming moves! Follow for more insights! 🚀
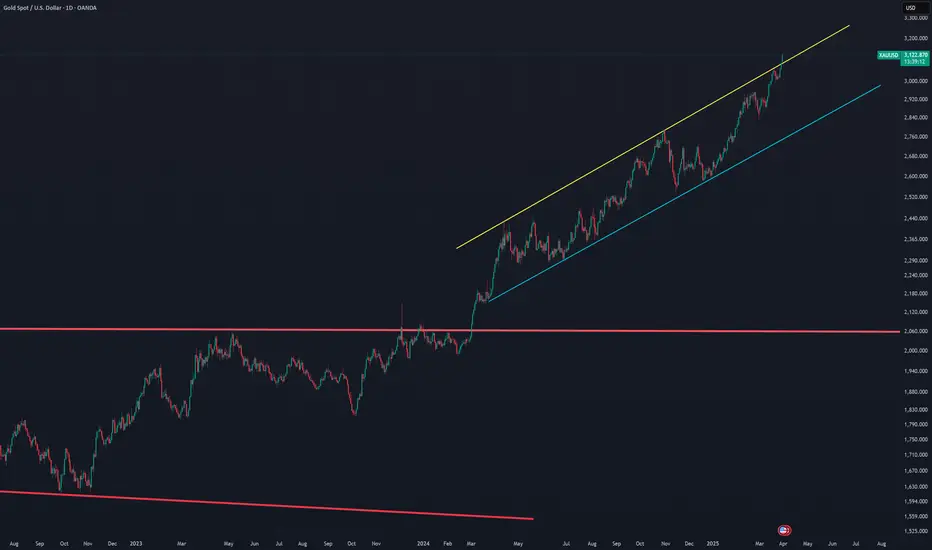
XAUUSD - Gold breaks out of rising uptrend channelXAUUSD - Gold breaks out of rising uptrend channel.
Gold continues a very strong uptrend. Possibly a blow off top coming?
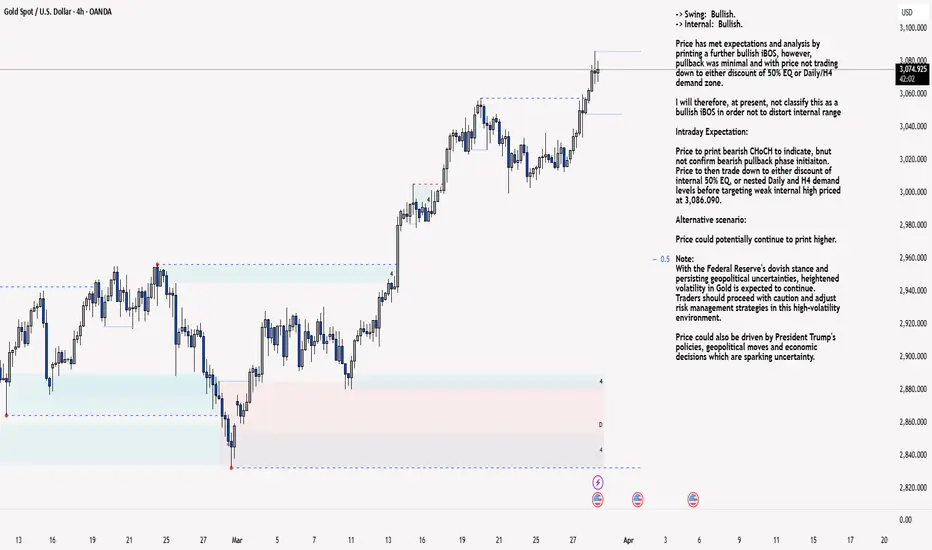
XAU/USD 28 March 2025 Intraday AnalysisH4 Analysis:
-> Swing: Bullish.
-> Internal: Bullish.
Price has met expectations and analysis by printing a further bullish iBOS, however, pullback was minimal and with price not trading down to either discount of 50% EQ or Daily/H4 demand zone.
I will therefore, at present, not classify this as a bullish iBOS in order not to distort internal range
Intraday Expectation:
Price to print bearish CHoCH to indicate, bnut not confirm bearish pullback phase initiaiton. Price to then trade down to either discount of internal 50% EQ, or nested Daily and H4 demand levels before targeting weak internal high priced at 3,086.090.
Alternative scenario:
Price could potentially continue to print higher.
Note:
With the Federal Reserve's dovish stance and persisting geopolitical uncertainties, heightened volatility in Gold is expected to continue. Traders should proceed with caution and adjust risk management strategies in this high-volatility environment.
Price could also be driven by President Trump's policies, geopolitical moves and economic decisions which are sparking uncertainty.
H4 Chart:
M15 Analysis:
-> Swing: Bullish.
-> Internal: Bullish.
Analysis and bias was not met with pricing printing a bullish iBOS.
Price has printed a bearish CHoCH to indicate bearish pullback phase initiation.
Price is now trading within an established internal range. I will however continue to monitor price.
Intraday Expectation:
Price to trade down to either discount of internal 50% EQ or M15 demand zone before targeting weak internal high priced at 3,086.090.
Note:
With the Federal Reserve maintaining a dovish stance and ongoing geopolitical tensions, volatility in Gold prices is expected to remain elevated. Traders should exercise caution, adjust risk management strategies, and stay prepared for potential price whipsaws in this high-volatility environment.
M15 Chart:
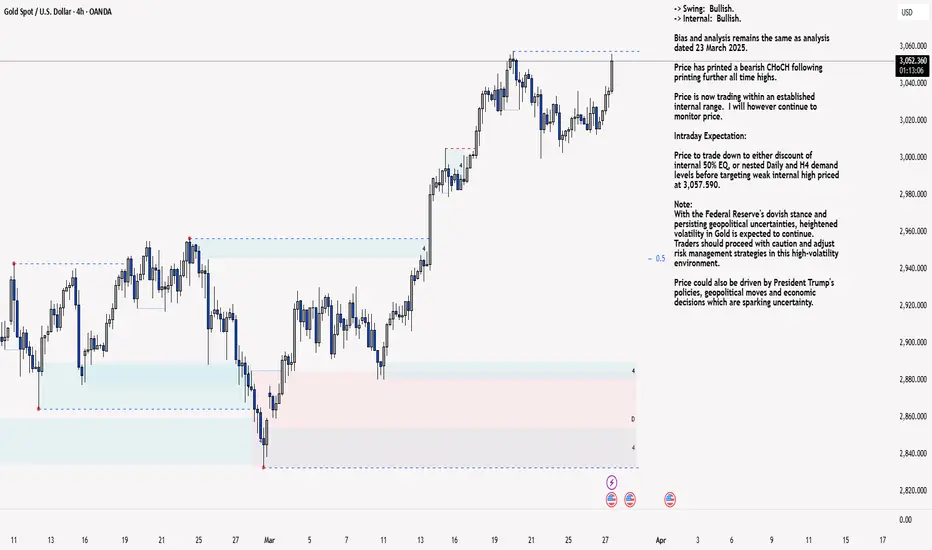
XAU/USD 27 March 2025 Intraday AnalysisH4 Analysis:
-> Swing: Bullish.
-> Internal: Bullish.
Bias and analysis remains the same as analysis dated 23 March 2025.
Price has printed a bearish CHoCH following printing further all time highs.
Price is now trading within an established internal range. I will however continue to monitor price.
Intraday Expectation:
Price to trade down to either discount of internal 50% EQ, or nested Daily and H4 demand levels before targeting weak internal high priced at 3,057.590.
Note:
With the Federal Reserve's dovish stance and persisting geopolitical uncertainties, heightened volatility in Gold is expected to continue. Traders should proceed with caution and adjust risk management strategies in this high-volatility environment.
Price could also be driven by President Trump's policies, geopolitical moves and economic decisions which are sparking uncertainty.
H4 Chart:
M15 Analysis:
-> Swing: Bullish.
-> Internal: Bearish.
Analysis and bias remains the same as analysis dated 24 March 2025.
As per analysis dated 19 March 2025 whereby I mentioned as an alternative scenario that internal range has significantly narrowed. All HTF's require a pullback, therefore, it would be completely viable if price printed a bearish iBOS.
This is how price printed, by printing a bearish iBOS.
Price has yet to print a bullish CHoCH to indicate bullish pullback phase initiation, however, price has traded into premium of 50% internal EQ, therefore, I am happy to confirm internal range.
Intraday Expectation:
Price has traded in to premium of 50% EQ and has mitigated M15 supply zone.
Technically, price to target weak internal low priced at 2,999.465.
Note:
With the Federal Reserve maintaining a dovish stance and ongoing geopolitical tensions, volatility in Gold prices is expected to remain elevated. Traders should exercise caution, adjust risk management strategies, and stay prepared for potential price whipsaws in this high-volatility environment.
M15 Chart:
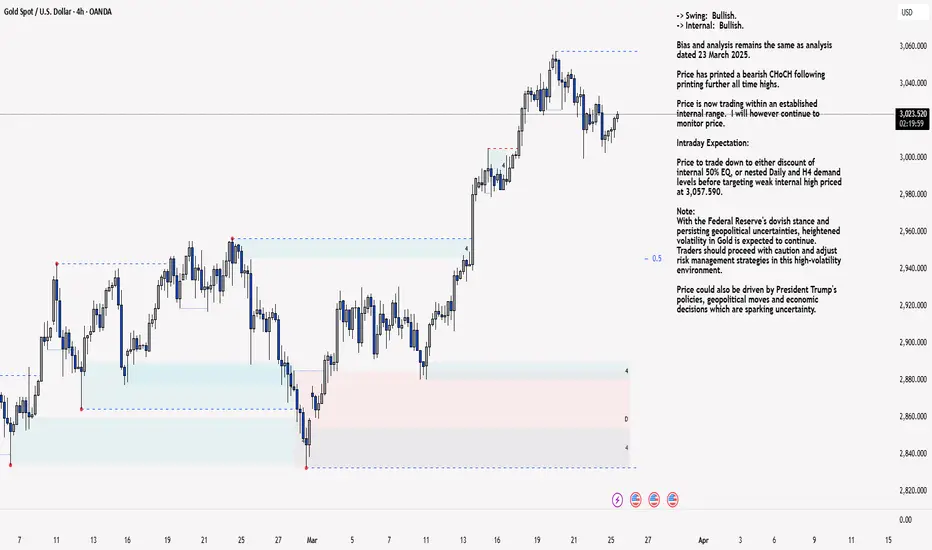
XAU/USD 25 March 2025 Intraday AnalysisH4 Analysis:
-> Swing: Bullish.
-> Internal: Bullish.
Bias and analysis remains the same as analysis dated 23 March 2025.
Price has printed a bearish CHoCH following printing further all time highs.
Price is now trading within an established internal range. I will however continue to monitor price.
Intraday Expectation:
Price to trade down to either discount of internal 50% EQ, or nested Daily and H4 demand levels before targeting weak internal high priced at 3,057.590.
Note:
With the Federal Reserve's dovish stance and persisting geopolitical uncertainties, heightened volatility in Gold is expected to continue. Traders should proceed with caution and adjust risk management strategies in this high-volatility environment.
Price could also be driven by President Trump's policies, geopolitical moves and economic decisions which are sparking uncertainty.
H4 Chart:
M15 Analysis:
-> Swing: Bullish.
-> Internal: Bearish.
Analysis and bias remains the same as yesterday's analysis dated 24 March 2025.
As per analysis dated 19 March 2025 whereby I mentioned as an alternative scenario that internal range has significantly narrowed. All HTF's require a pullback, therefore, it would be completely viable if price printed a bearish iBOS.
This is how price printed, by printing a bearish iBOS.
Price has yet to print a bullish CHoCH to indicate bullish pullback phase initiation, however, price has traded into premium of 50% internal EQ, therefore, I am happy to confirm internal range.
Intraday Expectation:
Price has traded in to premium of 50% EQ and has mitigated M15 supply zone.
Technically, price to target weak internal low priced at 2,999.465.
Note:
With the Federal Reserve maintaining a dovish stance and ongoing geopolitical tensions, volatility in Gold prices is expected to remain elevated. Traders should exercise caution, adjust risk management strategies, and stay prepared for potential price whipsaws in this high-volatility environment.
M15 Chart:
XAUUSD , we encounter to the trendlineHello everyone
According to the the chart and the time , if the candle stick is closing to complete the candle stick pattern and cannot go up to the trendline you can take short position, BE AWARE .
if you have any question and need help send us messages
Thank you
AA
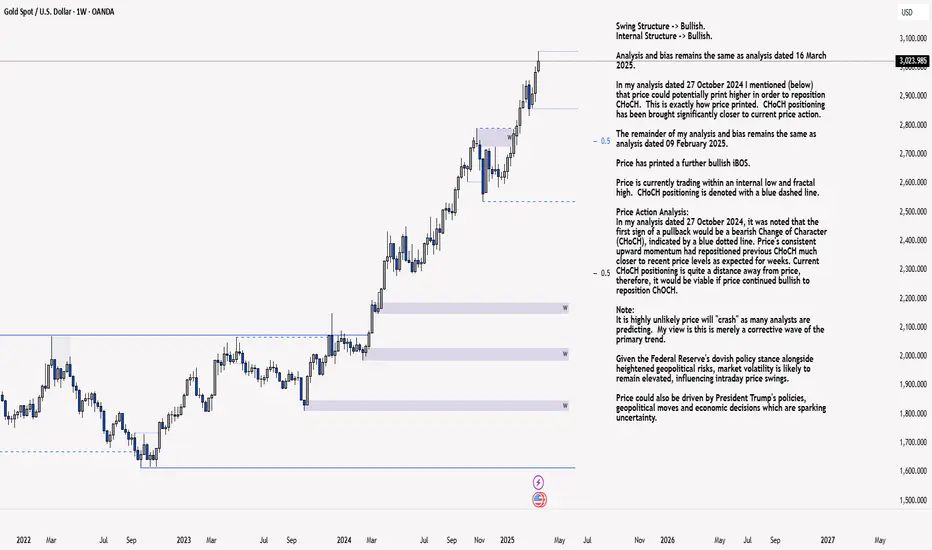
XAU/USD 24-28 March 2025 Weekly AnalysisWeekly Analysis:
Swing Structure -> Bullish.
Internal Structure -> Bullish.
Analysis and bias remains the same as analysis dated 16 March 2025.
In my analysis dated 27 October 2024 I mentioned (below) that price could potentially print higher in order to reposition CHoCH. This is exactly how price printed. CHoCH positioning has been brought significantly closer to current price action.
The remainder of my analysis and bias remains the same as analysis dated 09 February 2025.
Price has printed a further bullish iBOS.
Price is currently trading within an internal low and fractal high. CHoCH positioning is denoted with a blue dashed line.
Price Action Analysis:
In my analysis dated 27 October 2024, it was noted that the first sign of a pullback would be a bearish Change of Character (CHoCH), indicated by a blue dotted line. Price's consistent upward momentum had repositioned previous CHoCH much closer to recent price levels as expected for weeks. Current CHoCH positioning is quite a distance away from price, therefore, it would be viable if price continued bullish to reposition CHOCH.
Note:
It is highly unlikely price will "crash" as many analysts are predicting. My view is this is merely a corrective wave of the primary trend.
Given the Federal Reserve's dovish policy stance alongside heightened geopolitical risks, market volatility is likely to remain elevated, influencing intraday price swings.
Price could also be driven by President Trump's policies, geopolitical moves and economic decisions which are sparking uncertainty.
Weekly Chart:
Daily Analysis:
Swing -> Bullish.
Internal -> Bullish.
Price continued bullish repositioning bearish CHoCH positioning closer to current price action.
Price is now trading within an internal low and fractal high.
Expectation is for price to print bearish CHoCH to indicate, but not confirm bearish pullback phase initiation. CHoCH positioning is denoted with a blue dotted line.
Note:
With the Fed maintaining a dovish policy stance and the continued rise in geopolitical tensions, we should anticipate elevated market volatility, which may impact both intraday and longer-term price action.
Price could also be driven by President Trump's policies, geopolitical moves and economic decisions which are sparking uncertainty and the repricing of Gold.
Daily Chart:
H4 Analysis:
-> Swing: Bullish.
-> Internal: Bullish.
Analysis and bias remains the same as analysis dated 21 March 2025.
Price has printed a bearish CHoCH following printing further all time highs.
Price is now trading within an established internal range. I will however continue to monitor price.
Intraday Expectation:
Price to trade down to either discount of internal 50% EQ, or nested Daily and H4 demand levels before targeting weak internal high priced at 3,057.590.
Note:
With the Federal Reserve's dovish stance and persisting geopolitical uncertainties, heightened volatility in Gold is expected to continue. Traders should proceed with caution and adjust risk management strategies in this high-volatility environment.
Price could also be driven by President Trump's policies, geopolitical moves and economic decisions which are sparking uncertainty.
H4 Chart:
Gold Falls from Peak, but Rate Cut Hopes Keep Outlook Positive● Gold prices fell after hitting a high at $3057.59 due to a stronger US dollar, making it more expensive for overseas buyers.
● Despite this, gold is set for its third consecutive weekly gain, up 0.7% this week.
● Market participants expect at least two US Federal Reserve rate cuts this year, supporting gold's long-term bullish outlook.
◉ Technical Observations
● While moving through the rising parallel channel, the price has just faced resistance from the upper boundary and is expected to have a pullback towards $2,950.
● If the price slips below this level, the next strong support is expected near $2,790.

XAU/USD 13 March 2025 Intraday AnalysisH4 Analysis:
-> Swing: Bullish.
-> Internal: Bearish.
Analysis/Bias remains the same as analysis dated 07 March 2024.
Price has printed a bullish CHoCH according to analysis and bias dated 28 February 2025.
Price is currently trading within an established internal range.
Intraday Expectation:
Price is now trading in premium of 50% internal EQ where we could see a reaction at any point. Price could also target H4 supply zone before targeting weak internal low, priced at 2,832.720
Note:
With the Federal Reserve's dovish stance and persisting geopolitical uncertainties, heightened volatility in Gold is expected to continue. Traders should proceed with caution and adjust risk management strategies in this high-volatility environment.
Price could also be driven by President Trump's policies, geopolitical moves and economic decisions which are sparking uncertainty.
H4 Chart:
M15 Analysis:
-> Swing: Bullish.
-> Internal: Bullish.
Analysis and bias has not been met, largely due macroeconomic events, particularly the Trump trade tariff war, which is causing uncertainty within the markets which is supporting Gold price.
Price has printed a bullish iBOS.
Within the structure following the iBOS, price has printed a several bearish CHoCH's with very minimal pullbacks before continuing bullish.
In order not to distort internal structure range I will apply discretion and not classify bearish CHoCH without considerable pullback.
Intraday Expectation:
Await for price to print Bearish CHoCH which is supported by a pullback relative to recent price action.
Note:
With the Federal Reserve maintaining a dovish stance and ongoing geopolitical tensions, volatility in Gold prices is expected to remain elevated. Traders should exercise caution, adjust risk management strategies, and stay prepared for potential price whipsaws in this high-volatility environment.
M15 Chart:

Gold Prices Rise as Inflation Fears Subside◉ Fundamental Rationale
● Gold prices remain steady despite a strong US dollar, supported by a softer-than-expected US CPI report.
● The US CPI report showed a 0.4% rise, lower than the forecasted 0.5%, easing inflation concerns.
● Weaker US inflation data reduces the likelihood of a rate hike, making gold more attractive to investors.
● The strong US dollar, fueled by a surge in US Treasury yields, failed to dent gold's appeal.
● Prices are expected to remain supported as investors seek safe-haven assets amid economic uncertainty.
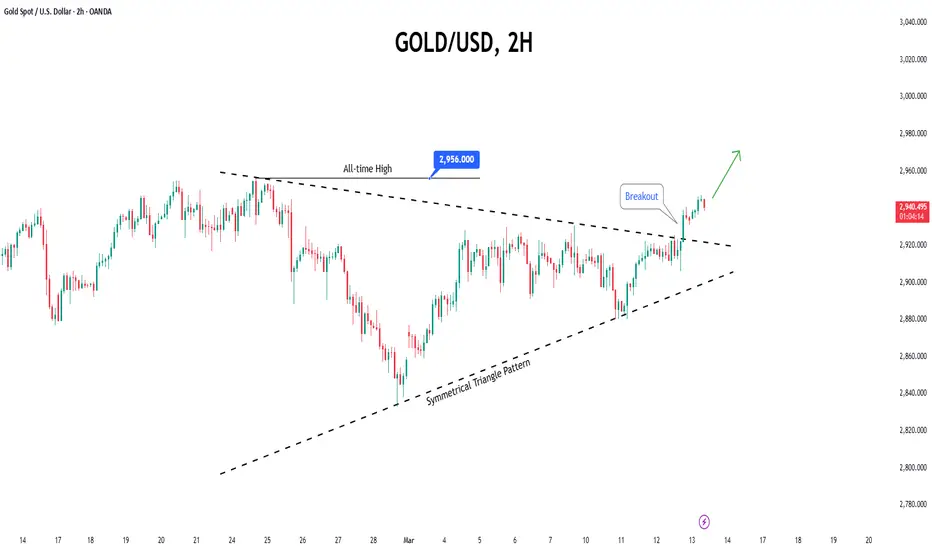
◉ Technical Observations
● Gold prices have broken free from a Symmetrical Triangle pattern and surged upward.
● Currently trading near all-time highs, the rally is expected to continue, propelling prices beyond the previous high.
Big drop coming for Gold ?There will be a possible drop to the 2870 level first where it will consolidate for a while before starting the big drop to 2600 area.

XAU/USD 07 March 2025 Intraday AnalysisH4 Analysis:
-> Swing: Bullish.
-> Internal: Bearish.
Price has printed a bullish CHoCH according to analysis and bias dated 28 February 2025.
Price is currently trading within an established internal range.
Intraday Expectation:
Price is now trading in premium of 50% internal EQ where we could see a reaction at any point. Price could also target H4 supply zone before targeting weak internal low, priced at 2,832.720
Note:
With the Federal Reserve's dovish stance and persisting geopolitical uncertainties, heightened volatility in Gold is expected to continue. Traders should proceed with caution and adjust risk management strategies in this high-volatility environment.
Price could also be driven by President Trump's policies, geopolitical moves and economic decisions which are sparking uncertainty.
H4 Chart:
M15 Analysis:
-> Swing: Bullish.
-> Internal: Bearish.
Analysis and bias remains the same as analysis dated 03 March 2023.
As mentioned in my analysis dated 28 February 2025, whereby price printed a bullish CHoCH but stated I would continue to monitor price.
On this occasion I have marked the previous bullish CHoCH in red as price did not pull back deeply enough to warrant internal structure breaks, additionally, there was minimal time spent.
Price has printed a further bullish CHoCH which is now confirmed. Price is not trading within an established internal range.
Intraday Expectation:
Price to continue bullish, react at either premium of internal 50% EQ, or M15 supply zone before targeting weak internal low priced at 2,832.720.
Note:
With the Federal Reserve maintaining a dovish stance and ongoing geopolitical tensions, volatility in Gold prices is expected to remain elevated. Traders should exercise caution, adjust risk management strategies, and stay prepared for potential price whipsaws in this high-volatility environment.
M15 Chart:

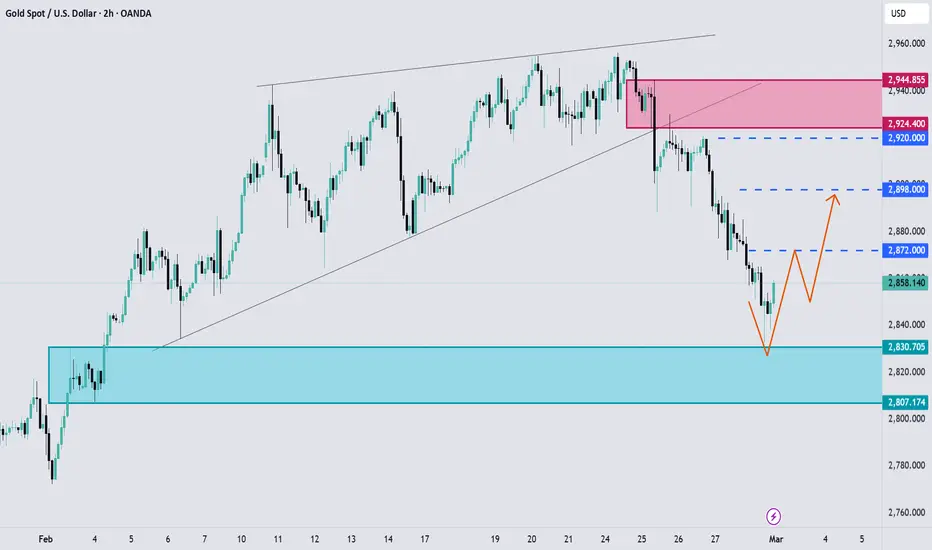
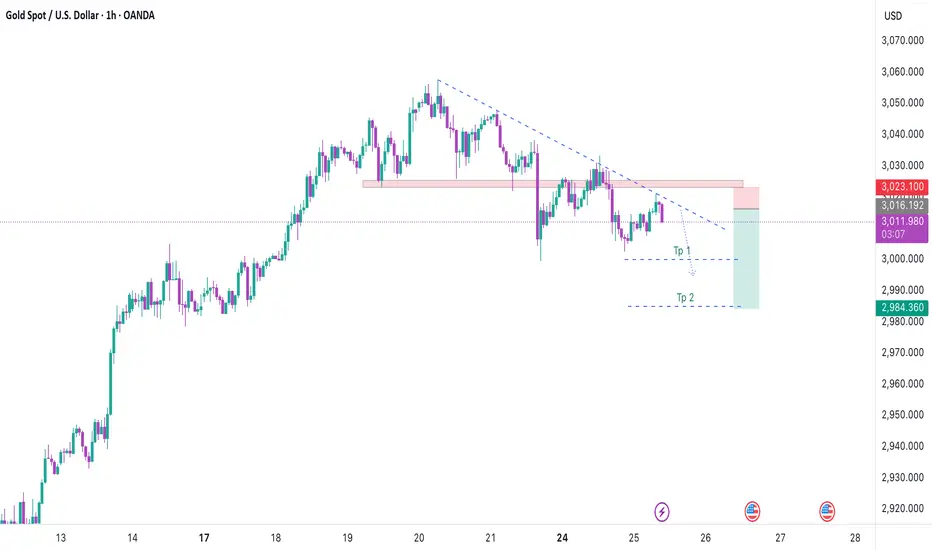
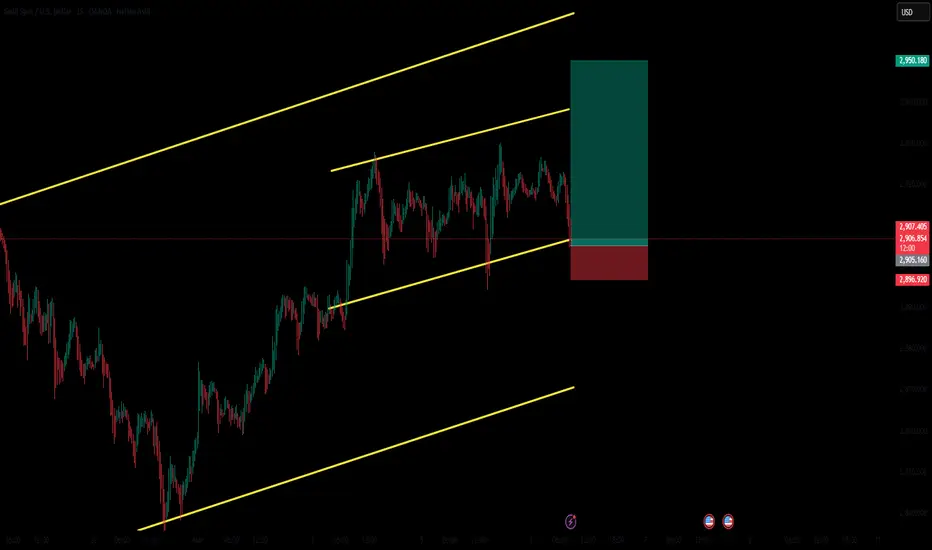
Gold bullish to 2950 ?Gold is at the support of the channel
I expect a bullish move to 2950
Stop loss: 2895
Gold, An upward movement incoming ?Hello traders, I hope you are great. our latest analysis on Gold hit all its targets and we gained a profit of around 800 pips; but what's next ? Will the price continue its downward correction or not ? Let's clarify things a bit to make decision making easier for ourselves:
With the delayed possibility of a ceasefire in the war between Ukraine and Russia, as well as existing tensions between the USA and other countries, the likelihood of a continued correction in gold has diminished at least in the short term.
We should also keep in mind that there is a possibility of renewed conflict between Hamas and Israel in the upcoming Days.
If we have consider these factors together, it seems to me there is at least a chance of another upward movement in Gold. Targets have determined by Blue dashed lines.
And finally Tell me What are your thoughts about GOLD ? UP or DOWN ? comment your opinion below this post.