Alphabet (GOOGL) extends its rally on upbeat 2Q earnings
US equities continue to post record highs, driven by stronger-than-expected 2Q earnings and optimism over ongoing trade agreements. Alphabet’s (GOOGL) Q2 results reaffirmed the accelerating pace of AI-led growth. The company’s cloud revenue surged 32% YoY, up from 28% in 1Q, and it raised its full-year capex guidance from $75B to $85B.
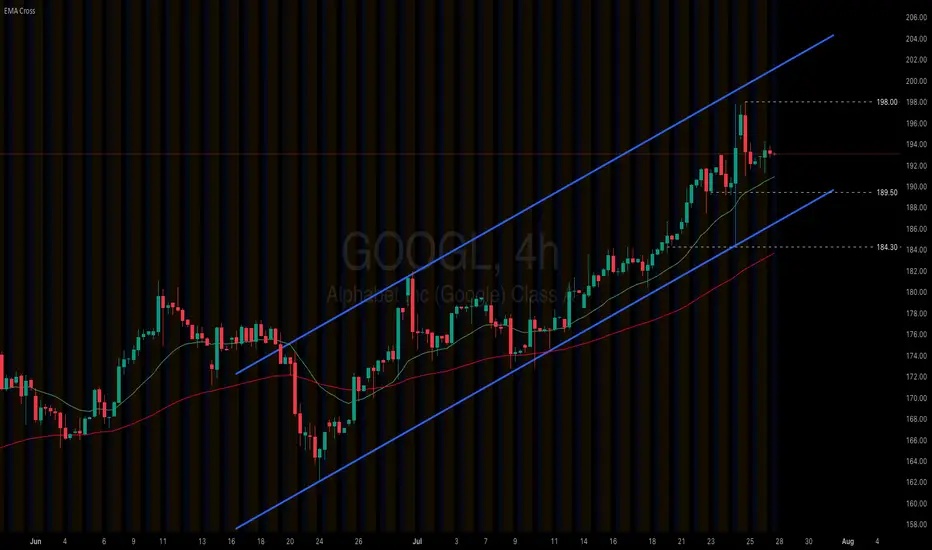
Alphabet (GOOGL) remains firm within its ascending channel. The price solidly holds above both EMAs, indicating the potential extension of bullish momentum. If Alphabet (GOOGL) holds above EMA21, the price may gain upside traction toward the previous high at 198.00. Conversely, if Alphabet (GOOGL) breaks below the support at 189.50, the price could retreat to the next support at 184.30.
GOOGL
Stock Market Forecast | TSLA NVDA AAPL AMZN META MSFTStock Market Forecast | CME_MINI:NQ1! CME_MINI:ES1! SPY QQQ
Mag 7 forecast NASDAQ:TSLA NASDAQ:NVDA AAPL AMZN META MSFT GOOG

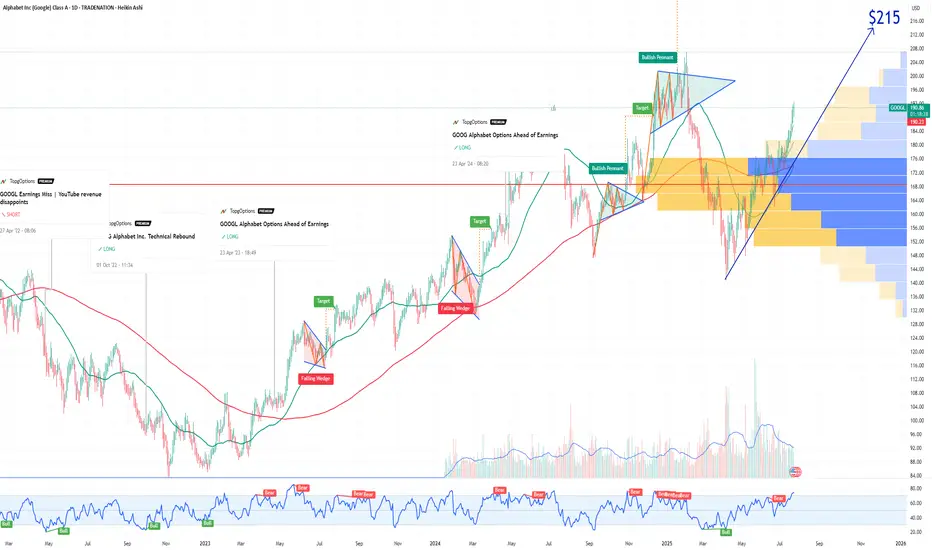
Alphabet (GOOGL) Stock Chart Analysis Following Earnings ReleaseAlphabet (GOOGL) Stock Chart Analysis Following Earnings Release
Earlier this week, we highlighted the prevailing bullish sentiment in the market ahead of Alphabet’s (GOOGL) earnings report, noting that:
→ an ascending channel had formed;
→ the psychological resistance level at $200 was of particular importance.
The earnings release confirmed the market’s optimism, as the company reported better-than-expected profits, driven by strong performance in both its advertising and cloud segments.
In his statement, CEO Sundar Pichai noted that AI is positively impacting all areas of the business, delivering strong momentum.
The company is expected to allocate $75 billion this year to expand its AI capabilities.
As a result, Alphabet (GOOGL) opened yesterday’s trading session with a bullish gap (as indicated by the arrow). However, as the session progressed, the price declined significantly, fully closing the gap.
This suggests that:
→ the bulls failed to consolidate their gains, allowing the bears to seize the initiative;
→ the ascending channel remains valid, with yesterday’s peak testing its upper boundary;
→ such price action near the $200 level reinforces expectations that this psychological mark will continue to act as resistance.
It is possible that the positive sentiment following the earnings report may weaken in the near term. Accordingly, traders may consider a scenario in which Alphabet’s (GOOGL) share price retraces deeper into the existing ascending channel. In this case, the former resistance levels at $180 and $184 may serve as a support zone.
This article represents the opinion of the Companies operating under the FXOpen brand only. It is not to be construed as an offer, solicitation, or recommendation with respect to products and services provided by the Companies operating under the FXOpen brand, nor is it to be considered financial advice.
GOOGL Alphabet Options Ahead of EarningsIf you haven`t bought GOOGL before the rally:
Now analyzing the options chain and the chart patterns of GOOGL Alphabet prior to the earnings report this week,
I would consider purchasing the 215usd strike price Calls with
an expiration date of 2026-1-16,
for a premium of approximately $8.20.
If these options prove to be profitable prior to the earnings release, I would sell at least half of them.
Disclosure: I am part of Trade Nation's Influencer program and receive a monthly fee for using their TradingView charts in my analysis.
Head and Shoulders on $GOOGL right before earnings?- NASDAQ:GOOGL perhaps good news are already priced in?
- No positions on NASDAQ:GOOGL but interestingly it has given both bears and bull something to consider?
- Spectating what happens next!
- Interesting setup, bulls eyeing 200+ and bears targeting low 160s
- Good luck
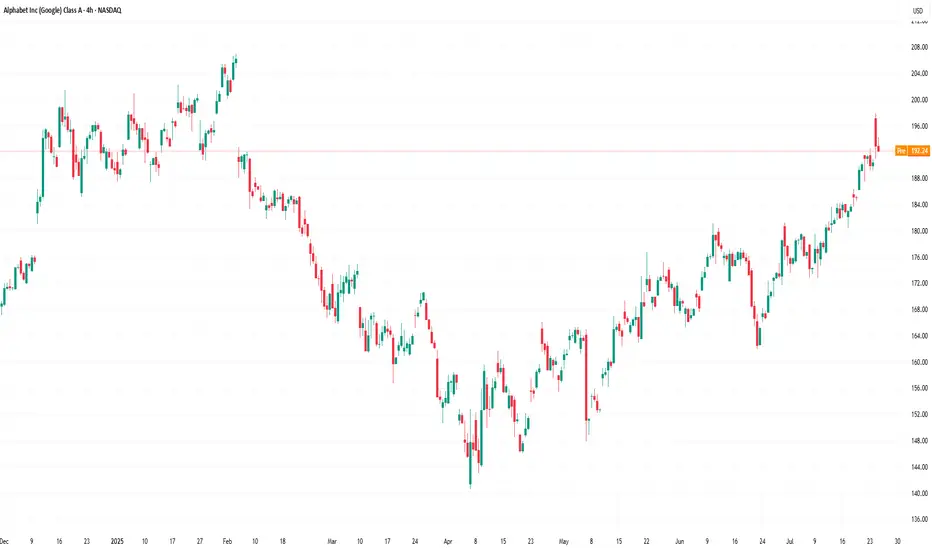
Alphabet (GOOGL) Stock Approaches $200 Ahead of Earnings ReleaseAlphabet (GOOGL) Stock Approaches $200 Ahead of Earnings Release
According to the Alphabet (GOOGL) stock chart, the share price rose by more than 2.5% yesterday. Notably:
→ the price reached its highest level since early February 2025;
→ the stock ranked among the top 10 performers in the S&P 500 by the end of the day.
The positive sentiment is driven by expectations surrounding the upcoming quarterly earnings report, scheduled for release tomorrow, 23 July.
What to Know Ahead of Alphabet’s (GOOGL) Earnings Release
According to media reports, Wall Street analysts forecast Alphabet’s Q2 revenue to grow by approximately 11% year-on-year, with expected earnings per share (EPS) of around $2.17 — up from $1.89 a year earlier. Notably, the company has consistently outperformed estimates for nine consecutive quarters, setting a positive tone ahead of the announcement.
Despite the optimism, investors are closely monitoring two key areas:
→ Cloud computing competition , where Google Cloud contends with Microsoft Azure and Amazon AWS;
→ Growing competition in the search sector , linked to the rise of AI-based platforms such as ChatGPT.
In response, Alphabet is significantly increasing its capital expenditure on AI infrastructure, planning to spend around $75 billion in 2025. These investments are aimed at both defending its core search business and advancing the Gemini AI model, while also strengthening Google Cloud’s market position.
Technical Analysis of Alphabet (GOOGL) Stock
Since April, GOOGL price fluctuations have formed an ascending channel (marked in blue).
From a bullish perspective:
→ the June resistance level at $180 has been breached and may soon act as support;
→ previous bearish reversals (marked with red arrows) failed to gain momentum, suggesting sustained demand is pushing the price higher.
From a bearish standpoint, the price is approaching:
→ the psychological level of $200, which has acted as a major resistance since late 2024;
→ this barrier may be reinforced by a bearish gap formed in early February.
Strong results from the previous quarter, combined with optimistic forward guidance from Alphabet’s management, could provide bulls with the confidence needed to challenge the $200 level.
This article represents the opinion of the Companies operating under the FXOpen brand only. It is not to be construed as an offer, solicitation, or recommendation with respect to products and services provided by the Companies operating under the FXOpen brand, nor is it to be considered financial advice.

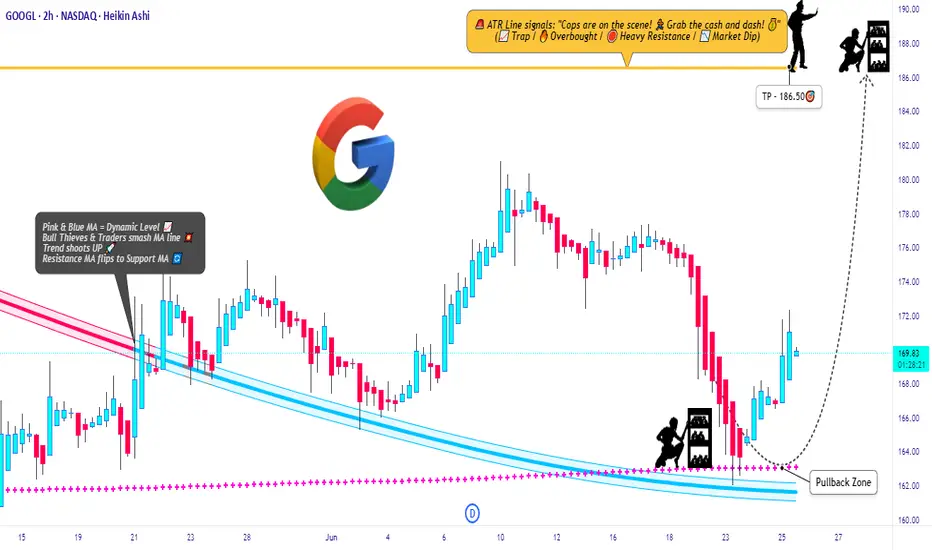
GOOGL Raid Plan: Bulls Set to Hijack the Chart!💎🚨**Operation GOOGL Grab: Robbery in Progress! Swing & Run!**🚨💎
🌟Hi! Hola! Ola! Bonjour! Hallo! Marhaba!🌟
Dear Money Makers & Silent Robbers, 🤑💰💸✈️
Get ready for another high-stakes market heist – this time, we’re raiding the vaults of GOOGL (Alphabet Inc.) using the Thief Trading Strategy™. Based on sharp technical intel and subtle fundamental whispers, the setup is clear: the bulls have cracked the code, and it’s time to grab our loot.
🟢 🎯 ENTRY POINT - THE LOOT ZONE
"The vault is wide open!"
Snatch your bullish entry anywhere on the chart, but the pros will place limit buys on recent pullbacks (15m/30m zones), either on swing lows or highs. The pullback is your door in — don’t miss it!
🛑 STOP LOSS - ESCAPE ROUTE
Set the Thief SL at the recent 2H swing low (162.00).
But remember, each robber’s risk appetite is unique — adjust your SL based on your size, cash, and courage.
🎯 TARGET - GETAWAY MONEY
💼 Main Target: 186.50
Or if heat rises early, vanish with your gains before the full score hits. Disappear like a ghost — profit first, questions later!
🧲 FOR SCALPERS – THE QUICK GRAB
Only ride the long wave — shorting is off-limits in this mission.
If your wallet is loaded, dive in. If not, join the swing crew.
Use trailing SL to protect your cash stack 💰.
📈 THE SETUP – WHY THIS RAID WORKS
The GOOGL Market is bursting with bullish energy — a classic Red Zone robbery moment.
Overbought tension, fakeouts, trend shifts — exactly where we love to strike! Consolidation and reversals = opportunity for the brave.
📣 TRADING ALERT - NEWS AHEAD!
🚨 Avoid entries during news releases – they trigger alarms!
Use trailing SL to lock in your stash, especially during high-volatility windows.
🔍 TIPS FROM THE THIEF’S DESK
Stay updated with the latest whispers — from fundamentals to geopolitical noise, COT positioning to sentiment swings. The market changes faster than a thief on the run — so adapt fast!
💖 Show some love: 💥Hit that Boost Button💥
Let’s fuel this robbery plan with more power and precision.
Every day in the market is a new heist — let’s win like thieves, not sheep. 🏆💪🤝❤️🚀
I'll be back soon with another masterplan...
📡 Stay sharp, stay hidden — and always aim for the vault. 🤑🐱👤🎯
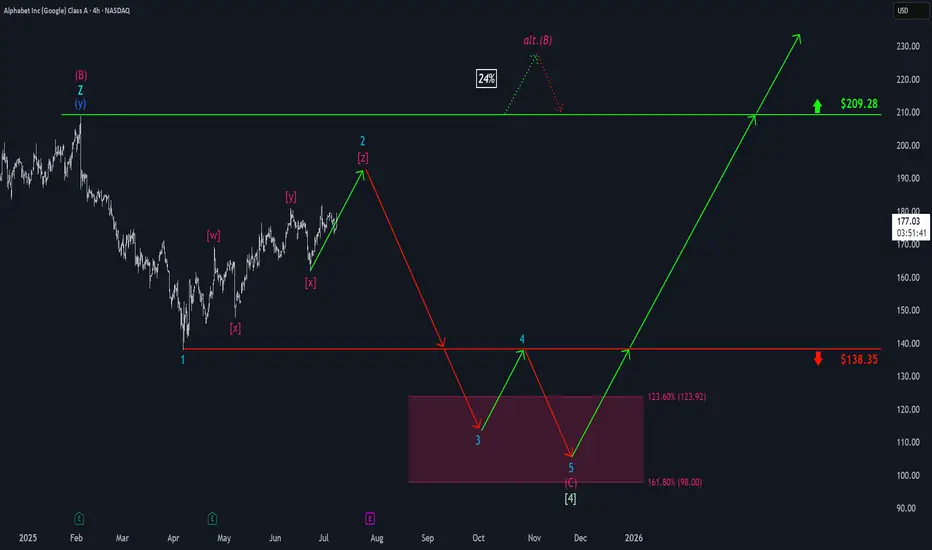
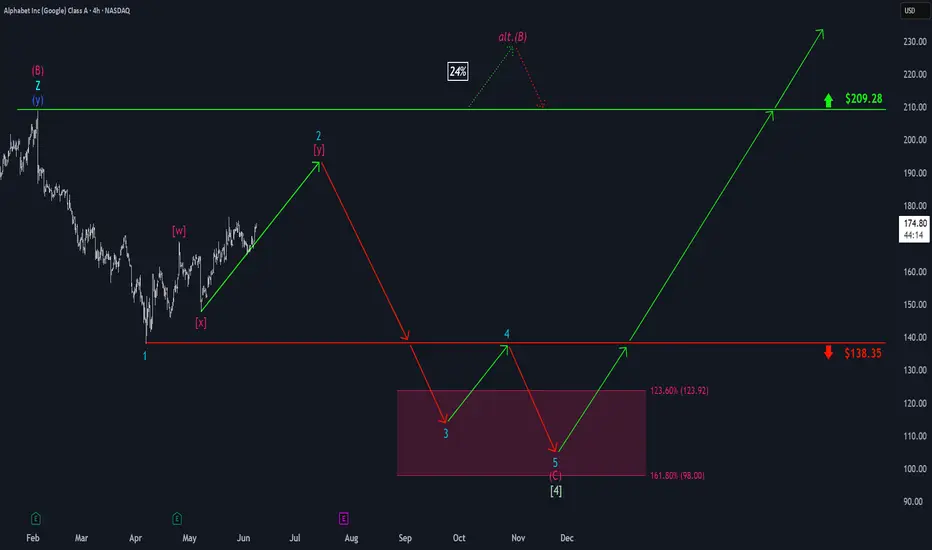
Google: Upcoming TopWe locate Google in turquoise wave 2 (of a downward impulse). In more detail, we see the stock developing a complex - - - pattern and expect turquoise wave 2 to conclude imminently with wave . All the while, the price should maintain a safe distance from resistance at $209.28. Looking ahead to turquoise wave 3, we anticipate sell-offs down into our magenta Target Zone between $123.92 and $98, before wave 4 likely triggers a temporary rebound up to the $138.35 level. Ultimately, the entire turquoise downward impulse should bottom out again in the magenta zone, which would also mark the completion of waves (C) in magenta and in green. Since a new larger upward phase should begin afterward, the magenta zone presents an opportunity to establish long positions. However, if Google were to break above the $209.28 resistance next, we would have to expect a new high for magenta wave alt.(B) —which would only temporarily postpone the anticipated sell-off though (probability: 24%).
📈 Over 190 precise analyses, clear entry points, and defined Target Zones - that's what we do.
GOOGLE Count changed, Bullish outlook.I have adjusted NASDAQ:GOOG NASDAQ:GOOGL Elliot wave count with a wave 1 completing a leading diagonal backed up by a deep wave 2 correction into High Volume Node support (HVN). We potentially have another 1-2 with fast drop and recovery to the S1 daily pivot which would make long term outlook extra bullish by extending target.
Wave 3 is underway with a target of the all time hime high HVN for wave 5. The next resistance HVN is $191.
Price above the daily pivot and is continuing upwards after testing as support.
Analysis is invalidated below $162 swing low.
Safe trading
Inevitable Pull Back Coming Soon?| NVDA TSLA AAPL AMZN META MSFTStock market Forecast | QQQ SPY CME_MINI:NQ1! CME_MINI:ES1!
Mag 7 FORECAST| NASDAQ:NVDA NASDAQ:TSLA AAPL AMZN META MSFT July 2025 Forecast

SPY & MegaCap strengthSPY saw a very strong gap up, negating most of the selling from last week.
despite rising tensions in the middle east - investors have shrugged off volatility and bought the initial dip.
This may be proving that "war" is good for stocks.
we observed a very close correlation between the indices and oil today.
As oil reversed higher - markets saw a bit of weakness. As oil fell markets rallied.
TSLA trying to break a 4 hour bullish pattern
META new Smart Glasses release causing a surge.
MSFT new all time high tap
NVDA firm with ripping semiconductors
GOOGL looking strong for continuation
AMZN moving nicely off support
AAPL lagging the mega's but positive

Stock Market Forecast | TSLA NVDA AAPL AMZN META MSFTStock Market Forecast | CME_MINI:NQ1! CME_MINI:ES1! SPY QQQ
Mag 7 Forecast | NASDAQ:TSLA NVDA AAPL AMZN META MSFT GOOG

Google (Alphabet): Overarching Downside PotentialAlphabet (GOOGL) hasn’t been able to reclaim its May 22 high and has settled into a consolidation range around the $170 level. Still, under our primary scenario, we expect the current corrective upswing to continue for a bit before turquoise wave 3 resumes the downtrend. That move should break below $138.35 and carry the price into the magenta Target Zone between $123.92 and $98. After that, a rebound within wave 4 is likely, though it probably won’t be strong enough to retake the $138.35 level. A final leg down in wave 5 should then complete the correction, driving the price deeper into the zone and establishing the low of green wave . This area also marks a potential turning point for the next major move upward. Meanwhile, a detour above resistance at $209.28 for a new high of magenta wave alt.(B) is 24% likely.
📈 Over 190 precise analyses, clear entry points, and defined Target Zones - that's what we do.
GOOG | The Year of Quantum | LONGAlphabet, Inc. is a holding company, which engages in software, health care, transportation, and other technologies. It operates through the following segments: Google Services, Google Cloud, and Other Bets. The Google Services segment includes products and services, such as ads, Android, Chrome, devices, Google Maps, Google Play, Search, and YouTube. The Google Cloud segment refers to infrastructure and platform services, collaboration tools, and other services for enterprise customers. The Other Bets segment relates to the sale of healthcare-related services and internet services. The company was founded by Lawrence E. Page and Sergey Mikhaylovich Brin on October 2, 2015 and is headquartered in Mountain View, CA.
GOOGL Swing Trade Plan – 2025-06-06📈 GOOGL Swing Trade Plan – 2025-06-06
Bias: Moderately Bullish
Timeframe: 7–10 days
Catalyst: Ongoing AI sector momentum, low VIX, strong long-term trend
Trade Type: Single-leg call option
🧠 Model Summary Table
Model Direction Strike Entry Price Targets Stop Confidence
Grok Moderately Bullish $182.50 $0.92 +50% -50% 72%
Claude Moderately Bearish $170 PUT $1.95 +50–100% -30% 75%
Llama Moderately Bullish $182.50 $0.92 +50–70% -20–30% 80%
Gemini Moderately Bullish $182.50 $0.92 $1.38 / $1.84 $0.45 75%
DeepSeek Neutral (No Trade) — — — — 60%
✅ Consensus: Moderately Bullish
⚠️ Short-Term Disagreement: Claude and DeepSeek flag short-term overbought risk
📉 Technical & Sentiment Summary
Price Action: Strong bullish trend on daily/weekly; 15-min extended
RSI: Overbought on short-term, but daily RSI has room
MACD: Mixed intraday, bullish daily
Sentiment: AI hype supportive, VIX declining
Max Pain: $165 → minor resistance bias, unlikely to dominate
✅ Final Trade Setup
Parameter Value
Instrument GOOGL
Direction CALL (LONG)
Strike $182.50
Expiry 2025-06-20
Entry Price $0.92
Profit Target $1.38 (+50%)
Stop Loss $0.64 (–30%)
Size 1 contract
Entry Timing At market open
Confidence 75%
💡 Rationale: 4 of 5 models lean bullish; solid R/R from this OTM strike with tight premium.
⚠️ Risks to Watch
15-min chart overbought RSI could cause chop early next week
MACD divergence on lower timeframes may delay breakout
Max Pain at $165 could cap upside short-term if momentum fades
Time decay intensifies midweek → stick to stop or trail profits

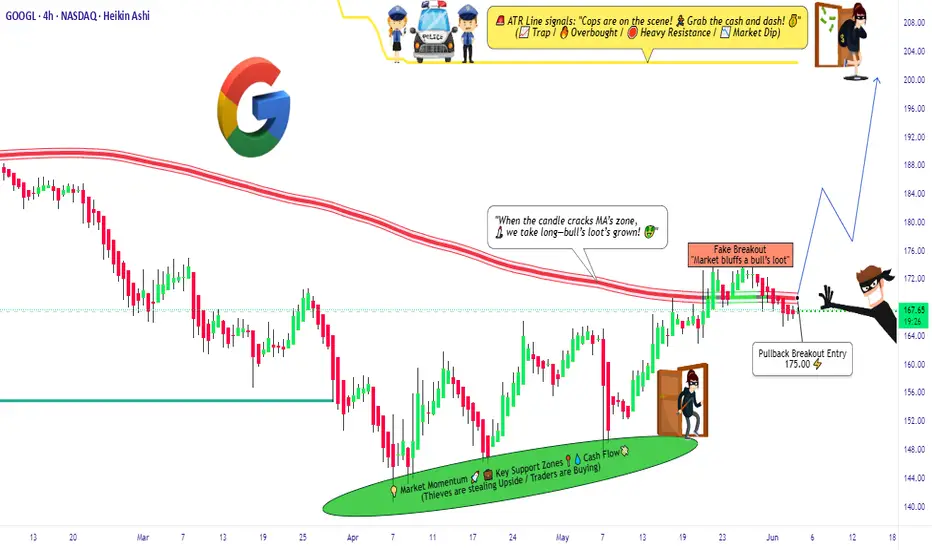
"GOOGL Technical Play: MA Bounce for Swing Traders!"🚀 GOOGL Stock Heist: The Ultimate AI & Ad-Tech Gold Rush (Swing Trade Plan)
🌟 Market Pirates, Ready to Raid? 🏴☠️💰
🔥 Thief Trading Blueprint for GOOGL (Alphabet Inc.)
🎯 Entry (The Vault is Open!)
Pullback Breakout Strategy:
Buy Zone: Wait for a pullback near the Moving Average "Wall" (e.g., 200-day LSMA, depending on trend alignment).
Confirmation: Enter long if price bounces off the MA with volume support or breaks above a tight consolidation.
Exact Entry: $175.00 (key psychological level + MA confluence). Use buy limits for precision.
Breakout Add-On: If GOOGL clears $180 with momentum, consider adding to the position.
🛑 Stop Loss (Escape Route)
SL: Place below the recent swing low (4H/1D timeframe) or 2-3% below entry (~$170.50 if entering at $175).
Trailing SL: Adjust upward as price climbs to lock profits.
🏆 Target 🎯: $200.00 (The Ad-Tech & AI Jackpot!)
Why $200?
Cantor Fitzgerald’s bullish $200 target for NVDA reflects AI-sector optimism—similar tailwinds apply to GOOGL (AI integration in ads, cloud, and Gemini AI growth) 5.
Resistance levels and institutional liquidity zones align with this round-number target.
📈 Why GOOGL?
AI & Cloud Momentum: Google Cloud + Gemini AI adoption mirrors NVDA’s AI hype 15.
Technical Strength: Reclaimed 200-day SMA? Check for higher lows and sector leadership (like NVDA’s recent behavior) 314.
Fundamental Catalyst: Upcoming earnings or AI partnership announcements could fuel FOMO.
⚠️ Risk Management
Avoid news spikes: Earnings/regulatory news = volatility traps.
Scale out: Take partial profits at $190, let runners aim for $200.
💥 Pirate’s Bonus
Like/Boost if this plan helps! More heists incoming (TSLA? AAPL?). Stay tuned!
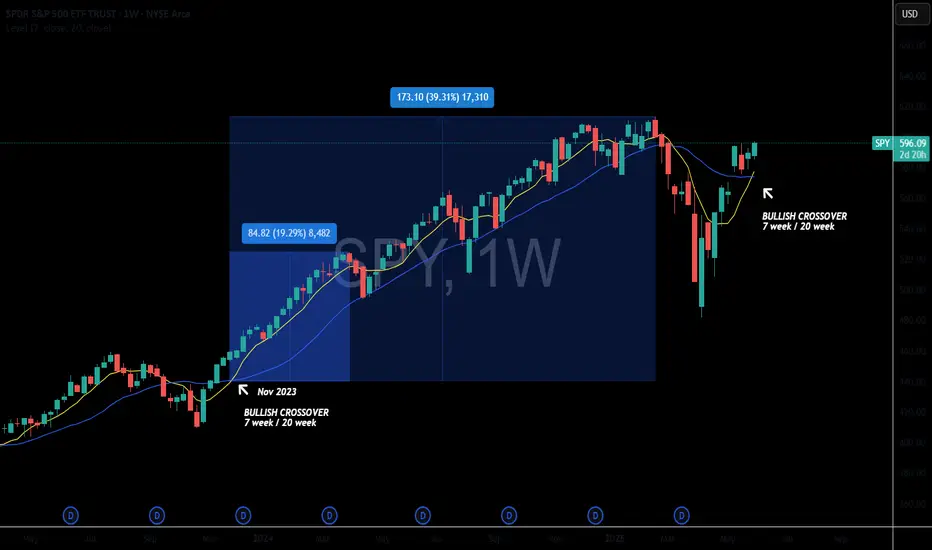
SPY New All Time Highs IncomingThe #SPY weekly chart is so bullish but don't take my word for it.
Simply look at the weekly bullish crossover that occurred between the 7 week & the 20 Week MA.
The last time this occurred was in Nov 2023 and the markets ripped 19% before having a major 3 week pullback and then another soaring continuation higher.
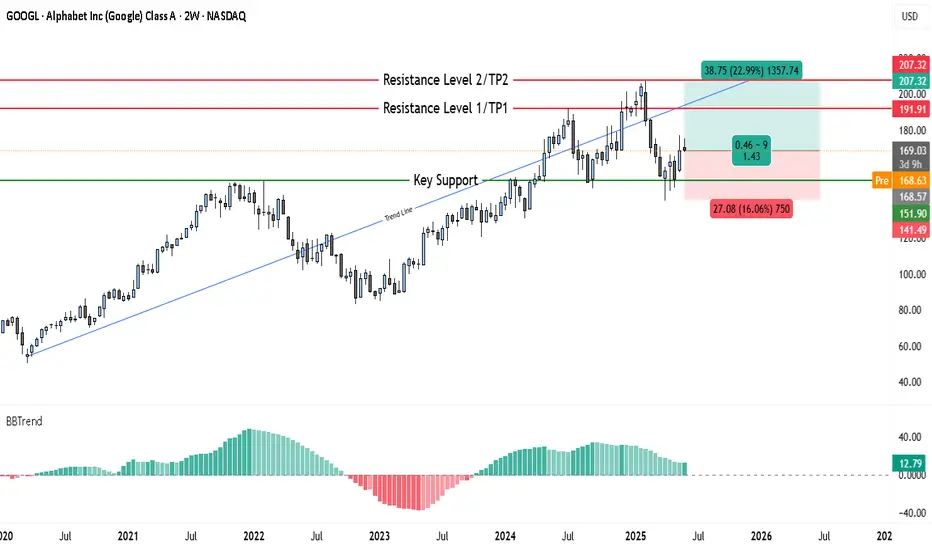
$141 Stop, $207 Target — Bullish Setup on GOOGL with 1.4RMarket Context
Alphabet Inc. (GOOGL) is showing renewed bullish momentum on the 2-week chart. After a healthy correction earlier in the year, price action is now turning decisively upward, reclaiming its long-term trendline and bouncing off a major support level. This setup suggests a shift in market sentiment from consolidation to breakout mode, with significant upside potential.
Key Technical Levels
• Key Support – $151.90
This zone has acted as a major demand level and was tested multiple times. The recent bounce from here reaffirms its strength and underscores the market’s willingness to buy dips at this level.
• Stop Loss – $141.49
Positioned just below the Key Support, this stop loss accounts for volatility while protecting against a full breakdown. A close below this level would invalidate the bullish thesis.
• Resistance Level 1 (TP1) – $191.91
This price level marks a prior swing high and represents the first bullish target.
• Resistance Level 2 (TP2) – $207.32
A clear breakout beyond TP1 sets up the path toward this higher resistance, which also aligns with historical supply from mid-2021.
• Trendline Reclaim
The multi-year ascending trendline, breached temporarily, has now been reclaimed with conviction — a strong bullish signal on higher timeframes.
Trade Setup
• Entry Zone: $168.00 – $169.00
• Take Profit 1 (TP1): $191.91 (approx. 14% upside)
• Take Profit 2 (TP2): $207.32 (approx. 23% upside)
• Stop Loss: $141.49 (just below Key Support)
• Risk–Reward Ratio: Approximately 1.43
Price Action & Trend Confirmation
After establishing a series of higher lows, GOOGL has rebounded from the $151.90 zone with strength, forming a bullish engulfing candle on the 2W chart. This move brought the price back above the long-term trendline — a textbook bullish signal when viewed on a macro timescale. The structure now favors trend continuation, especially if the price holds above the $168–$170 zone in the short term.
Risk Management and Strategy
The stop loss below $151.90 is deliberately placed at $141.49 to avoid premature exit from minor volatility. This level is safely beneath the most recent swing low and gives the trade breathing room to develop. A partial exit at TP1 locks in gains while preserving capital for the extended move to TP2, where major resistance could trigger broader market attention.
Conclusion
GOOGL is setting up for a high-probability breakout from a clean technical base. With the price respecting long-term support, reclaiming the trendline, and establishing bullish momentum, the path of least resistance is upward. The trade offers a solid reward-to-risk profile and aligns with institutional-style setups often seen prior to extended rallies.
In short: GOOGL looks ready to move, and this is a setup bulls won’t want to ignore.
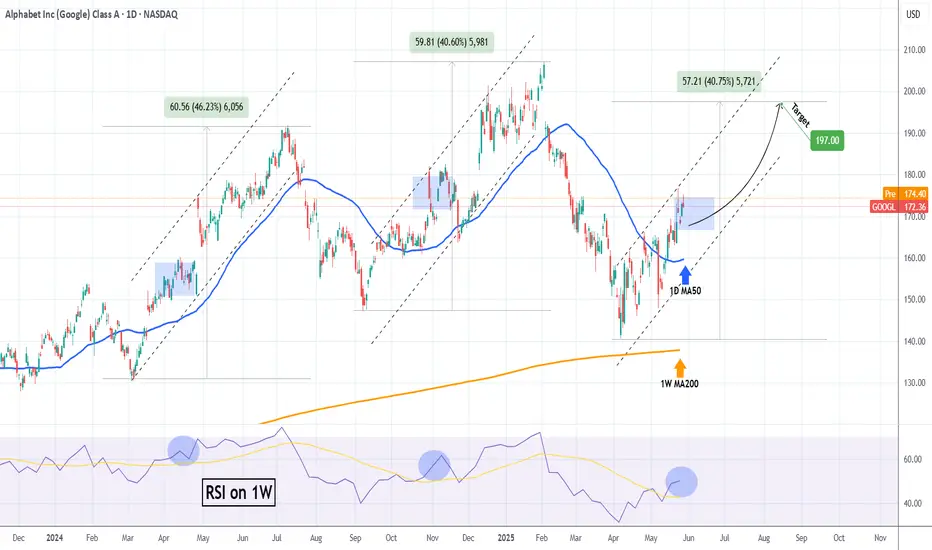
GOOGLE Repeating 2024 pattern and eyes $197.00Alphabet Inc. (GOOG) has established a Channel Up pattern since the (near) 1W MA200 (orange trend-line) rebound. With the 1D MA50 (blue trend-line) now acting as a Support, this pattern resembles the Channel Up formations that emerged in 2024.
Both in terms of 1W RSI and pure price action alike, we are in a similar consolidation level as November and April 2024. Both patterns peaked after similar rallies (+40.60% and +46.23% respectively), so the minimum Target we are expecting on the medium-term is $197.00.
-------------------------------------------------------------------------------
** Please LIKE 👍, FOLLOW ✅, SHARE 🙌 and COMMENT ✍ if you enjoy this idea! Also share your ideas and charts in the comments section below! This is best way to keep it relevant, support us, keep the content here free and allow the idea to reach as many people as possible. **
-------------------------------------------------------------------------------
💸💸💸💸💸💸
👇 👇 👇 👇 👇 👇
$GOOGL laggard long setupSimilar to my analysis on AAPL, I also think Google looks good for a long. I could see the possibility of a pullback down to support(s), but then that would setup a decent long up to $190+.
The structure looks like a bottom and many of the other Mag7 stocks have seen big runs, I think Google is likely a laggard and should move up to the resistances in the coming weeks.
A loss of the supports on the downside would invalidate the idea.
$GOOGL the pattern is there, target $152, short setup.NASDAQ:GOOGL You tell me. This looks so ready to go back below $150. My target is $152. I am entering puts right now with a strike price of $150 for 6/20 starting at $1.33 entry. I will add some on a push towards $167-$168. I will give up if it pushes through or holds at $170. This just looks to good TECHNICALLY in my opinion. I will keep you updated. I am willing to watch this position go down 65% where I will consider selling; looking at price and time to expiration. We are not out of the weeds yet when it comes to political rhetoric regarding tariffs even though this name shouldn't be affected by such because it is software, nothing physical but when the idea of tariffs are spewed the market as a whole reacts in negatively.
WSL.
$GOOGL - $185 Calls - September 19, 2025Trend line strategy with entry after bounce and take profits at fib levels - 176, 192, 206

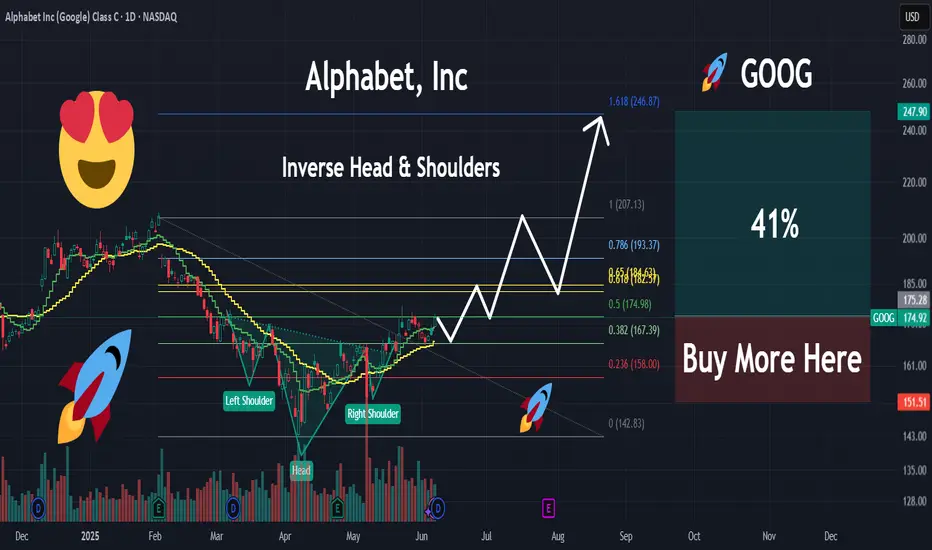
Google primed for a 20% move!NASDAQ:GOOG NASDAQ:GOOGL looks COILED! 🚀
Currently retesting Inverse H&S breakout and H5_S Indicator here.
Bounce will lead us too...🎯$176.52📏$200.16
- Volume shelf launch
- Bullish WR%
- Bullish weekly uptrend
- Severely undervalued
