GOOGLE BUY (ALPHABET INC)Hi there.
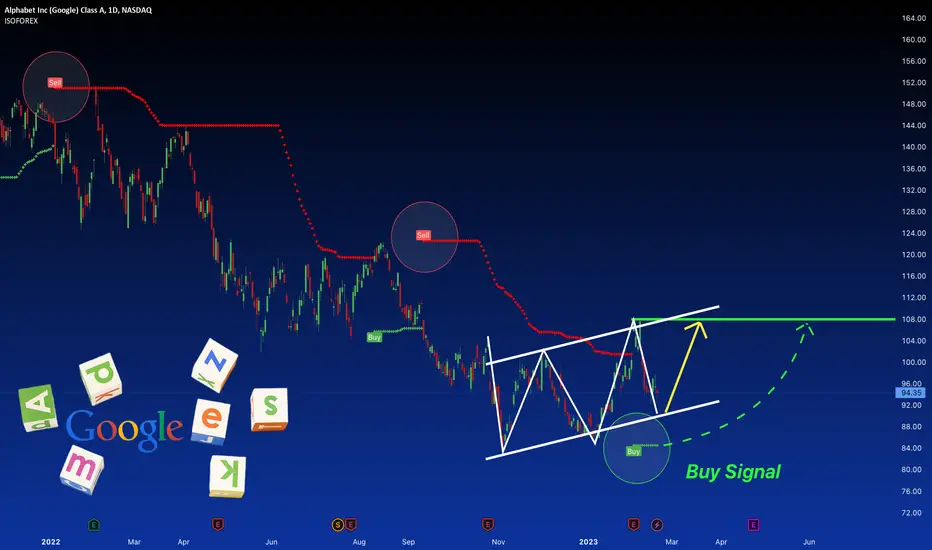
Price is forming a continuation pattern to the upside.
Wait for the price to complete the pattern and watch strong price action for buy.
GOOGL
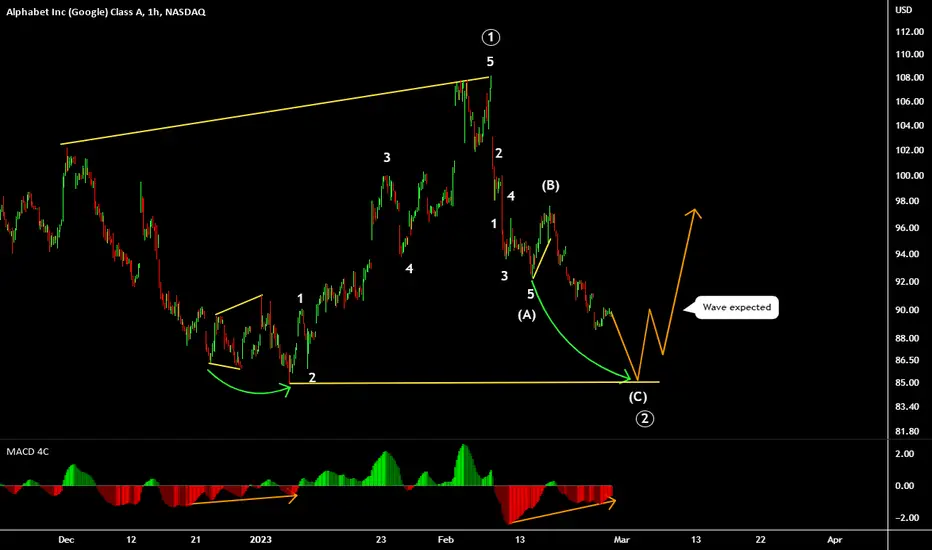
Elliott Wave View: Alphabet ($GOOGL) May Find Support SoonAlphabet (GOOGL) cycle from 1.6.2023 low ended as a 5 waves impulse with wave ((1)) at $107.85. Pullback in wave ((2)) is in progress as a zigzag Elliott Wave structure. Down from wave ((1)), wave (A) ended at 100.87 and wave (B) ended at 108.18. Wave (C) is currently ongoing with subdivision as an impulse structure. Down from wave (B), wave 1 ended at 92.26 and wave 2 rally ended at 97.68. The 30 minutes chart below shows the starting point of wave 2 as the invalidation level.
Down from wave 2, wave ((i)) ended at 96.26 and rally in wave ((ii)) ended at 97.06. Stock extends lower in wave ((iii)) towards 89.76 and rally in wave ((iv)) ended at 91.16. Final leg lower wave ((v)) ended at 88.58 which completed wave 3. Rally in wave 4 is in progress to correct cycle from 2.17.2023 high as a zigzag structure. Up from wave 3, wave ((a)) ended at 90.26 and dips in wave ((b)) ended at 89.33. Wave ((c)) higher is expected to reach 91.06 – 92.12 area where wave 4 should end. Afterwards, stock should resume lower in a marginal wave 5 to complete wave (C) and ((2)) before it turns higher. As long as the low on 10.31.2022 low holds at 83.34, the pullback should find support for extension higher or rally in 3 waves.

GOOGL:Fundamental Analysis + Possible Next Target Warren Buffett is an expert at capturing the attention of Wall Street analysts and investors. This could be attributed to the more than 3,800,000% cumulative return he has generated to his company's Class A stock (BRK.A) since taking over as CEO in the 1960s.
His stellar investment track record has enabled new and repeat investors to follow him for decades and achieve substantial returns. This is ultimately what makes Berkshire Hathaway's Form 13F filing such a highly anticipated event.
Many people who follow Berkshire Hathaway's buying and selling are presumably aware that Apple is the company's largest holding. Apple accounted for 41% of Berkshire's $342 billion in invested assets a week earlier. Apple was also one of three stocks added by Buffett and his investing team during the fourth quarter.
Similarly, Amazon has been a Berkshire Hathaway holding for the past four years (since Q1 of 2019). Oracle's prior remarks from Omaha imply that he was not the architect behind the takeover of the world's largest e-commerce company. Rather, one of his investment lieutenants, Todd Combs or Ted Weschler, was responsible for the $1.06 billion holding in Amazon.
Buffett was only indirectly familiar with the other three FAANGs - Meta, Netflix, and Alphabet - before Berkshire Hathaway and New England Asset Management released its current 13F reports. The situation has now altered.
In the fourth quarter, New England Asset Management purchased 17,100 Alphabet shares, primarily Class A shares (GOOGL).
The straightforward answer to the question "Why Alphabet?" is based on three factors: market share, cash flow, and valuation.
Let us begin with the reality that Alphabet has a complete monopoly on Internet search. Since December 2018, Google has accounted for at least 91% of global search share, according to GlobalStats. Although ad spending cycles, Google's almost 90 percentage point dominance over its nearest competitor provides it unparalleled pricing power when working with advertisers. Given how the US and worldwide economies have developed over time, Alphabet, fuelled by advertising, is the clear winner.
Second, Alphabet is a money generator, allowing it to actively reinvest in a wide range of high-growth activities. The corporation generated $91.5 billion in operating cash flow in 2022. This massive cash flow allows the corporation to expand the scope of its Google Cloud infrastructure service, which has taken almost 10% of the world's cloud infrastructure market, according to a recent Canalys analysis.
Furthermore, Google's extraordinary cash flow, along with $99 billion in net cash, cash equivalents, and marketable Alphabet securities, allows the corporation to reinvest in the streaming channel YouTube, which is the world's second most visited social site. Alphabet is currently experimenting with new ways to monetize short videos known as YouTube Shorts. Every day, more than 50 billion "shorts" are viewed!
Third, Alphabet has historically been cheap in terms of both future revenue potential and cash flow. Despite a five-year average price-to-earnings ratio of 25.4, the company is now valued at 15.5 times Wall Street's predicted earnings for next year.
Furthermore, Alphabet has averaged 18.6 times year-end cash flow over the last five years. Investors may buy Google shares right now for just 6.5 times the company's estimated cash flow in 2026, according to Wall Street's most forward-looking projection.
In other words, Alphabet satisfies all of Buffett's investment criteria.
Google - Bearish SentimentI still expect price to take out the EQUAL HIGHS at 107.88 and also fill the bearish gap. All the liquidity sitting there must be swept right up to 111.50 (order block).
Price has now taken out the liquidity at the 94.00 region.
--------------------------------------------------------------------------------------------------------------
Patience, price action and risk management pay in the markets!!!

Good time to start buying GOOGLEYou know all the teck stocks are rebounding hard, and Google was about to rebound as well; but Google's unsatisfactory debut of AI Bard became a good source for panic sell.
This kind of stuff is temporary, and the macro trend will override the micro(temporary) trend.
Thus, this temporary dump or retrace is actually really a good chance to buy in.
If you really like Google and believe that Google will continue to do well in 3~5 years, you should definitely dive in.
Good entry price will be around $95~$84.
You will enjoy at least +30% profit within 2023.
That's not crazy profit, but yeah that's a solid profit.
Disclaimer: Even though this is a good chance, I believe crypto will give me better profit; so I am not buying any Google.

$msft weekly close Microsoft (MSFT) had a great start this week with the announcement of its new AI partnership with OpenAI, as well as some positive signals from its double bottom pattern. However, by the end of the week, MSFT seemed to be losing momentum and experienced a pullback to its support level. The question now is, will it be able to hold or will it falter?

GOOGLE PROJECTION 2023-2024 We see Google bullish until 140s after that area of exit.
Next entry 50-40 long terms.

$GOOGL OverreactionThis situation is quite silly. The media is blowing it out of proportion and believes OpenAi is the second coming of Jesus. Google has 91% market share of Search, and Bing has about 2% share. Microsoft, part owner of OpenAi, plans to grow their search efforts and compete with Google search. The threat is that Bing may take a couple percent. In reality, people won't be switching their browsers where they have their passwords, addresses, bookmarks, email account, extensions, payments, and more saved over an implementation of ChatGPT, which they can just use separately from search.
Remember, people hate change, especially when it ruins convenience. ChatGPT is cool, and I've been playing with it since December, it has plenty of it's own problems. No one has invested more in Ai then Google.
As far as the trade goes. Any buys at this level are a good entry. $85-$90 even better.

Google - Bearish SentimentPrice broke structure at 100.29 to create equal highs at 107.84. Then price gave us a BEARISH GAP to take out ORDERS at 102.09. The BEARISH GAP that was created must be filled before price can drop significantly.
I expect price to fill the BEARISH GAP and take out the EQUAL HIGHS at 107.84. The 113 price point is where price will go. From there a major dip will happen. This will take out the ENGINEERED LIQUIDITY ($).
I am EXTREMELY BEARISH on Google!!!
---------------------------------------------------------------------------------------------------------------
Price action is KING!!

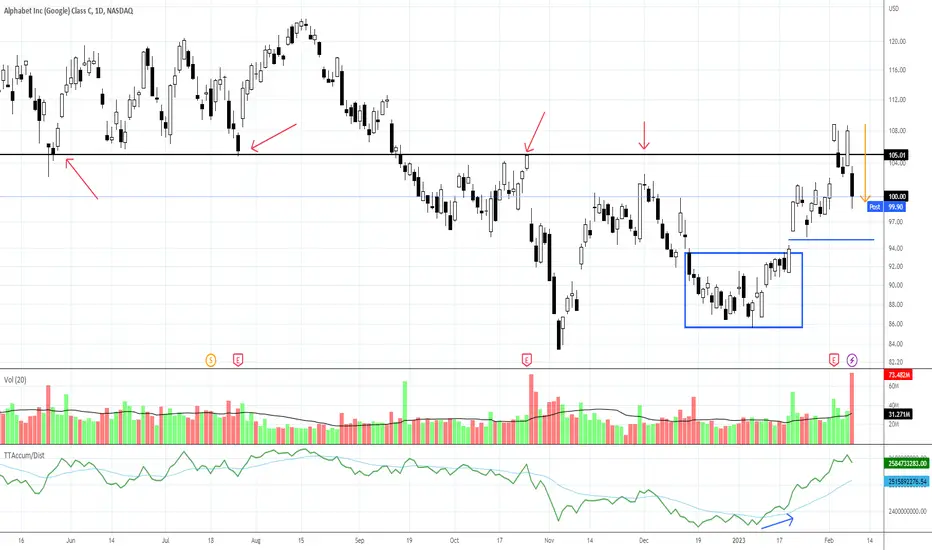
GOOG: Bottom Completion FailureGOOG shows a failure to complete a bottom. The stock moved up and above the resistance level that needs to sustain to complete its bottom, but it failed to sustain the gains.
This stock was part of the last New Tech Virtual Course I did, since it is developing several new technologies for its own use and to sell to other companies. AI is the big competition area right now, so GOOG may see added volatility this year as the market reacts to AI feature releases, as it did today.
But the support range at the lows of this bottom formation is strong due to a Dark Pool Buy Zone that has been consistent.
GOOG Alphabet Options Ahead of Earnings | Last Quarter of GrowthAs you can see, the last chart was pretty accurate:
Now I think this year we will see Google losing ground in the advertising industry.
The Justice Department filed an antitrust lawsuit Tuesday against Google alleging the company of abusing its dominance over smaller rivals by operating like an illegal monopoly.
MSFT Microsoft bought a 49% stake in OpenAI, who owns CHatGPT, that ca really be a rival to Google in answering questions.
As a matter of fact i am using ChatGPT more than Google search right now.
So i believe this is the last quarter of growth for GOOG / GOOGL, as you can see in the chat, because Q4 was not impacted by ChatGPT so much.
Looking at the GOOG Alphabet options chain ahead of earnings , I would buy the $100 strike price Calls with
2023-2-10 expiration date for about
$2.66 premium.
If the options turn out to be profitable Before the earnings release, I would sell at least 50%.
Looking forward to read your opinion about it.

Not Much Meat Left On the Bone for GOOGL HereDirectly in the supply zone, earnings and guidance were blah...
Cost-cutting not enough for investors at the moment..
Investors unsure of macro-outlook in coming months...
Not a buyer here personally..

GOOGL Potential for Bullish Continuation | 3rd February 2023Looking at the H4 chart, my overall bias for GOOGL is bullish due to the current price being above the Ichimoku cloud, indicating a bullish market.
Looking for a pullback buy entry at 101.12, where the 23.6% Fibonacci line is. Stop loss will be at 84.87, where the previous swing low is. Take profit will be at 122.41, where the previous swing high is.
Any opinions, news, research, analyses, prices, other information, or links to third-party sites contained on this website are provided on an "as-is" basis, as general market commentary, and do not constitute investment advice. The market commentary has not been prepared in accordance with legal requirements designed to promote the independence of investment research, and it is therefore not subject to any prohibition on dealing ahead of dissemination. Although this commentary is not produced by an independent source, FXCM takes all sufficient steps to eliminate or prevent any conflicts of interest arising out of the production and dissemination of this communication. The employees of FXCM commit to acting in the clients' best interests and represent their views without misleading, deceiving, or otherwise impairing the clients' ability to make informed investment decisions. For more information about the FXCM's internal organizational and administrative arrangements for the prevention of conflicts, please refer to the Firms' Managing Conflicts Policy. Please ensure that you read and understand our Full Disclaimer and Liability provision concerning the foregoing Information, which can be accessed on the website.

Google Earnings tomorrow. Google is near resistance but could push up a bit to tage and test the breakout trendline.
The Fear and Greed index has now been trading in the fear side for 2 weeks.
Usually prolonged trading in the Fear range foreshadows a near term downward pressure. What makes this intersting is the Fear index range was just tagged on the monthly & Daily time frame.
HaresWith elevated rates it's an unattractive path forward in lieu of a squeezed blow off.
Real value in the gray band
source: FASTgraphs
Google Analysis 22.01.2023Hello Traders,
welcome to this free and educational analysis.
I am going to explain where I think this asset is going to go over the next few days and weeks and where I would look for trading opportunities.
If you have any questions or suggestions which asset I should analyse tomorrow, please leave a comment below.
I will personally reply to every single comment!
If you enjoyed this analysis, I would definitely appreciate it, if you smash that like button and maybe consider following my channel.
Thank you for watching and I will see you tomorrow!

Tough Days for Google StockGoogle stock have 2 scenario for daily time frame
1. If goes above $100 and reach $103~$105, after some consolidation reach above levels.
2. If it is not able to cross $102 zone, $95~$93.6 will be the first support zone.

GOOGL Potential for Bearish Continuation| 13th January 2023Looking at the H4 chart, my overall bias for GOOGL is bearish due to the current price being below the Ichimoku cloud, indicating a bearish market. Looking for a sell entry at 91.61, where the 38.2% Fibonacci line is. Stop loss will be at 99.53, where the minor high and 78.6% Fibonacci line is.
Any opinions, news, research, analyses, prices, other information, or links to third-party sites contained on this website are provided on an "as-is" basis, as general market commentary, and do not constitute investment advice. The market commentary has not been prepared in accordance with legal requirements designed to promote the independence of investment research, and it is therefore not subject to any prohibition on dealing ahead of dissemination. Although this commentary is not produced by an independent source, FXCM takes all sufficient steps to eliminate or prevent any conflicts of interest arising out of the production and dissemination of this communication. The employees of FXCM commit to acting in the clients' best interests and represent their views without misleading, deceiving, or otherwise impairing the clients' ability to make informed investment decisions. For more information about the FXCM's internal organizational and administrative arrangements for the prevention of conflicts, please refer to the Firms' Managing Conflicts Policy. Please ensure that you read and understand our Full Disclaimer and Liability provision concerning the foregoing Information, which can be accessed on the website.

Google WXY Pattern Targeting A $74 TestIn this update we review the recent price action in Google and identify the next high probability trading opportunities and price objectives to target

$GOOG CONSOLIDATIONThere’s a few possibilities for GOOG here:
1. Forming a consolidating Pennant/Flag
or
2. Forming a Double bottom

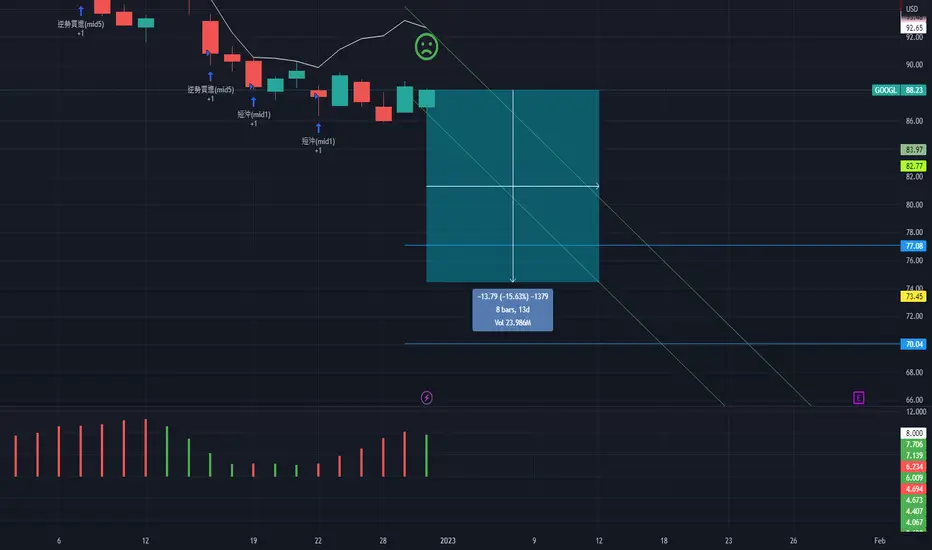
GOOGL, 8d/-15.63%falling cycle -15.63% in 8 days.
==================================================================================================================================================================
This data is analyzed by robots. Analyze historical trends based on The Adam Theory of Markets (20 moving averages/60 moving averages/120 moving averages/240 moving averages) and estimate the trend in the next 10 days. The white line is the robot's expected price, and the upper and lower horizontal line stop loss and stop profit prices have no financial basis. The results are for reference only.
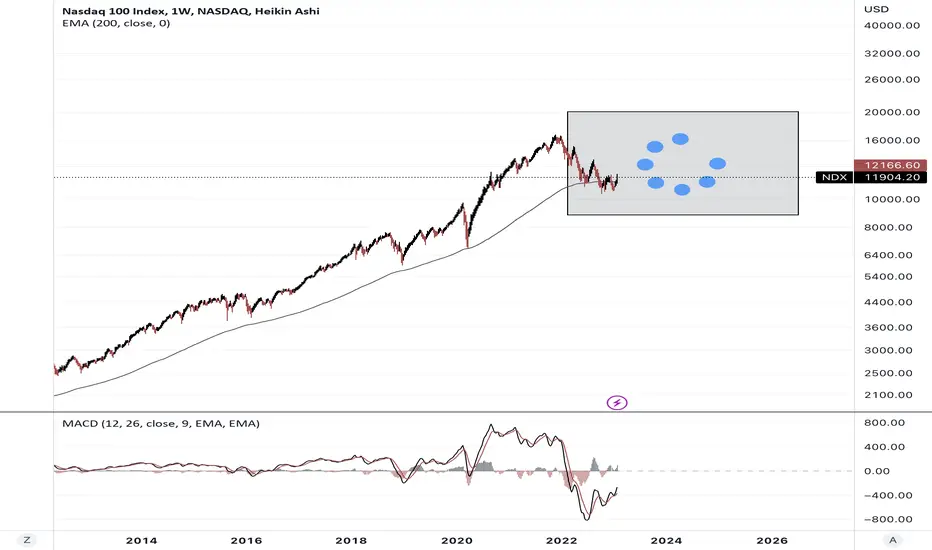
I am still Googling A Trend Following Setup!💻Hello TradingView Family / Fellow Traders. This is Richard, as known as theSignalyst.
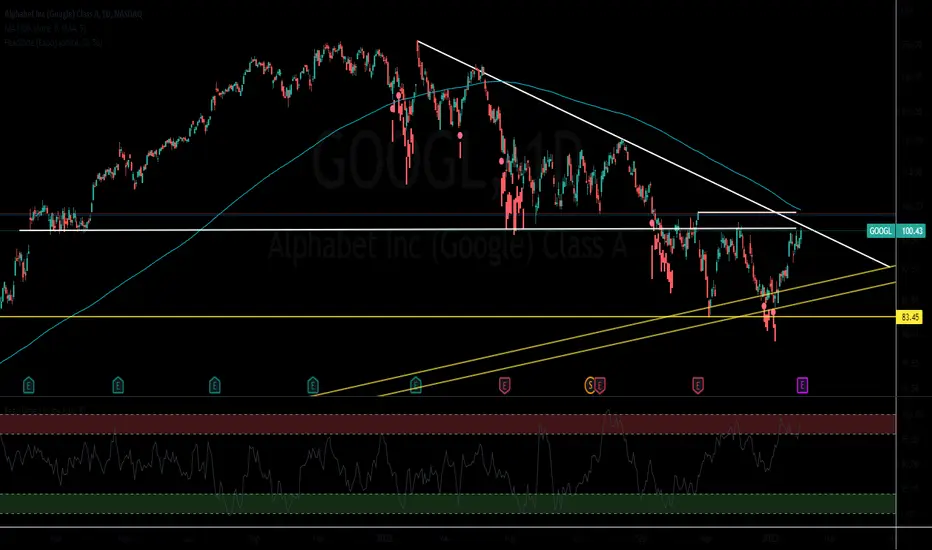
🗒 GOOGL has been overall bearish from a medium-term perspective trading inside our red channel. However, it is currently approaching the lower blue trendline acting as a non-horizontal support.
Moreover, the zone 70.0 - 77.0 is a strong support and demand zone .
📌 So the highlighted purple circle is a strong area to look for buy setups as it is the intersection of the green demand zone , lower trendline in blue acting as support, and lower trendline in red acting as an oversold area. What I call a TRIO retest!
📉 As per my trading style:
As GOOGL approaches the lower purple circle zone, I will be looking for bullish reversal setups (like a double bottom pattern, trendline break , and so on...)
Always follow your trading plan regarding entry, risk management, and trade management.
Good luck!
All Strategies Are Good; If Managed Properly!
~Rich

