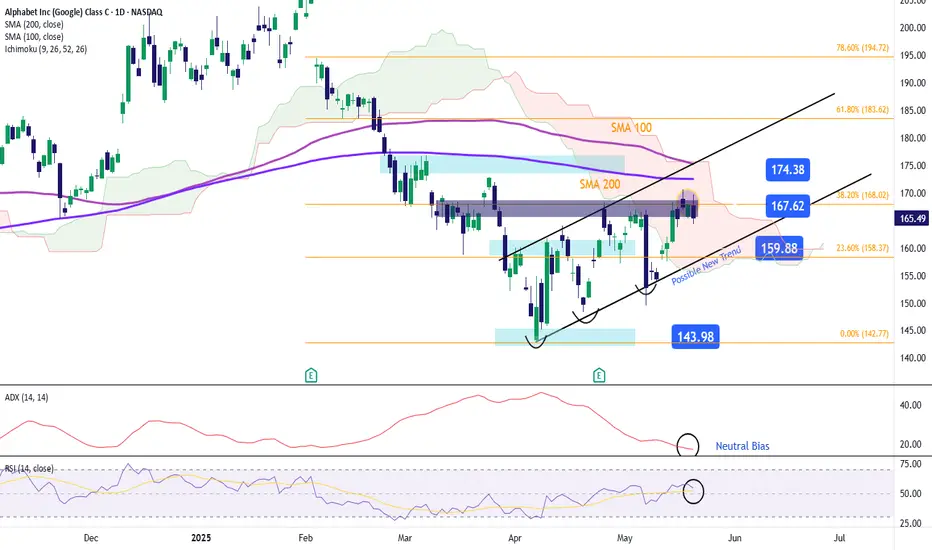
Alphabet Stock Maintains a Consistent Upward ChannelOver the past five trading sessions, Alphabet's (Google) stock has managed to sustain a moderate bullish bias, with a gain of over 4%, as the price has settled around the $170 level. So far, the stock has avoided significant pullbacks amid recent announcements of new integrations and advancements in artificial intelligence within the Google ecosystem.
On one hand, the company announced the integration of AI into its search engine, powered by its Gemini model, along with the introduction of a new “Agent Mode”—a feature that allows users to delegate complex tasks for the AI to handle autonomously. These announcements have been well received by the market, as they reinforce Alphabet’s commitment to innovation and maintaining a strong user base. If these new projects generate solid value, they could be crucial in sustaining buying pressure on the stock.
Bullish Channel Remains Intact
Since April 7, a consistent ascending channel has been forming in the stock’s price action. So far, recent bearish corrections have been insufficient to reverse the overall short-term trend. As long as the stock stays above the $170 level, the bullish bias is likely to remain intact, potentially extending the duration of the current upward structure.
ADX
The ADX line has shown a notable decline, approaching the neutral 20 level. This suggests that recent price movements are losing directional strength, possibly due to the price facing a nearby resistance zone.
RSI
The RSI remains above the neutral 50 level, indicating that buying momentum still dominates in the short term.
Key Levels:
$170: Current barrier, coinciding with a zone of indecision observed over the past several weeks. Sustained bullish moves above this level could reinforce buying sentiment and strengthen the current upward channel.
$175: Distant resistance aligned with the 100- and 200-period moving averages. A breakout above this area could lead to a steeper and stronger short-term uptrend.
$160: Nearby support, marking the lower boundary of the ascending channel. A break below this level could jeopardize the existing bullish formation.
Written by Julian Pineda, CFA – Market Analyst
GOOGL
Stock Market Forecast | TSLA NVDA AAPL AMZN META MSFTStock Market Forecast | CME_MINI:NQ1! NASDAQ:QQQ AMEX:SPY CME_MINI:ES1!
Mag 7 Forecast | TSLA NVDA AAPL AMZN META MSFT GOOGL

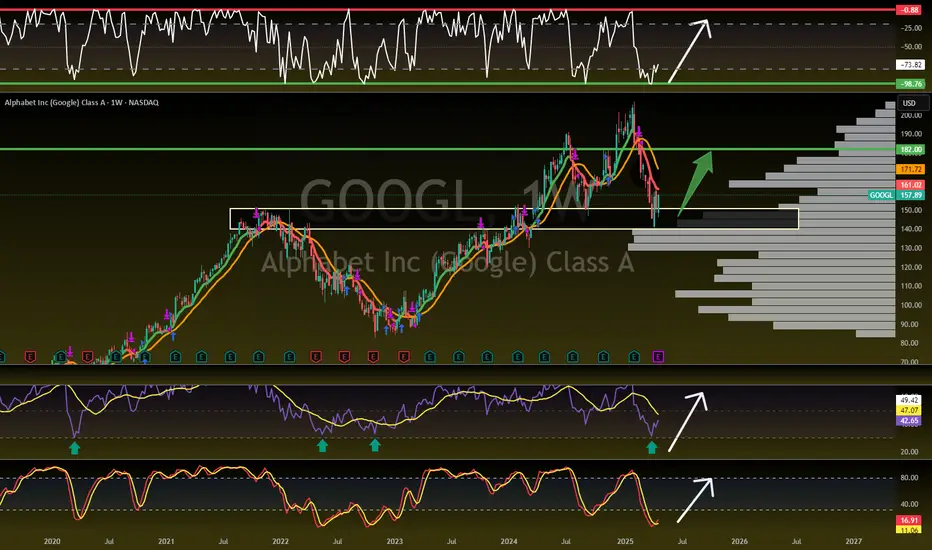
Google to $200!NASDAQ:GOOG NASDAQ:GOOGL
We are uptrending back to ATHs on Google here after they have lagged this whole rally and are the CHEAPEST MAG 7 STOCK!
- Volume shelf launch
- Rising Wr%
- Bouncing off key S/R zone
- H5 Indicator is about to flip to green and make a bullish cross
- Volume is climbing
- Bullish engulfing candle
- Daily looks great as well
Target is $200

$GOOG Trade Alert! 20% Upside🚨 H5 Trade Alert: NASDAQ:GOOGL NASDAQ:GOOG
PT: $176.52 🎯
MM: $200 📏 by July 29th ⏲️
- Green H5 Indicator
- Inverse H&S Breakout
- Volume Shelf Launch
- Increasing Volume
- Lagging Rally
- Cheapest MAG7
- Weekly Trend Rising
Not financial advice

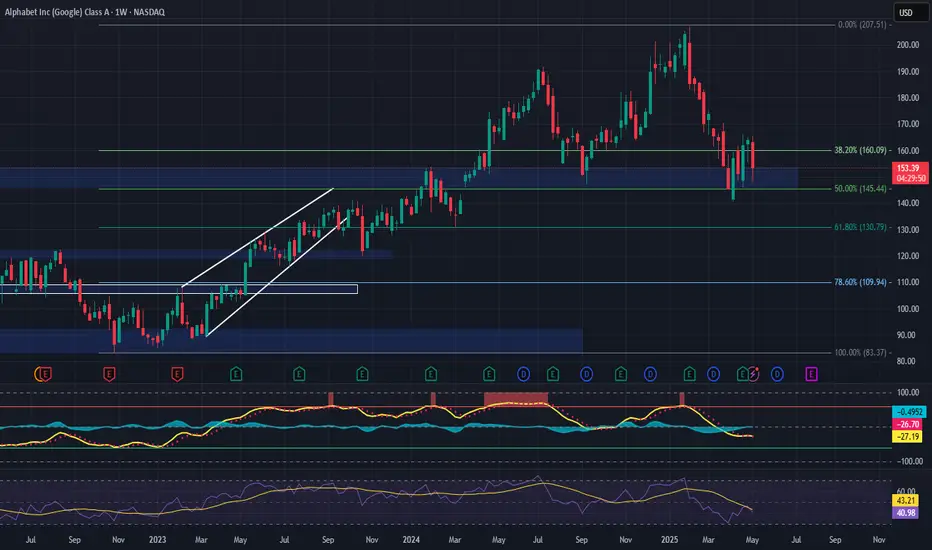
GOOGL (Alphabet Inc.) – Medium-Term Position Trade SetupNASDAQ:GOOGL is showing strength as it revisits its previous all-time high, now aligning with the 50% Fibonacci retracement of the current wave. The price action suggests a bullish flip of resistance into support at the $153 zone, with clear signs of buyer defense—offering a compelling medium-term opportunity.
🔹 Entry Zone:
Around $153 (support zone)
🎯 Take Profit Targets:
🥇 $200
🥈 $230
🛑 Stop Loss:
Weekly close below $130
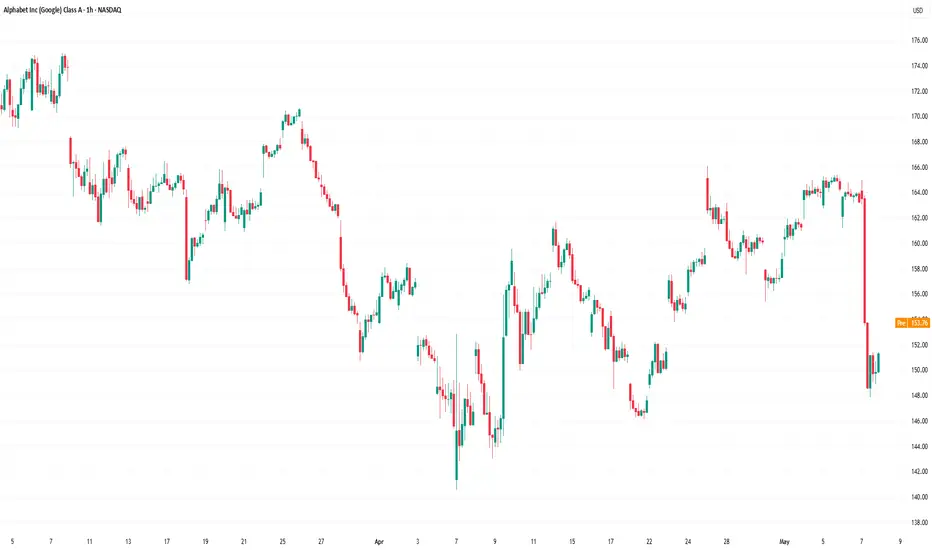
Alphabet (GOOGL) Shares Drop Over 7% in a Single DayAlphabet (GOOGL) Shares Drop Over 7% in a Single Day
According to the Alphabet (GOOGL) stock chart, yesterday’s main trading session opened around $163.70 but then saw a sharp decline, hitting an intraday low of approximately $148 per share. By the close, bulls managed to recover only a small portion of the losses. As a result, Alphabet (GOOGL) shares fell by more than 7% during the session – marking the worst performance among the S&P 500 constituents (US SPX 500 mini on FXOpen).
Why Did GOOGL Shares Fall?
The drop followed remarks by Eddy Cue, Apple’s Senior Vice President of Internet Software and Services, who:
→ noted a decline in search traffic on Safari;
→ revealed plans to expand Safari’s search capabilities using artificial intelligence.
These developments heightened concerns over Google’s dominance in search and its advertising revenue. According to media reports, analysts are warning of rising competition from AI-powered search platforms such as OpenAI, Grok, and Perplexity.
Technical Analysis of Alphabet (GOOGL) Shares
In our 23 April analysis, we identified a descending price channel and emphasised the psychological significance of the $150 level, which had served as a key support in 2024.
Since then, bulls showed confidence by pushing the price above the red channel. In addition, the chart has begun to outline a potential ascending trend channel (marked in blue).
However, yesterday’s statement from competitors shifts the outlook. The current GOOGL stock price is positioned at the lower boundary of the blue channel – which could act as support, reinforced by the psychological $150 level.
On the other hand, a bearish breakout below this area may revive the downtrend that began in February, potentially paving the way for a test of this year’s lows.
This article represents the opinion of the Companies operating under the FXOpen brand only. It is not to be construed as an offer, solicitation, or recommendation with respect to products and services provided by the Companies operating under the FXOpen brand, nor is it to be considered financial advice.
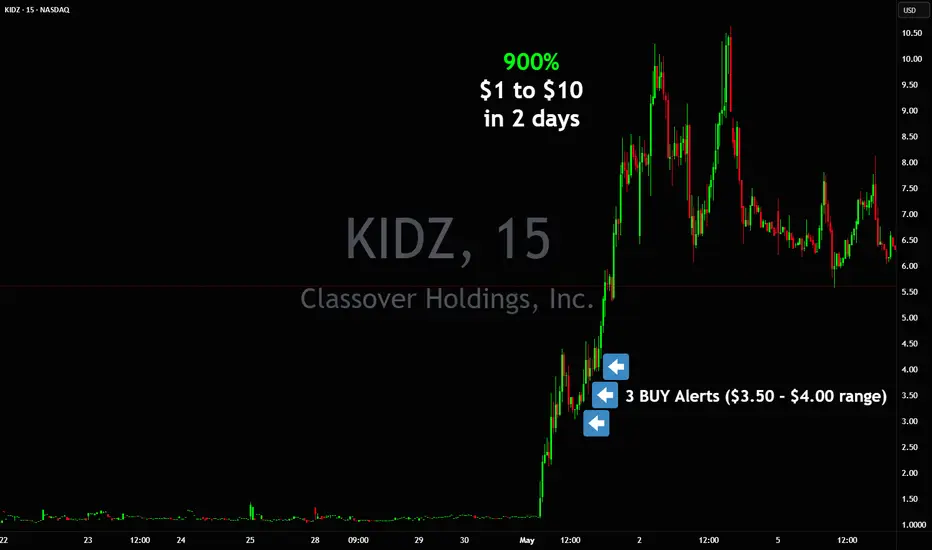
From $1 to $10 doing 900% in 2 days $KIDZ💣💥 $1 to $10+ in 2 days +900% NASDAQ:KIDZ similar to AMEX:GPUS
Shortsellers attempted similar tricks during the day and got squeezed the same way on both 🤣 making us awesome gains along the way
Please 🐻 attempt to do it again on next setups.
3 Buy Alerts in $3.50 - $4.00 range more than enough money made into vertical to $10+
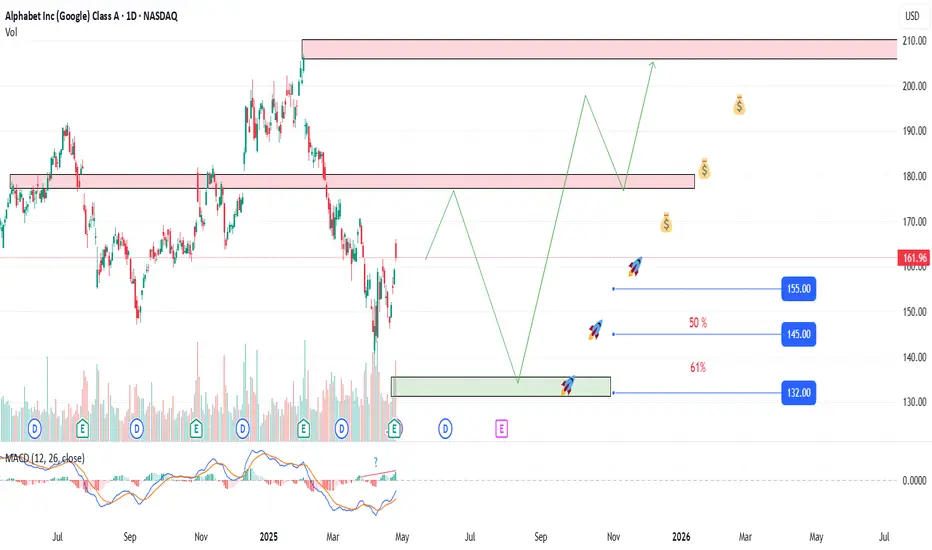
GOOGL Alphabet Inc (Google) Opportunity After the Breakout?The stock's recent breakout from a descending channel pattern indicates potential for continued upward momentum. Monitoring the $155 support level is crucial, as a drop below may signal a trend reversal.
📊 Technical Analysis
Current Price: $161.96
52-Week Range: $140.53 – $207.05
Recent Breakout: Surpassed descending channel resistance
Key Support: $155
🎯 Entry Points:
$158 (ideal pullback)
$155 (support confirmation)
$145-132 (aggressive long-term entry)
📈 Targets:
First target: $168
Second target: $182
Third target: $196+
Disclaimer:
This analysis is for educational and informational purposes only and should not be considered financial advice. Always do your own research before making any investment decisions.
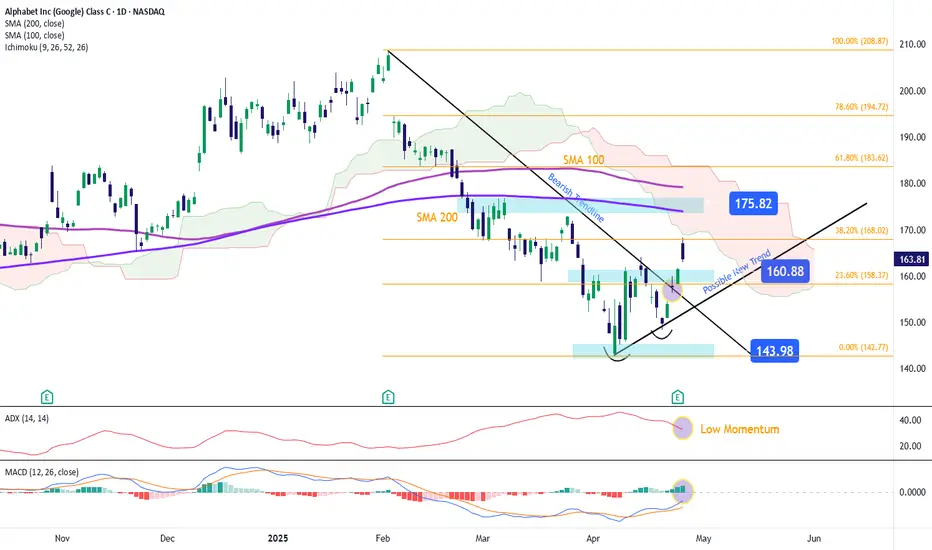
Google stock oscillates below $170 after earnings releaseGoogle's stock managed to post a bullish gap of more than 3% in the last session, shortly after the company announced its quarterly results. Initially, it was reported that total sales for the last published quarter reached $90.23 billion, compared to the expected $89.12 billion. In addition, the company posted earnings per share of $2.81, beating expectations of $2.00. This positive outcome initially triggered a spike in investor confidence, but for now, the market sentiment has stabilized, and the stock is closing the week with a bearish candlestick on the chart.
Previous trendline break:
The recent consistent bullish movements in Google have been important in breaking a downward trendline that was previously dominant on the chart. For now, this has paved the way for a new bullish bias, and a new upward trendline could be forming, potentially becoming the most relevant technical structure for the stock in the coming sessions. However, it is important to note that this early bullish trendline still requires new price highs to confirm its strength.
ADX:
Although ADX oscillations remain above the neutral 20 level, the slope of the line has started to turn negative. This suggests that, despite the positive earnings, volatility may be beginning to decline, which could eventually lead to a sideways bias in the stock’s movements in the short term.
MACD:
The MACD histogram continues to show oscillations above the neutral 0 line, but it is becoming increasingly necessary for this to be sustained to confirm the buying strength reflected in the moving averages. If the MACD starts to decline, it could be interpreted as a bearish correction signal that may weigh on Google's price.
Key Levels:
$175: A relevant resistance aligned with the 100- and 200-period moving averages. Buying oscillations reaching this level could reactivate bullish momentum and give way to a new relevant uptrend.
$160: A nearby support zone aligned with the 23.6% Fibonacci retracement level. It could serve as a tentative barrier where potential short-term downside corrections might occur.
$143: A definitive support that coincides with the recent lows of the stock. A pullback toward this level could reactivate the previous bearish trend in this market.
Written by Julian Pineda, CFA – Market Analyst
$GOOGL primed for a BIG MOVE!NASDAQ:GOOGL primed for a BIG MOVE! 🚀
Heading into earnings, this stock’s valuation has been overlooked—but strong results could flip the narrative fast! 💨
✅ Bounced off 2021 highs
✅ RSI at its lowest since COVID
✅ Major indicators curling upward
✅ Volume shelf launch incoming
✅ Wr% pendulum swinging
Momentum is building—are you ready? 👀
Not financial advice
GOOGL: A Resilient Bounce Sets Up the Next WaveGOOGL DAILY TECHNICAL ANALYSIS 📊
OVERALL TREND
📈 UPTREND — Price has rebounded off the April low with increasing bullish pressure, now holding above key short-term moving averages. A potential trend reversal is underway if momentum sustains above 155.
📉RESISTANCE ZONE
🔴 207.05 — PIVOT HIGH | SELL STOPLOSS
🔴 203.76 — SELL ORDER II
🔴 197.10 — SELL ORDER I
🎯ENTRIES & TARGETS
🟢 193.74 — EXIT BUY & TP 4
🟢 181.64 — BUY ORDER & TP 3
🟢 173.79 — BUY ORDER & TP 2
🟢 140.53 — BUY ORDER & TP 1
📈SUPPORT ZONES
🟢 150.92 — BUY ORDER 1
🟢 143.85 — BUY ORDER 2
🟢 207.05 — BUY STOPLOSS | PIVOT LOW
📈MOVING AVERAGE SUMMARY
✅ Short-Term MAs (10–50) — Bullish crossover confirmed, supporting upside
⚠️ Mid-Term MAs (100) — Still bearish, price must sustain above 156.70
🔴 Long-Term MAs (200) — Bearish, still weighing on broader structure
✍️STRUCTURAL NOTES
Price recently flipped bullish across 10–50 SMA/EMA clusters
Volume confirming strength, but needs follow-through above 162.48
Stochastic RSI (95.93) is overheated — expect short-term pullback or consolidation
MACD, Momentum, and AO all signal increasing buy-side control
Ichimoku Base Line (153.25) being tested — reclaiming it is bullish confirmation
TRADE OUTLOOK 🔎
📈 Bullish bias holds above 150.92 and especially above 155.63
🎯 Upside targets: 162.48 → 173.79 → 181.64
📉 Short-term rejection possible near TP1 — RSI and StochRSI nearing exhaustion
👀 Watch for a decisive break above 162.48 with volume for continuation
🧪STRATEGY RECOMMENDATION
CONSERVATIVE (Trend-Following):
— Buy Entry: 155.63
— TP Levels: 162.48 / 173.79 / 181.64
— SL: Below 150.92
HIGH-RISK SCALP (Momentum Pullback):
— Buy Dip: 150.92 or 143.85
— TP: 155.63 / 162.48
— SL: Below 140.35
“Discipline | Consistency | PAY-tience”

Alphabet (GOOGL) Shares Hover Near Psychological LevelAlphabet (GOOGL) Shares Hover Near Psychological Level Ahead of Earnings Report
On 31 March, we noted that bearish sentiment could push Alphabet’s (GOOGL) share price towards the psychological level of $150. As the current price chart suggests, GOOGL is now trading close to that very level.
Moreover, the price is approximately equidistant from the recent highs and lows (marked A and B), which may be interpreted as a sign of balanced supply and demand — and a wait-and-see stance from market participants ahead of Alphabet’s Q1 earnings release (scheduled for tomorrow, 24 April).
Awaiting the GOOGL Earnings Report
With the Nasdaq 100 index (US Tech 100 mini on FXOpen) having fallen by around 13.5% since the beginning of the year, investors are approaching tech earnings with caution. According to Barron’s, three key themes are expected to dominate the narrative:
→ management forecasts amid continued uncertainty around the White House’s tariff policy;
→ plans for major capital investment in AI-related infrastructure;
→ signs of softening consumer demand.
Given the current climate of uncertainty, Alphabet’s earnings report could prove particularly influential — serving as a benchmark for shaping market expectations ahead of other major tech company reports.
Technical Analysis of Alphabet (GOOGL)
The $150 level has served as key support throughout 2024, and over the coming days it may act as a springboard for a new price movement, potentially driven by the earnings results.
From a bearish perspective, the market remains in a downward trend (indicated in red) following a breakout below the lower boundary of a previously active rising channel (marked in purple) that had held since last autumn. However, if Alphabet’s management maintains an upbeat outlook for 2025, this could give the bulls the confidence to challenge the upper limit of the red channel.
This article represents the opinion of the Companies operating under the FXOpen brand only. It is not to be construed as an offer, solicitation, or recommendation with respect to products and services provided by the Companies operating under the FXOpen brand, nor is it to be considered financial advice.

GOOG Alphabet Options Ahead of EarningsIf you haven`t bought GOOG before the previous rally:
Now analyzing the options chain and the chart patterns of GOOG Alphabet prior to the earnings report this week,
I would consider purchasing the 170usd strike price Calls with
an expiration date of 2025-7-18,
for a premium of approximately $4.35.
If these options prove to be profitable prior to the earnings release, I would sell at least half of them.

GOOGL Weekly Options Trade Plan 2025-04-17GOOGL Weekly Analysis Summary (2025-04-17)
Below is our integrated analysis for GOOGL weekly options trading based on the current options data and the multiple model reports:
──────────────────────────────
Comprehensive Summary of Each Model’s Key Points
• Grok/xAI Report – Observes that although the 5‐minute chart shows a hint of short‐term bullishness, the daily chart is clearly bearish (price below the 10 EMA and RSI around 41) and news catalysts (antitrust concerns) add further downside bias. – Highlights a significant concentration of put open interest around the $150 strike and recommends buying the $150 put at a premium of about $0.24 with an entry at open. – Suggested profit target at roughly a 50% premium increase and a stop loss if the premium falls by about 25% (or if the price fails to break key resistance).
• Claude/Anthropic Report – Confirms a moderately bearish bias with price trading below all key daily EMAs and negative regulatory news intensifying the downside. – Points to the heavy open interest in the 150 puts and emphasizes that although max pain is at $155 (a theoretical pull toward higher prices), the aggressive negative catalyst trumps this signal. – Recommends a put trade with guidelines for profit-taking (roughly a 100% premium gain) and a 50% premium stop-loss; entry to be made at market open.
• Gemini/Google Report – Notes the strong bearish daily setup (price clearly below the 10/50/200 averages and near key supports around $150) combined with negative antitrust headlines. – While acknowledging some short-term consolidation on the 5-minute chart, the report favors a bearish play and selects the $150 put (even though its premium of $0.24 is a bit below the “ideal” $0.30–$0.60 range). – Recommends entering at open with specific targets (aiming for around a 100% return on premium or an exit if the underlying fails to break levels) and strict stop-loss discipline.
• Llama/Meta Report – Summarizes that the technicals (including MACD and RSI on both timeframes) and high volatility (VIX ~32.64) combine for a moderately bearish setup. – The heavy put open interest at $150 further reinforces this view. – Recommends buying the $150 put at market open with a modest profit target (around a 50% gain on premium) and a stop-loss if the underlying rallies above key resistance levels.
• DeepSeek Report – Emphasizes that despite the max pain at $155, the technical breakdown below key moving averages and significant negative news support a bearish trade. – Recommends buying weekly (0DTE) $150 puts at the current premium of $0.24, with exit parameters tied to breaching immediate support or achieving a 50% gain in premium. – Notes that risk management is crucial given the 0DTE nature and high volatility.
────────────────────────────── 2. Areas of Agreement and Disagreement Between Models
• Agreement: – All models share a moderately bearish outlook driven by a combination of: ○ Price performance below key moving averages and declining daily RSI. ○ Negative news catalysts (antitrust issues and breakup concerns). ○ Heavy put open interest at the $150 strike, aligning with technical support. – Each model favors a single-leg, naked put strategy on GOOGL weekly expirations, with an entry at market open.
• Disagreement: – There is some variation in the selection of profit target and stop loss levels: ○ Grok/xAI and DeepSeek lean toward a profit target near a 50% premium gain and a tighter stop loss, while Claude/Anthropic and Gemini reference a slightly larger profit target (up to 100% gain) paired with a 50% stop loss. – There is a mild conflict with the max pain theory (which is bullish at $155) versus the consensus technical and news story indicating further downside. However, all models agree that the negative catalysts outweigh the theoretical pull toward max pain.
────────────────────────────── 3. Conclusion and Trade Recommendation
• Overall Market Direction Consensus: – The integrated view is moderately bearish. Although intraday charts hint at short-term consolidation, the dominant daily technicals, high volatility, and strongly negative news set the stage for further downside pressure.
• Recommended Trade: – We recommend buying a single-leg, naked put option. – Selected Instrument: GOOGL weekly option with a $150 strike (0DTE expiring on 2025-04-17). – Premium: The current ask is $0.24 per contract. Although this is slightly below the ideal range, the risk/reward profile is favorable given the strong technical and sentiment bias. – Entry Timing: Enter at market open. – Profit Target: Aim for a premium increase to approximately $0.36 (a ~50% gain). – Stop-Loss: Set a stop-loss around $0.12 (roughly a 50% reduction in premium), or exit if the underlying rallies decisively above the intraday resistance levels (around $152). – Confidence Level in the Recommendation: Approximately 70%.
• Key Risks and Considerations: – The max pain level at $155 could introduce some intraday upward pressure. – High implied volatility (VIX at 32.64) means rapid moves could quickly hit stop-loss triggers. – The 0DTE nature of the option calls for strict monitoring; if GOOGL fails to break below key support levels early on, exit the position promptly. – Overall market reversals or unexpected news can rapidly change the trade dynamics.
────────────────────────────── 4. TRADE_DETAILS (JSON Format)
{ "instrument": "GOOGL", "direction": "put", "strike": 150.00, "expiry": "2025-04-17", "confidence": 0.70, "profit_target": 0.36, "stop_loss": 0.12, "size": 1, "entry_price": 0.24, "entry_timing": "open" }
Disclaimer: This newsletter is not trading or investment advice but for general informational purposes only. This newsletter represents my personal opinions based on proprietary research which I am sharing publicly as my personal blog. Futures, stocks, and options trading of any kind involves a lot of risk. No guarantee of any profit whatsoever is made. In fact, you may lose everything you have. So be very careful. I guarantee no profit whatsoever, You assume the entire cost and risk of any trading or investing activities you choose to undertake. You are solely responsible for making your own investment decisions. Owners/authors of this newsletter, its representatives, its principals, its moderators, and its members, are NOT registered as securities broker-dealers or investment advisors either with the U.S. Securities and Exchange Commission, CFTC, or with any other securities/regulatory authority. Consult with a registered investment advisor, broker-dealer, and/or financial advisor. By reading and using this newsletter or any of my publications, you are agreeing to these terms. Any screenshots used here are courtesy of TradingView. I am just an end user with no affiliations with them. Information and quotes shared in this blog can be 100% wrong. Markets are risky and can go to 0 at any time. Furthermore, you will not share or copy any content in this blog as it is the authors' IP. By reading this blog, you accept these terms of conditions and acknowledge I am sharing this blog as my personal trading journal, nothing more.

Google - Fantastic Bullish Break And Retest!Google ( NASDAQ:GOOGL ) just looks amazing:
Click chart above to see the detailed analysis👆🏻
For more than a decade, Google has been trading in a rising channel formation, perfectly respecting all market structure. Now, Google is about to retest the previous all time high once again and with a sharp correction of about -25%, this offers a significant bullish reversal setup.
Levels to watch: $150
Keep your long term vision,
Philip (BasicTrading)

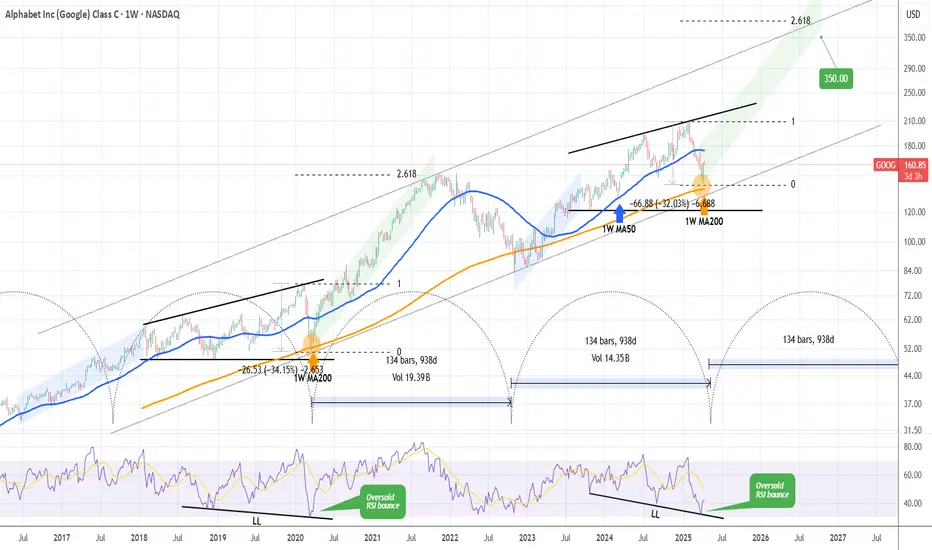
GOOGLE's generational bottom made. This is how it reaches $350.Alphabet Inc. (GOOG) almost tested last week its 1W MA200 (orange trend-line). That level has been holding for more than 2 years (since March 13 2023) and it's been the main Support of the Bull Cycle that followed the November 2022 Inflation Crisis bottom.
The pattern is almost like the Ascending Triangle that led to the March 2020 COVID crash, which was the most recent time before the late 2022 bottom that the stock made contact with the 1W MA200. As you realize, all those times have been what we call 'generational bottoms', thus extremely good long-term buy opportunities. And as you see they've been on extremely tight time symmetry, all took place roughly every 2.5 years.
If the pattern continues to repeat itself, then we may witness a rally (green Channel Up) similar to the one that peaked on November 2021 and reached the 2.618 Fibonacci extension. As a result, setting a $350 Target would be more than realistic based on this pattern.
-------------------------------------------------------------------------------
** Please LIKE 👍, FOLLOW ✅, SHARE 🙌 and COMMENT ✍ if you enjoy this idea! Also share your ideas and charts in the comments section below! This is best way to keep it relevant, support us, keep the content here free and allow the idea to reach as many people as possible. **
-------------------------------------------------------------------------------
💸💸💸💸💸💸
👇 👇 👇 👇 👇 👇
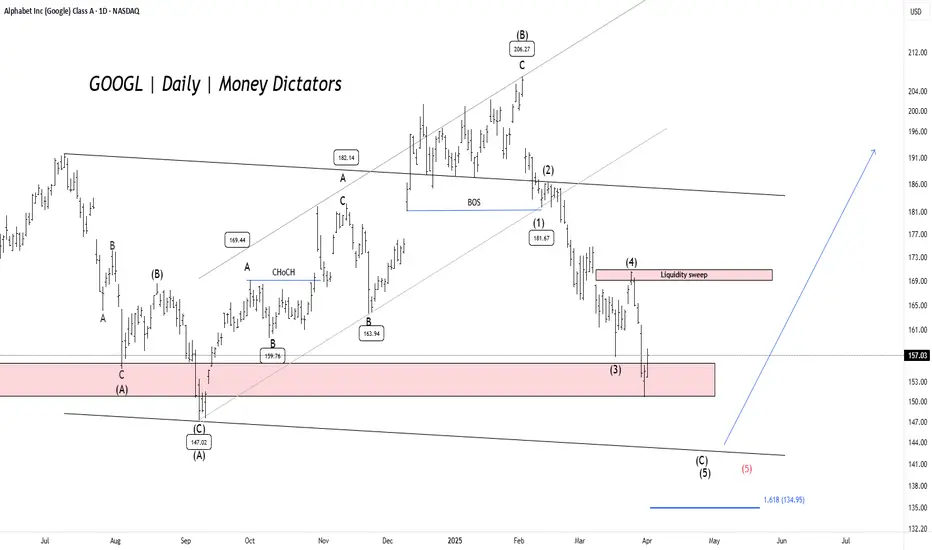
GOOGL - Elliott Wave Final ShowdownGOOGL has dropped over 27.28% , reaching a minor profit-booking zone. The $150 level serves as a key demand zone, where a potential price reversal could occur. The formation is either expanded flat or a running flat on the daily timeframe chart.
Confirmation is best observed near the lower trendline of the parallel channel. If bearish momentum persists, prices may decline further to the $142-$140 range before a strong rebound. Once the correction ends, the upside targets are $168, $180, and $195.
A new low will form if the previous low is breached. Further research will be uploaded soon.
Alphabet (GOOGL) Stock Hits 2025 LowAlphabet (GOOGL) Stock Hits 2025 Low
As seen on the Alphabet (GOOGL) stock chart, the price has dropped close to $156—a level not seen since September 2024.
Since the start of 2025, the stock has fallen by more than 18%.
Why Is GOOGL Falling?
As mentioned earlier today, overall market sentiment remains bearish due to the White House’s tariff policies.
For Alphabet (GOOGL), the situation has worsened today due to the following developments (as reported by the media):
➝ Google has admitted liability and agreed to pay $100 million in cash to settle a US class-action lawsuit accusing the company of overcharging advertisers, according to Reuters. Alphabet shares dropped 4.4%.
➝ Google’s division was found guilty of anti-competitive behaviour in India related to its app store billing system.
Technical Analysis of Alphabet (GOOGL)
In February, we noted investors’ negative reaction to the company’s earnings report, which led to a bearish gap (marked by a red arrow).
Since then, bears have maintained control, pushing the price below the lower boundary of the ascending channel that had been valid since 2023. Key signals include:
➝ The $170 level (near the bearish gap on 10 March) acted as resistance on 25 March.
➝ Bears showed little reaction to bulls at the $160 level and have kept the price contained between two downward-sloping red lines.
Bears may now be targeting the psychological level of $150. If bulls want to maintain control over GOOGL’s long-term uptrend, they need to take action soon.
This article represents the opinion of the Companies operating under the FXOpen brand only. It is not to be construed as an offer, solicitation, or recommendation with respect to products and services provided by the Companies operating under the FXOpen brand, nor is it to be considered financial advice.
Is Stock Market Going to Crash?Stock Market Analysis | NASDAQ:QQQ AMEX:SPY
Mag 7 Price Forecast | NASDAQ:TSLA NASDAQ:NVDA AAPL AMZN META MSFT GOOGL

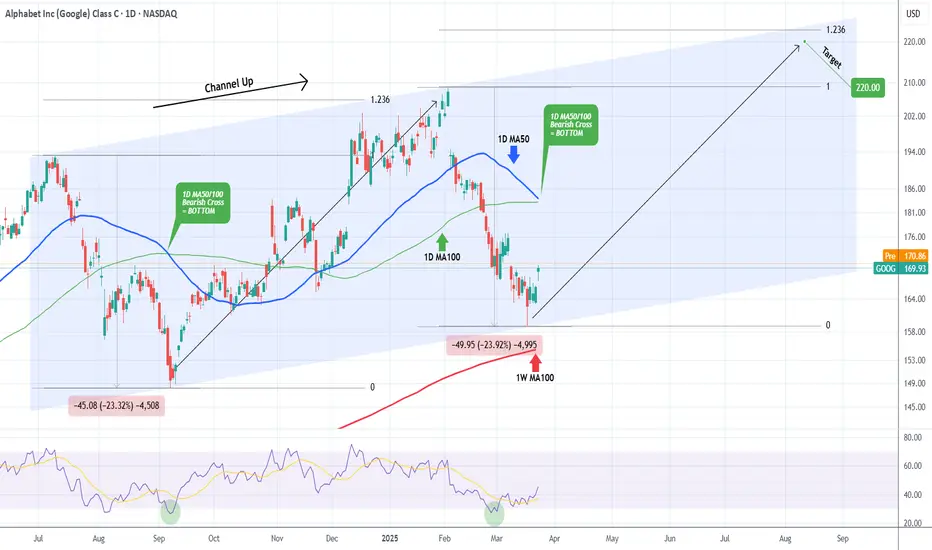
GOOGLE Bottom confirmed. Laying eyes on $220.Alphabet Inc. (GOOG) has been trading within a Channel Up since the July 10 2024 High. Last week, the Bearish Leg touched the pattern's bottom, completing a -23.92% decline from the top, which is almost symmetrical to the previous Bearish Leg (-23.32%).
At the same time the 1D RSI got oversold (<30.00) and recovered on a Bullish Divergence, while the 1D MA50 (blue trend-line) crossed below the 1D MA100 (green trend-line), forming a Bearish Cross. Last time we had this formation was September 06 2024 and 1 day later, the bottom (Higher Low of the Channel Up) was formed.
Among all this, the 1W MA100 (red trend-line) is holding, which is the market's long-term Support since July 12 2023. As a result, we expect the new Bullish Leg to start and as the previous one did, target the 1.236 Fibonacci extension at $220.00.
-------------------------------------------------------------------------------
** Please LIKE 👍, FOLLOW ✅, SHARE 🙌 and COMMENT ✍ if you enjoy this idea! Also share your ideas and charts in the comments section below! This is best way to keep it relevant, support us, keep the content here free and allow the idea to reach as many people as possible. **
-------------------------------------------------------------------------------
💸💸💸💸💸💸
👇 👇 👇 👇 👇 👇
Stock Market Forecast | TSLA NVDA AAPL AMZN META MSFTStock Market Forecast | NASDAQ:QQQ AMEX:SPY
Mag 7 Forecast | TSLA NASDAQ:NVDA AAPL AMZN META MSFT NASDAQ:GOOG

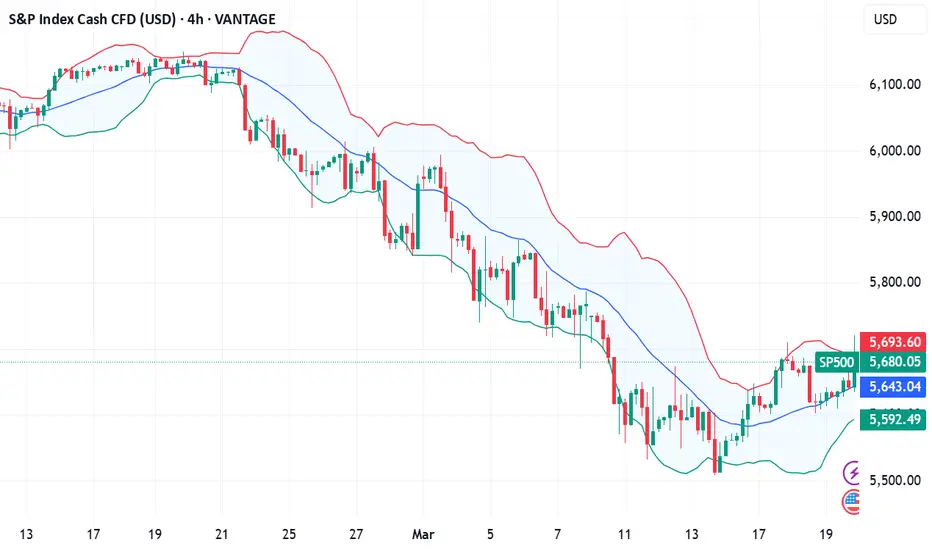
Sharp reversal in US marketsAmid market volatility and uncertainty, US stock indices experienced a sharp decline last week. The Dow Jones Index (#DJI30) fell by 3.5%, the S&P 500 (#SP500) dropped by 4.1%, and the Nasdaq-100 (#NQ100) lost 5.5%.
Investors reacted nervously to new economic data, including rising inflation and expectations of interest rate hikes, leading to a sell-off in stocks and a decline in key indices. The drop was particularly significant in the technology and consumer sectors, where companies like Apple and Tesla lost around 6-7% of their value.
However, starting March 13, 2025, the indices began to recover: #DJI30 gained 2.3%, #SP500 rose by 2.5%, and #NQ100 increased by 3.1%.
The recent rebound in US stock indices has been driven by several factors that restored investor confidence. Let’s take a closer look at the main reasons:
• Improvement in unemployment data: Labor market statistics played a crucial role in the market recovery. The US unemployment rate fell to 3.4% in February 2025, marking a record low in recent decades. This indicates strong employment levels and economic resilience, boosting investor optimism and supporting stock market growth.
• Stabilization of inflation and interest rate expectations: Although inflation in the US remains high, recent data showed a slowdown in its growth. Reduced inflationary pressure gave investors hope that the Federal Reserve (Fed) might slow down the pace of interest rate hikes. This was perceived as a sign of potential economic stabilization, positively impacting stock indices.
• Growth in consumer spending: One of the key drivers of the recent market recovery has been the increase in consumer spending. In Q1 2025, consumer demand in the US showed strong performance, serving as an essential indicator of economic activity. Increased spending on goods and services supports business stability and enhances corporate revenues, which, in turn, stimulates stock growth.
• Absence of new geopolitical risks: In recent weeks, there have been no major geopolitical crises or new threats on the international stage. This helped financial markets stabilize, as investors could focus on economic data and corporate earnings reports, contributing to stock index growth.
• Positive corporate earnings reports:
• #Microsoft (MSFT): Microsoft shares rose by 4.2% after reporting strong quarterly results, driven by growth in cloud services and software revenue.
• #Google (GOOGL): Alphabet’s stock increased by 3.7% due to higher advertising revenue and improved forecasts for upcoming quarters.
• #Apple (AAPL): Apple shares climbed 2.9%, supported by strong sales of new products and rising revenue from services.
• #Tesla (TSLA): Tesla stock surged 5.6%, fueled by strong electric vehicle sales growth and optimistic profit projections for the next quarter.
These companies demonstrated significant growth on the back of improved financial performance, strengthening investor confidence and aiding the stock market’s recovery amid volatility.
So despite last week’s market downturn, the current situation in the US stock market signals a potential recovery and a more positive trend in the coming weeks.
Is GOOGL Setting Up for a Rebound?The corrective move continues, offering potential opportunities for strategic entries. If the dip extends, these key levels could present buying opportunities:
📉 Entry Points:
🔹 165
🔹 158
🔹 150
🔹 135-130 ⚠️ Possible deeper entry point???
📈 Profit Targets:
🔹 175
🔹 181
🔹 190
Will GOOGL find support at these levels and bounce back, or is there more downside ahead? Stay prepared and manage your risk wisely.
Disclaimer: The information provided is for educational purposes only and does not constitute investment advice. Trading involves significant risks, and past performance is not indicative of future results. Always conduct your own analysis and consult a financial advisor before making any investment decisions.
