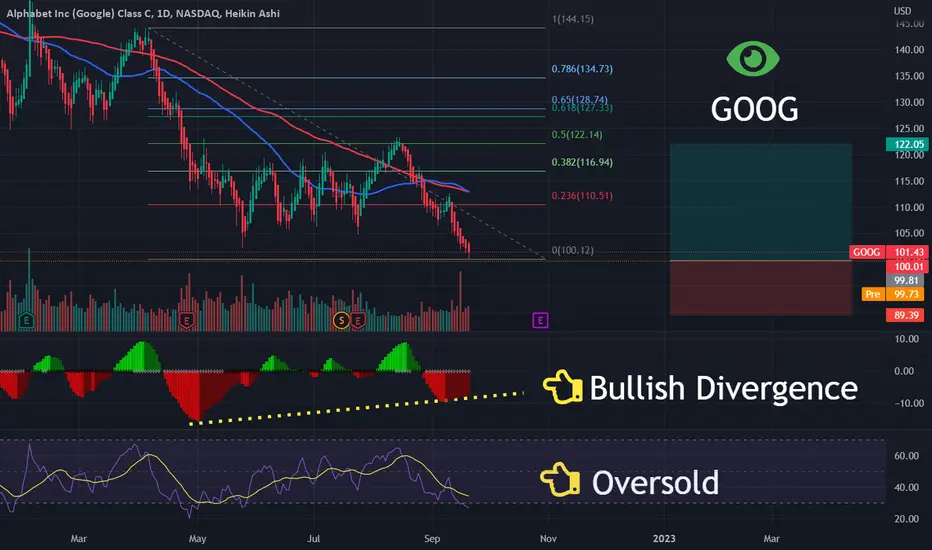
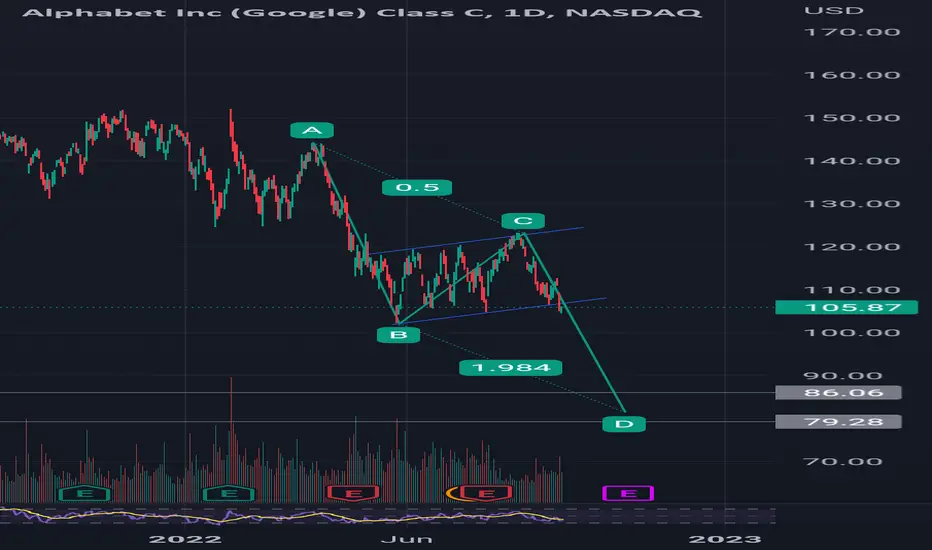
GOOGL on Support After a Down Flag After a discrimination(down flag) GOOGL broke out from the canal. Now it's on a critical Fibonacci support area.
Important Fibonacci Levels:
-88,7
-100
-112
-127
-150

Beginning of an End (Update on Uber 3)Uber is at the peak of driver's dissatisfaction. Will bribery rescue it once again? No.
It is beside the company's debts and cyber security weakness.
It got no future...

GOOG | Buying the Fear | LongAlphabet Inc. provides various products and platforms in the United States, Europe, the Middle East, Africa, the Asia-Pacific, Canada, and Latin America. It operates through Google Services, Google Cloud, and Other Bets segments. The Google Services segment offers products and services, including ads, Android, Chrome, hardware, Gmail, Google Drive, Google Maps, Google Photos, Google Play, Search, and YouTube. It is also involved in the sale of apps and in-app purchases and digital content in the Google Play store; and Fitbit wearable devices, Google Nest home products, Pixel phones, and other devices, as well as in the provision of YouTube non-advertising services. The Google Cloud segment offers infrastructure, platform, and other services; Google Workspace that include cloud-based collaboration tools for enterprises, such as Gmail, Docs, Drive, Calendar, and Meet; and other services for enterprise customers. The Other Bets segment sells health technology and internet services. The company was founded in 1998 and is headquartered in Mountain View, California.
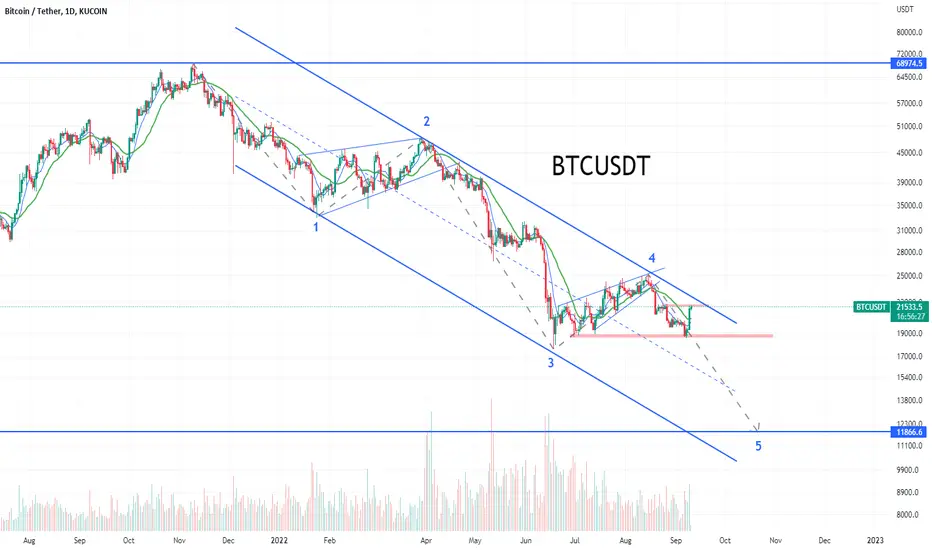
$GOOG to $90Great opportunity for long term investing. The formation is bearish too. I think the fed is going to hike by 1%, not 0.75%. Most stocks will sink. 50% fibonacci ratio of logarithmic chart falls slightly below 61.8 ratio of regular chart.

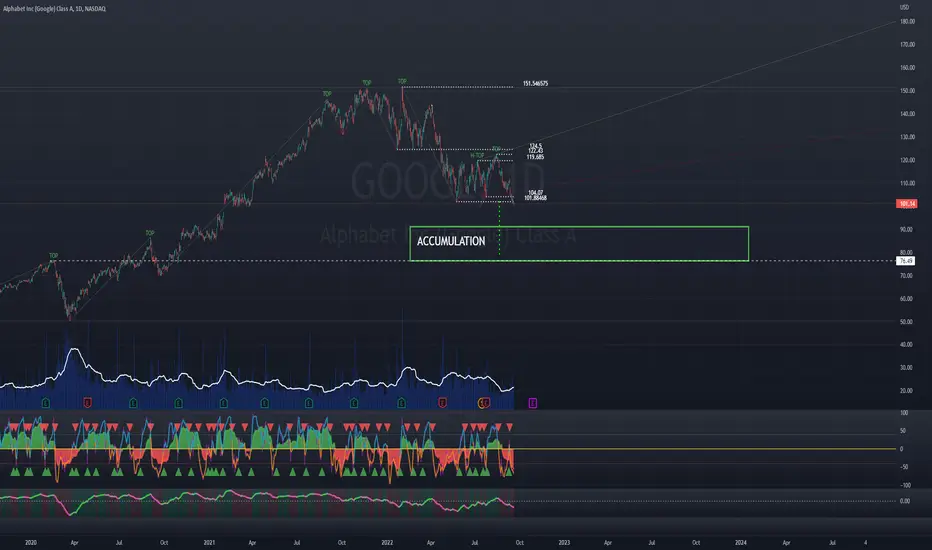
GOOGL ACCUMULATION AREAGOOGLE ACCUMULATION AREA, long-term
Possible correction of GOOGLE and accumulation
Google Bearish and bulish chart- double top
- death cross between MA50 and MA100
- MACD bearish divergence

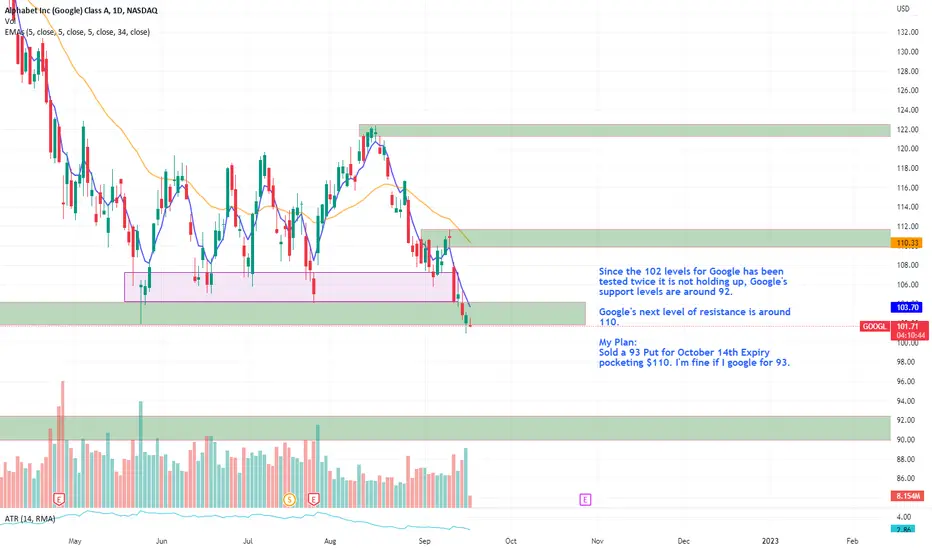
Google Trade Setup idea 19-september-2022Since the 102 levels for Google has been tested twice it is not holding up, Google's support levels are around 92.
Google's next level of resistance is around 110.
My Plan:
Sold a 93 Put for October 14th Expiry pocketing $110. I'm fine if I google for 93.
Google | Massive Bull Volume at SupportGoogle is pulling into support with MASSIVE bullish volume (the biggest bull volume (that I can see) since March of 2020). Potentially a good play to go long with a target at the 100 MA. If the bull volume gets trapped, I imagine it would go very bearish quite quickly. Just my opinion. Thoughts?

Google buy zone approachingBuy zone for google in my opinion is approaching. There's a gap fill to fill right around 100-98$. I have a buy set for 99$. that would be -35% from the top. if it goes lower I'm fine with that ill keep DCA as it'll be a long term hold. google have spoken much going on and finger in so many different pies that its impossible for them not to see future growth in my opinion. great company and great long term hold.

Google bear flagGOOG is in a textbook bear flag and appears to be on the brink of breaking down. There's potential for a big move down to around $80.
Google to 85$After Awful CPI data and projected 100BPS Raise next week the trend continues to be the same

GOOG shortGOOG chart not looking so hot.
Likely to make new lows in a nasty sell-off. Bear flag is clear as day. Really hoping to see it play out, so I can buy some really cheap google!


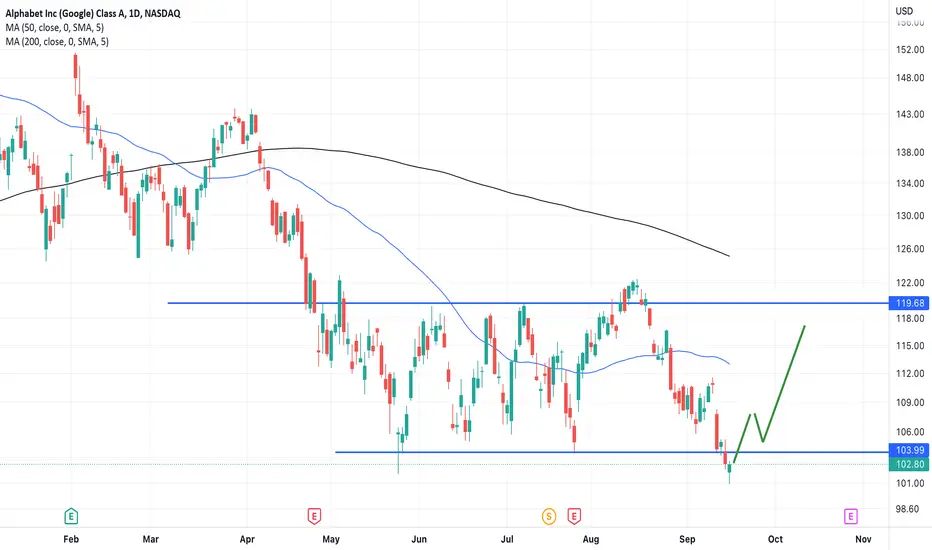
GOOGLE | The Legendary of Moving Averages 200 DaysWednesday 14 September 2022
02:29 AM (WIB)
Have you ever imagined owning a business online as Digital Marketer? You have some fabulous products that need to spread to your audience market. You know how to market that product through social media such as Facebook Ads and Google Ads. You know where to use the best platform agency as your Campaign Ads Company. And you know best how to do that from 0 to Hero.
Unfortunately, you don’t even have money to operate your own business online, because you know that will need a lot of investment on it.
Example:
You know what the product that will make you Rich is, but it doesn’t need to invest a million dollars. Forget that! Even your Bank doesn’t recognize you at all. So, forget that.
You are born such A creative person and your imagination is above and beyond what your friends can imagine! And again, unfortunately, you don’t even have your own car.
Don’t worry my friends, you got me.
For covering all the funds for running your own business, you can start to invest your money in this pair: GOOGLE! Yes! Google! What is the amount for your online business? Around $5.000 to $15.000? I believe you can have that funds with only $500. You just need to buy Google at $92 with precise SL. And you are ready to go about 2 Years. Wish you the very best smile in the next 2 years, buddy!

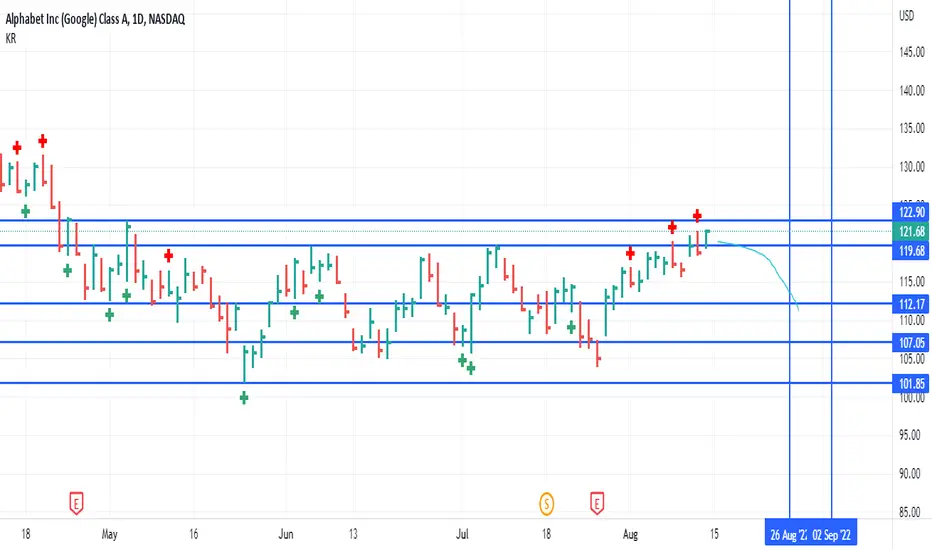
GOOGL (Alphabet) to reach 112 by the end of AugustBackground
GOOGL has been trading in a channel between resistance level 119.68 and support between 105 and 102 since April 27th. On August 8th, GOOGL broke through the resistance level slightly before heading lower the next day, and it appeared that it was on it's way down to touch the support level for a 5th time in 3 months. But a surprise rally on August 10th sent the price towards the next resistance level of 122.85.
Analysis
While this appears to be a sustained rally, there have been 3 bearish key reversals in August. These are the first bearish reversals since May during which bullish reversals dominated (at least 6). This would indicate that a possible bearish move is imminent if the price bounces off the 122.85 resistance level in the next couple of trading sessions. The price could reach 112.50 by then end of the month.
What is a Key Reversal?
A bullish key reversal is when the price makes a new low, reverses, and closes near or on the high. A bearish key reversal is when the price makes a new high, reverses, and closes on or near the low.
Disclaimer: I could be completely wrong. I am not a financial advisor, and the above statements are not investment advice. My comments are only intended for educational purposes. You are solely responsible for your own trading decisions.
Google is preparing for a hearty climbGoogle is preparing for a hearty climb. The correction is formed in the form of a flat, which we are now in a branch of the C-terminal wave

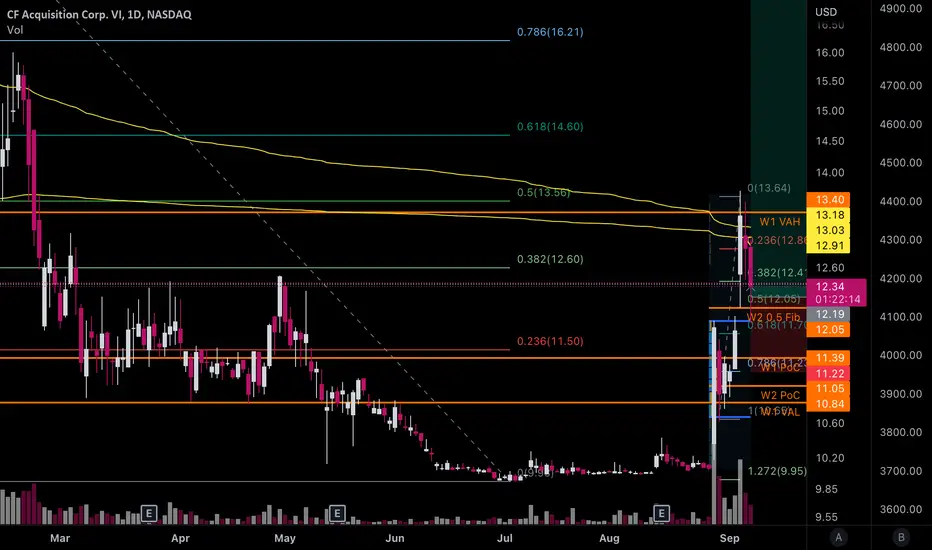
CFVI Long, It could rumblePossible WSB play if network effects of Andrew Tate could influence Zoomer capital to buy the stock as a FU to the monopoly to social media content platforms. However, it does bring into question how much of an influence they really have given how personal savings have fallen back to 2016 levels . This idea is only valid as long as we don't close under $12.05 on a daily candle.
Max price point I could see it going would be ~$52-$65 given how BBBY had a max mcap of $2.5B after WSB made its move on it (But lets not forget that it was short squeezed). Realistically, I can see it going to $17-$27. Good entries for a long at this point are ~$12, $11.35, and $10.30.
Max low price: 10.00
Max high price: 65.00
Trade:
Entry:12.19
SL:11.22
TP:17, 25, 50, 65

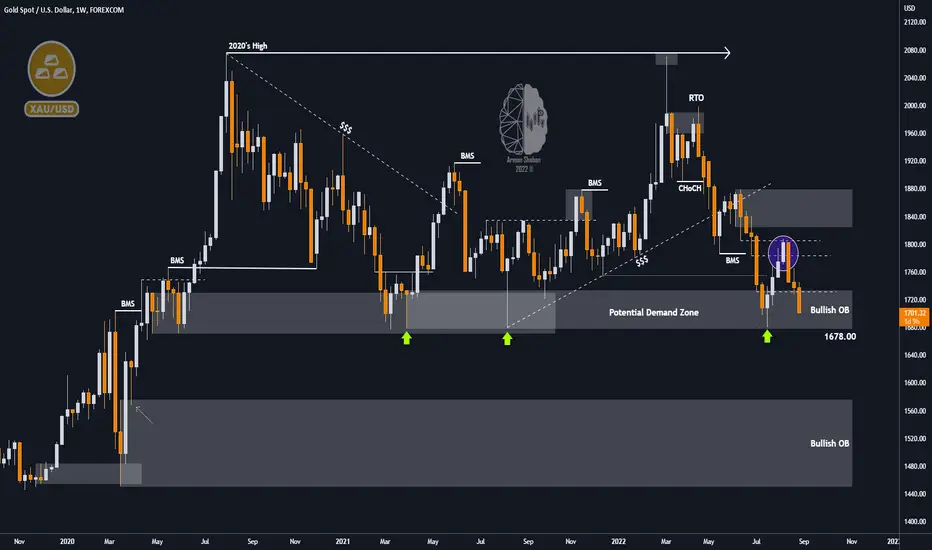
XAUUSD Weekly Chart : 09.01.22In this chart, after a few weeks, we will check the weekly chart, we had identified two important levels on the chart and we expected the price to reach those levels and show a reaction, one was the range of $1783 to $1806 and the other $1824! Well, we saw that after the growth of 1200 pips, the price finally reacted to the first level and is falling from there until now, we have to see if the range of $1681 to $1694 can stop the price from falling further or not! If this important Bullish Order Block cannot stop the price from falling, we can expect the price to reach the target of $1678!
Follow us for more analysis & Feel free to ask any questions you have, we are here to help.
⚠️ This Analysis will be updated ...
👤 Arman Shaban : @ArmanShabanTrading
📅 09.01.2022
⚠️(DYOR)
❤️ If you apperciate my work , Please like and comment , It Keeps me motivated to do better ❤️
Google | LongA side area can be seen in the Google chart, although the short trade seems more attractive to Google than the long trade.
be profitable🤑
