Alphabet (GOOGL) Stock Chart Analysis Following Earnings ReleaseAlphabet (GOOGL) Stock Chart Analysis Following Earnings Release
Earlier this week, we highlighted the prevailing bullish sentiment in the market ahead of Alphabet’s (GOOGL) earnings report, noting that:
→ an ascending channel had formed;
→ the psychological resistance level at $200 was of particular importance.
The earnings release confirmed the market’s optimism, as the company reported better-than-expected profits, driven by strong performance in both its advertising and cloud segments.
In his statement, CEO Sundar Pichai noted that AI is positively impacting all areas of the business, delivering strong momentum.
The company is expected to allocate $75 billion this year to expand its AI capabilities.
As a result, Alphabet (GOOGL) opened yesterday’s trading session with a bullish gap (as indicated by the arrow). However, as the session progressed, the price declined significantly, fully closing the gap.
This suggests that:
→ the bulls failed to consolidate their gains, allowing the bears to seize the initiative;
→ the ascending channel remains valid, with yesterday’s peak testing its upper boundary;
→ such price action near the $200 level reinforces expectations that this psychological mark will continue to act as resistance.
It is possible that the positive sentiment following the earnings report may weaken in the near term. Accordingly, traders may consider a scenario in which Alphabet’s (GOOGL) share price retraces deeper into the existing ascending channel. In this case, the former resistance levels at $180 and $184 may serve as a support zone.
This article represents the opinion of the Companies operating under the FXOpen brand only. It is not to be construed as an offer, solicitation, or recommendation with respect to products and services provided by the Companies operating under the FXOpen brand, nor is it to be considered financial advice.
Googletradingsetup
GOOGL TRADE IDEA (07/24)
🚨 GOOGL TRADE IDEA (07/24) 🚨
💥 Big institutional flow. 1 DTE. High gamma = high reward (⚠️ high risk too)
🧠 Quick Breakdown:
• Call/Put Ratio: 2.44 → ultra bullish
• Weekly RSI climbing (67.3) 📈
• Daily RSI falling from 77.5 → 🔻 short-term pullback risk
• Reports split: trade or wait? We’re in.
💥 TRADE SETUP
🟢 Buy GOOGL $200 Call exp 7/25
💰 Entry: $2.09
🎯 Target: $3.14–$4.18 (50–100%)
🛑 Stop: $1.25
📈 Confidence: 70%
⚠️ Expiry in 1 day = tight execution needed. Gamma can cut both ways. Watch it like a hawk. 👀
#GOOGL #OptionsFlow #CallOption #GammaSqueeze #TechStocks #UnusualOptionsActivity #TradingView #StockAlerts #BigMoneyMoves #DayTrading #OptionsTrading

Alphabet (GOOGL) Stock Approaches $200 Ahead of Earnings ReleaseAlphabet (GOOGL) Stock Approaches $200 Ahead of Earnings Release
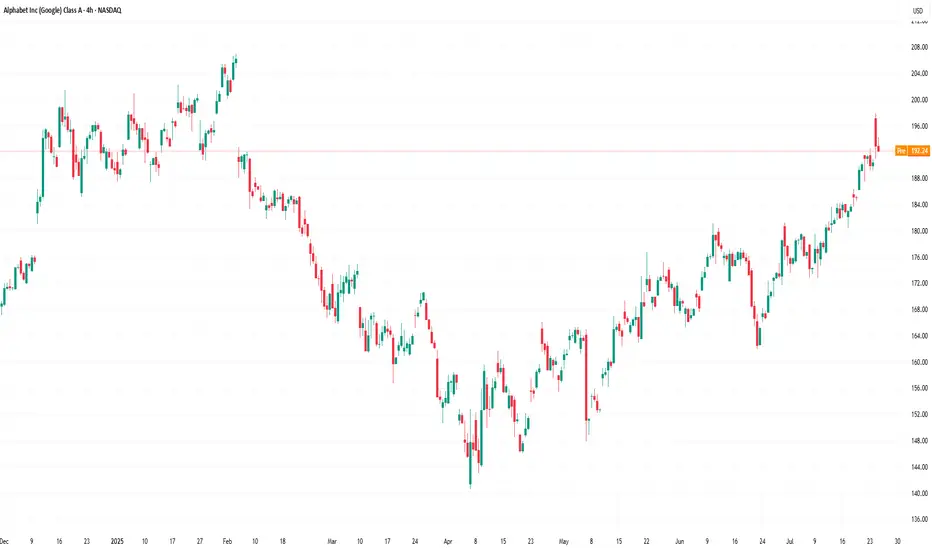
According to the Alphabet (GOOGL) stock chart, the share price rose by more than 2.5% yesterday. Notably:
→ the price reached its highest level since early February 2025;
→ the stock ranked among the top 10 performers in the S&P 500 by the end of the day.
The positive sentiment is driven by expectations surrounding the upcoming quarterly earnings report, scheduled for release tomorrow, 23 July.
What to Know Ahead of Alphabet’s (GOOGL) Earnings Release
According to media reports, Wall Street analysts forecast Alphabet’s Q2 revenue to grow by approximately 11% year-on-year, with expected earnings per share (EPS) of around $2.17 — up from $1.89 a year earlier. Notably, the company has consistently outperformed estimates for nine consecutive quarters, setting a positive tone ahead of the announcement.
Despite the optimism, investors are closely monitoring two key areas:
→ Cloud computing competition , where Google Cloud contends with Microsoft Azure and Amazon AWS;
→ Growing competition in the search sector , linked to the rise of AI-based platforms such as ChatGPT.
In response, Alphabet is significantly increasing its capital expenditure on AI infrastructure, planning to spend around $75 billion in 2025. These investments are aimed at both defending its core search business and advancing the Gemini AI model, while also strengthening Google Cloud’s market position.
Technical Analysis of Alphabet (GOOGL) Stock
Since April, GOOGL price fluctuations have formed an ascending channel (marked in blue).
From a bullish perspective:
→ the June resistance level at $180 has been breached and may soon act as support;
→ previous bearish reversals (marked with red arrows) failed to gain momentum, suggesting sustained demand is pushing the price higher.
From a bearish standpoint, the price is approaching:
→ the psychological level of $200, which has acted as a major resistance since late 2024;
→ this barrier may be reinforced by a bearish gap formed in early February.
Strong results from the previous quarter, combined with optimistic forward guidance from Alphabet’s management, could provide bulls with the confidence needed to challenge the $200 level.
This article represents the opinion of the Companies operating under the FXOpen brand only. It is not to be construed as an offer, solicitation, or recommendation with respect to products and services provided by the Companies operating under the FXOpen brand, nor is it to be considered financial advice.

"GOOGL Technical Play: MA Bounce for Swing Traders!"🚀 GOOGL Stock Heist: The Ultimate AI & Ad-Tech Gold Rush (Swing Trade Plan)
🌟 Market Pirates, Ready to Raid? 🏴☠️💰
🔥 Thief Trading Blueprint for GOOGL (Alphabet Inc.)
🎯 Entry (The Vault is Open!)
Pullback Breakout Strategy:
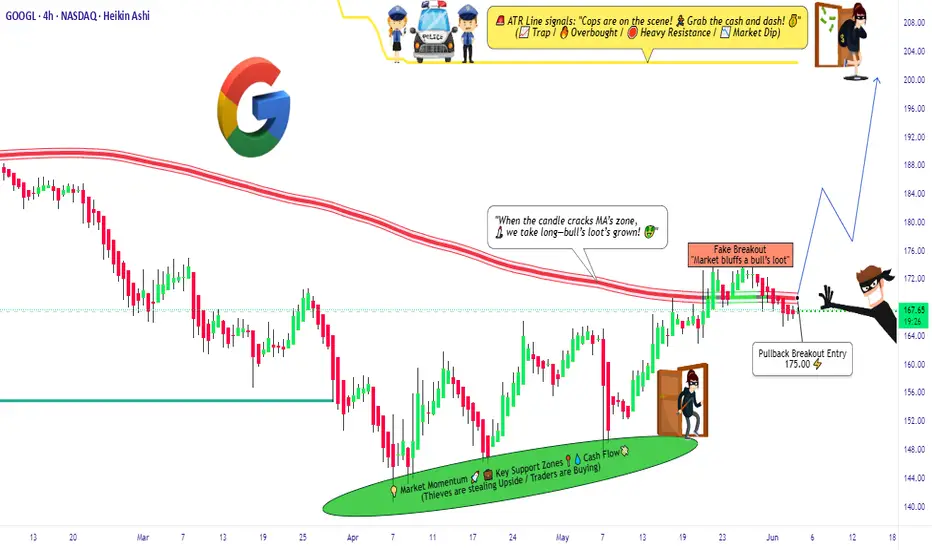
Buy Zone: Wait for a pullback near the Moving Average "Wall" (e.g., 200-day LSMA, depending on trend alignment).
Confirmation: Enter long if price bounces off the MA with volume support or breaks above a tight consolidation.
Exact Entry: $175.00 (key psychological level + MA confluence). Use buy limits for precision.
Breakout Add-On: If GOOGL clears $180 with momentum, consider adding to the position.
🛑 Stop Loss (Escape Route)
SL: Place below the recent swing low (4H/1D timeframe) or 2-3% below entry (~$170.50 if entering at $175).
Trailing SL: Adjust upward as price climbs to lock profits.
🏆 Target 🎯: $200.00 (The Ad-Tech & AI Jackpot!)
Why $200?
Cantor Fitzgerald’s bullish $200 target for NVDA reflects AI-sector optimism—similar tailwinds apply to GOOGL (AI integration in ads, cloud, and Gemini AI growth) 5.
Resistance levels and institutional liquidity zones align with this round-number target.
📈 Why GOOGL?
AI & Cloud Momentum: Google Cloud + Gemini AI adoption mirrors NVDA’s AI hype 15.
Technical Strength: Reclaimed 200-day SMA? Check for higher lows and sector leadership (like NVDA’s recent behavior) 314.
Fundamental Catalyst: Upcoming earnings or AI partnership announcements could fuel FOMO.
⚠️ Risk Management
Avoid news spikes: Earnings/regulatory news = volatility traps.
Scale out: Take partial profits at $190, let runners aim for $200.
💥 Pirate’s Bonus
Like/Boost if this plan helps! More heists incoming (TSLA? AAPL?). Stay tuned!
$GOOG $GOOGL IS A GIFT RIGHT NOW. YOU WILL SEE! NASDAQ:GOOG NASDAQ:GOOGL
IS A GIFT. YOU WILL SEE!👀
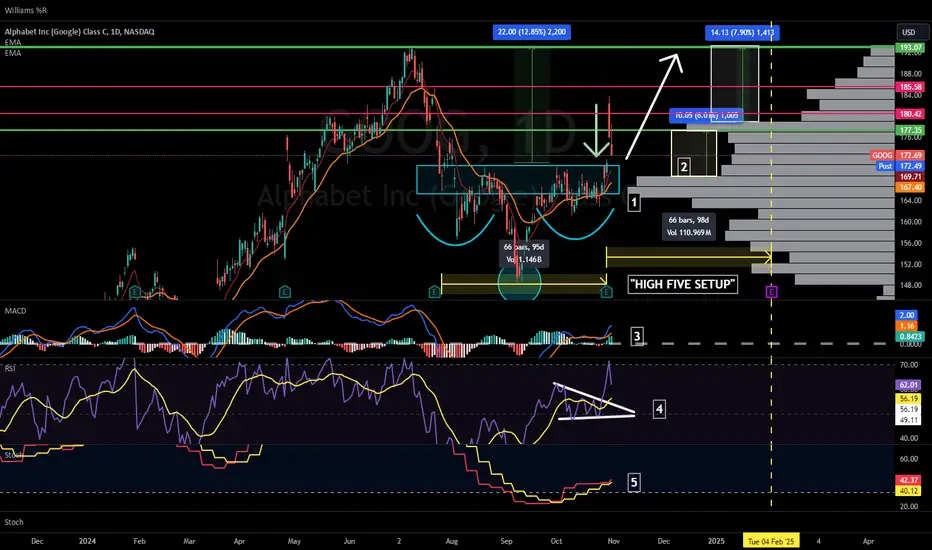
1.) High Five Setup
2.) Inverse H&S Breakout/will retest and fill earnings GAP then head to the Measure Move (MM) of $193.
3.) They just demolished earnings and everyone was bullish until the market decided to pull back. Everyone just forgot about the ones who reported first out the MAG7.
What do you think? Is this the easiest trade you've ever seen? IMO it's definitely one of them haha
"BE GREEDY WHEN OTHERS ARE FEARFUL"-WB
NFA
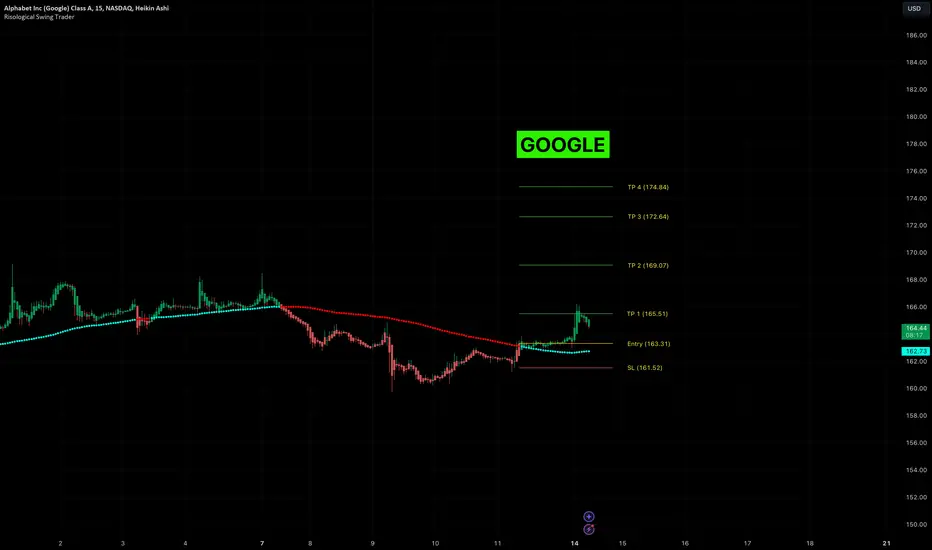
GOOGLE (GOOGL) Breaks Out? Bullish Surge on 15m TimeframeGoogle (GOOGL) has shown a bullish breakout following the entry at 163.31, pushing through the first target (TP1) at 165.51 with significant momentum.
Key Levels
Entry: 163.31 – The entry point aligns with a breakout from a period of consolidation, supported by upward movement across key technical indicators.
Stop-Loss (SL) : 161.52 – Positioned below recent support to minimize downside risk and protect against potential pullbacks.
Take Profit 1 (TP1): 165.51 – Already achieved, confirming the initial bullish momentum.
Take Profit 2 (TP2): 169.07 – Represents the next resistance level where profit-taking may occur as the uptrend continues.
Take Profit 3 (TP3): 172.64 – Should the bullish momentum persist, this is the next key resistance level to watch.
Take Profit 4 (TP4): 174.84 – The ultimate target, signaling a strong upward movement.
Trend Analysis
GOOGL is well above the Risological dotted trendline and shorter-term moving averages, indicating a healthy uptrend.
The breakout suggests continued bullish momentum, with TP2 and TP3 likely in focus if the uptrend sustains.
The bullish momentum in GOOGL is evident, with the price moving swiftly past TP1. With solid support from moving averages and strong buying pressure, the next targets at 169.07 and 172.64 are in sight.
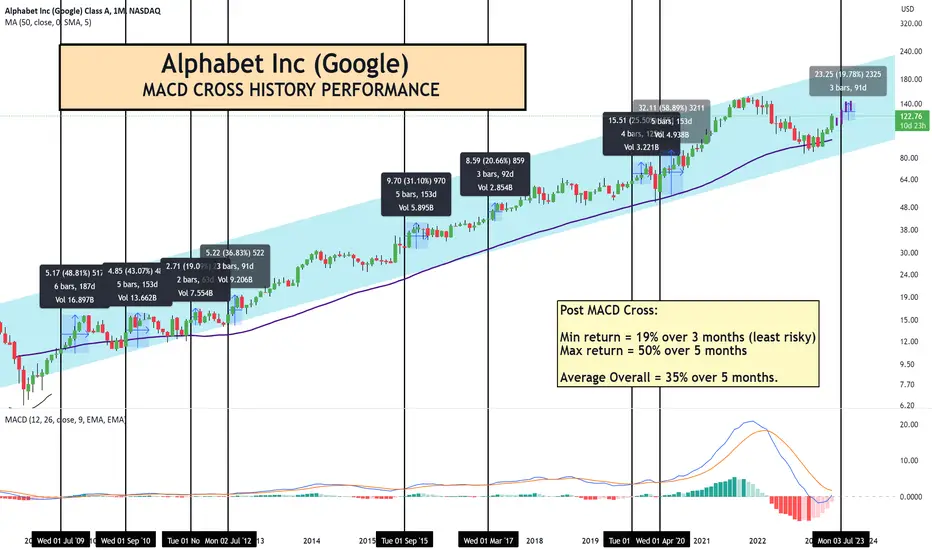
The Alpha in Alphabet Google
MACD Cross Historic Performance
July 2009 – 6 months – 48%
Sept 2010 – 5 months – 43%
Nov 2011 – 2 months – 19%
Jul 2012 – 3 months – 37%
Sept 2015 – 5 months - 31%
Mar 2017 – 3 months – 21%
Oct 2019 – 4 months – 25%
Apr 2020 – 5 months – 59%
Min return = c.19% over 3 months (least risky)
Max return = c.50% over 5 months
Average Overall = c.35% over 5 months.
Average return of the 8 past MACD crosses above is 35%. We have projected a modest 20% increase 2 to 3 months post MACD cross (Likely July/August bid). That’s IF we get the cross in then. Worth noting we are about 20% away from the ATH of $151. Keep in mind that a MACD cross is a lagging indicator so we try and anticipate the cross scenario.
Given the history of price in this long term parallel channel since Nov 2008, an incredibly idyllic scenario would be a revisit of the bottom of the channel or a revisit of the 50 month smooth moving average(SMA) in purple. If we ever revisited the 50 Month SMA or 200 week SMA I believe this would be a major opportunity, given this has only occurred 4 times in almost 15 years.
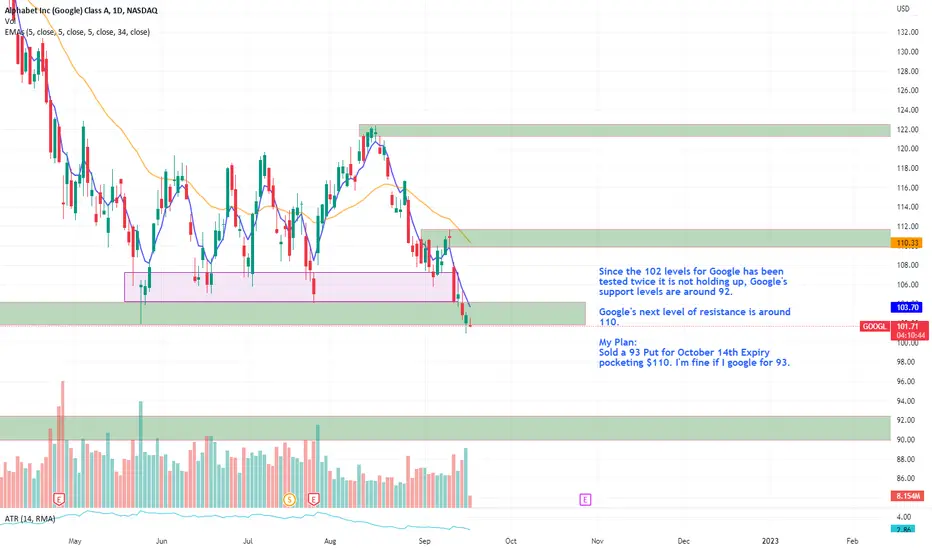
Google Trade Setup idea 19-september-2022Since the 102 levels for Google has been tested twice it is not holding up, Google's support levels are around 92.
Google's next level of resistance is around 110.
My Plan:
Sold a 93 Put for October 14th Expiry pocketing $110. I'm fine if I google for 93.
GOOG $ Breakout Levelwe just tested our resistant last week, now if we have a breakout from this level , we going to test 2 level of resistant, which the second resistant will give us the breakout to all time high for this year , over the 160$+.
the bottom that we should hold for this year if we want to see this movement , is holding above the 100$ support .

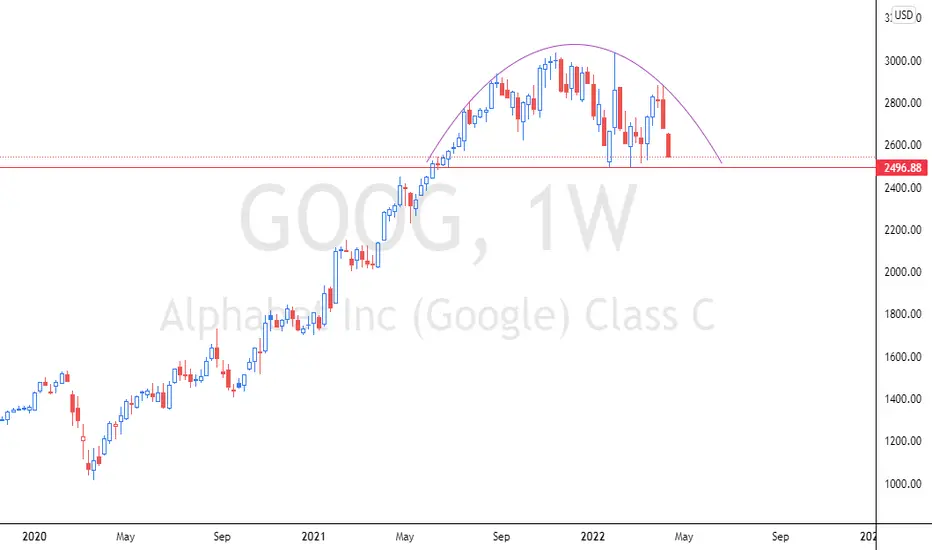
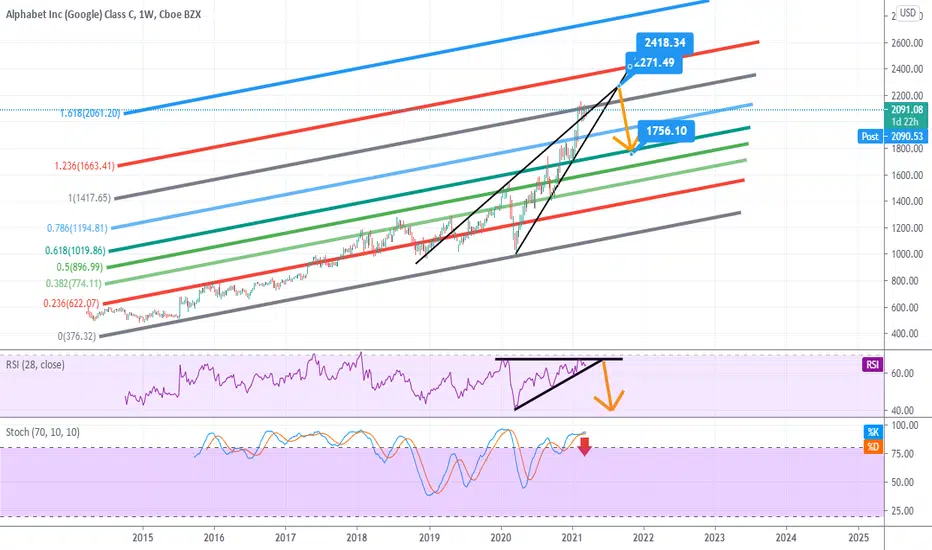
GOOGLE ROUND TOP ( BULLS UNDER PRESSURE)Google Bulls under pressure, a weekly close below $2,496 may interest more sellers to set in
GOOGL ALPHABET | Potential Downtrend.If you find this technical analysis useful, please like & share our ideas with the community.
What do you think is more likely to happen? Please share your thoughts in comment section. And also give a thumbs up if you find this idea helpful. Any feedback & suggestions would help in further improving the analysis.
Good Luck!
Disclaimer!
This post does not provide financial advice. It is for educational purposes only! You can use the information from the post to make your own trading plan for the market. But you must do your own research and use it as the priority. Trading is risky, and it is not suitable for everyone. Only you can be responsible for your trading.
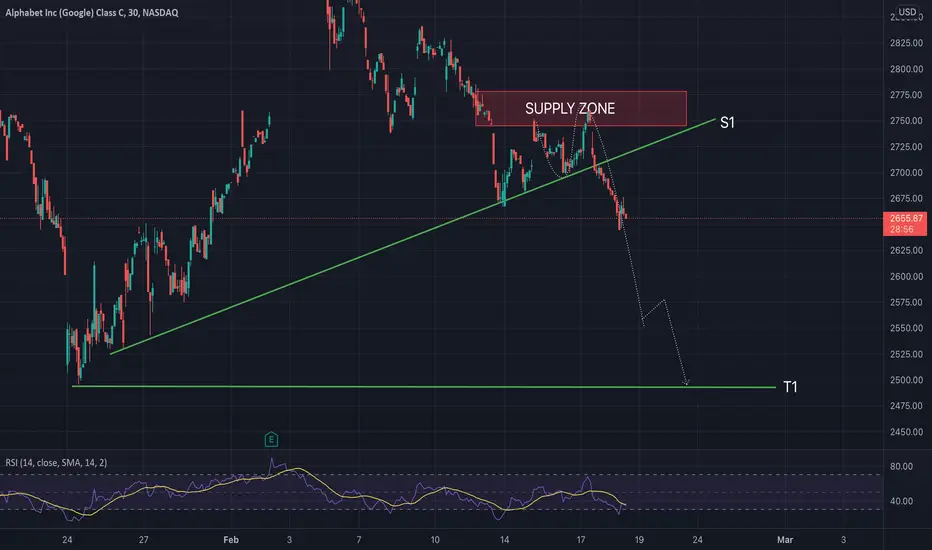
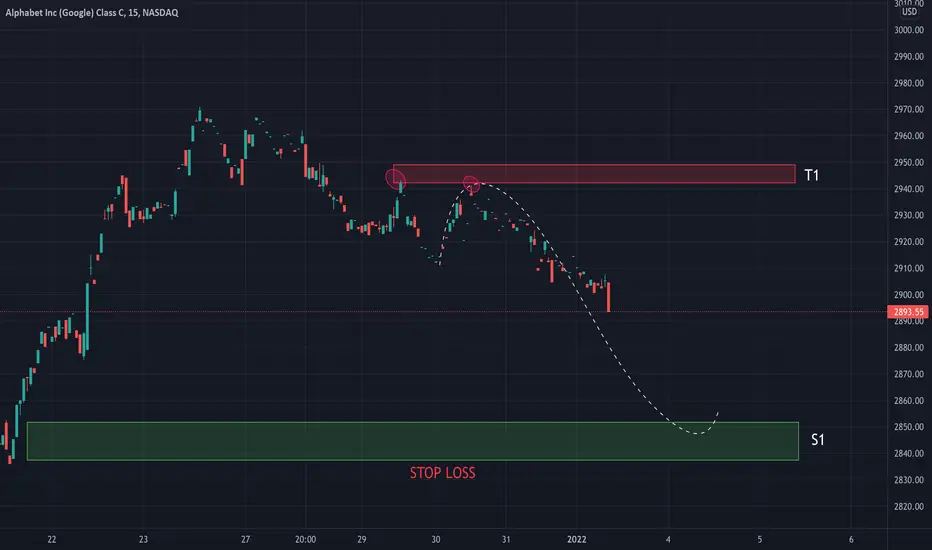
GOOGL ALPHABET | Shows Potential Uptrend!When it comes to GOOG Alphabet , right now it is in a downtrend and it is likely to get support at S1; which is near 2850. Since it is showing the bearishness, you might see a gap down. If gap down doesn’t happen, I wouldn’t recommend you to take the short position unless you get a pull back. When price reaches S1, you may go long while using S1 as a support area . And if you do, make sure to place the stop below the S1. Once you are in, you first exit should be at T1, which might act as a resistance area since we seen two strong rejections there.
If you find this technical analysis useful, please like & share our ideas with the community.
What do you think is more likely to happen? Please share your thoughts in comment section. And also give a thumbs up if you find this idea helpful. Any feedback & suggestions would help in further improving the analysis.
Good Luck!
Disclaimer!
This post does not provide financial advice. It is for educational purposes only! You can use the information from the post to make your own trading plan for the market. But you must do your own research and use it as the priority. Trading is risky, and it is not suitable for everyone. Only you can be responsible for your trading.
will google broke the highest resistance or return marketGoogle records the highest since inseption we have resistance if he broke it we must to records new highest but if not the market up down

I’m short at the momentOverbought, all highs, hoping for it to drop and can see it hitting either golden 61s 78s Fibonacci lines and rebounding.
(You should do your own studies)

GOOGLE -- It keeps getting stuckAs can be seen in the chart, there is a great squeeze in both prices and RSI. This is a bit scary of course ...
This tightness can continue up to the level of 2200$ or even 2400 $, but then we think it is very likely that we will see a big selling pressure for both the relaxation of the indicators and the completion of the technical formation formed by the prices.
We are not at the beginning of April anymore. It has been almost a year and the Nasdaq have an unstoppable rising. We wonder where will he stand ???
It contains only personal views and opinions. Does not contain legal investment advice ...
Google ideaWould NASDAQ:GOOG go long or short?
I think we might close the gap first and then go long.
Let's wait and see :)

Google (Alphabet inc.) SHORT📉 NASDAQ:GOOGL SHORT H4
🛒SELL BELOW = 1716.47
🎯Target1 = 1653.93
🎯Target2 = 1615.27
🛑Trailing Stop loss = 1817.66
❌Cancel trade and open reverse trade = 1817.66
🙈Recommended risk = 1-2%
#GOOGL #GOOGLSHORT #GOOGLSELL

GOOGLE IDEA📈 NASDAQ:GOOGL LONG H4
🛒BUY above = 1589.30
🎯Target1 = 1616.10
🎯Target2 = 1632.70
🛑Stop loss = 1545.50
🙈Recommended risk = (1%-2%)
📉 NASDAQ:GOOGL SHORT H4
🛒SELL BELOW = 1545.50
🎯Target1 = 1518.60
🎯Target2 = 1501.90
🛑Stop loss = 1589.30
🙈Recommended risk = (1%-2%)

GOOGLE SHORT📉 NASDAQ:GOOGL SHORT H4
🛒SELL BELOW = 1446.35
🎯Target1 = 1415.95
🎯Target2 = 1397.15
🎯Target3 = 1366.75
🛑Stop loss or cancel trade = 1495.60
🙈Recommended risk = (1%-2%)

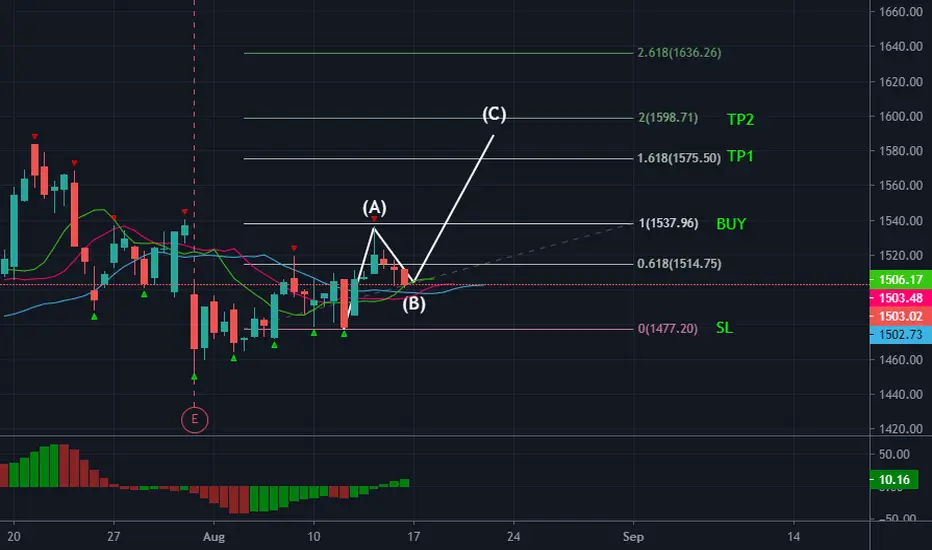
GOOGLE LONG📈 NASDAQ:GOOGL LONG H4
🛒BUY above = 1538
🎯Target1 = 1575
🎯Target2 = 1598
🛑Stop loss or cancel trade = 1477
🙈Risk = (2%-3%)
#GOOGL #GOOGLLONG #BUYGOOGL
GOOGL technicaly based forecast
📌Short intro:
I am full time trader - analyst * High accuracy of ideas * Technicaly and Fudnamentaly side in analysis * Comment if have any questions or want to send support * Price action - FIBO - Candl pattern * FX - STOCK - CRYPTO * Simple ideas
💡 GOOGL technicaly indicators showing we can expect higher bulish market recoveryng phase, FIBO 0.382 which is in some cases strong supp is breaked, good bulish candels foramtion, expecting to see push in price till FIBO 0.6 on same place i and supp trend line .
📌Have on mind, trading involves risk, check idea on your own tactic, if have questions pls comment!
Thanks on supporting!
All best, good luck!

GOOGL expecting higher berish market, technicaly based
ENTRY: 1315
TP: 1280
TP2: 1240
TP3: 1200
SL: 1343
Chart time frame - 1D
Time for reaching TP - 1-3D
Follow, Like, Share or Comment
Thanks on supporting!
All best!

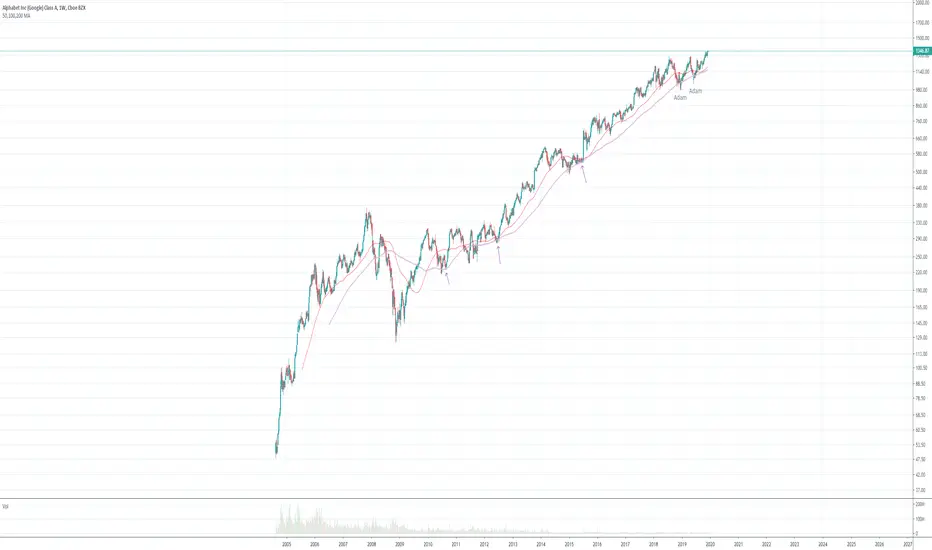
GOOGL To lead AI revolutionPreceding the recent Adam & Adam double bottom formation, consistent bounces off the 200MA can be seen. This double bottom formation will lead to bullish continuation. GOOGL aims to lead the industry in AI development, with the purchase of AI deep mind and acquisition of various other AI start-ups. Great long potential.