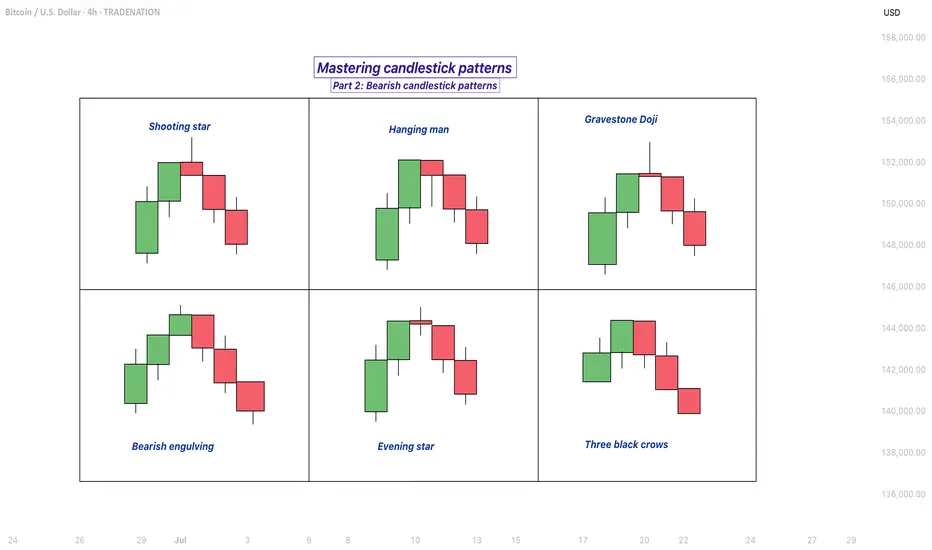
Mastering bearish candlestick patterns - How to use it!Bearish candlestick patterns are a cornerstone of technical analysis, relied upon by traders across financial markets to assess the likelihood of price reversals or continued downward trends. At their core, these patterns are visual representations of shifts in market sentiment, formed by the open, high, low, and close prices over one or several trading sessions. When recognized accurately and interpreted in context, bearish candlestick setups can alert market participants to the fading strength of buyers and the increasing presence of sellers, which often precedes downward price movements. Expanding on this, a comprehensive understanding of each pattern’s nuances, psychological underpinnings, and optimal trading applications can significantly enhance a trader’s analytical toolkit.
What will be discussed?
- What is a shooting star?
- What is a hanging man?
- What is a gravestone dojo?
- What is an evening star?
- What are the three black crows?
- How to trade the bearish candlestick patterns?
Shooting star
The shooting star pattern stands as a prominent candlestick configuration foreshadowing potential bearish reversals after an uptrend. This single-candle pattern is distinguished by a small real body situated near the lower end of the price range, a long upper shadow that is at least twice the length of the body, and little to no lower shadow. The psychological narrative implied by the shooting star is compelling: buyers initially control the session, pushing prices sharply higher, but by the close, sellers have overwhelmed this optimism, pulling the price back down to near or below the opening point. This abrupt shift in control suggests that the bullish momentum is waning, priming the market for a price correction or reversal.
Hanging man
The hanging man, while visually similar to the hammer pattern of bullish reversals, is distinctly bearish because of its position at the top of an established uptrend. This single-candle pattern features a small body at the upper part of the trading range and a markedly long lower shadow, again with minimal or absent upper shadow. During the session, substantial selling pressure drives prices down, accounting for the extended lower shadow, yet buyers temporarily regain some control, recovering much of the loss by the close. Despite this late-session recovery, the appearance of the hanging man warns traders that sellers are growing more aggressive – especially if the next candle confirms the weakness with a lower close.
Gravestone doji
A classic and somewhat ominous formation, the gravestone doji is a specialized form of doji candlestick that carries even greater weight when it appears after a rising market. Here, the open, close, and low are all clustered near the session’s low, forming a long upper shadow with no lower shadow. This structure vividly illustrates a dramatic shift in sentiment: buyers propel prices higher during the session, only to be met by intense selling which pushes prices back to the opening level by the close. This failed rally, marked by the upper wick, reflects the exhaustion of buying interest and the potential onset of bearish dominance.
Bearish engulfing
Turning to multi-candle setups, the bearish engulfing pattern is a powerful, two-bar reversal pattern. The initial candle is bullish and typically a continuation of the prevailing uptrend, but the second candle is bearish and must open above and close below the body of the first candle, “engulfing” it completely. The transition from a relatively small upward move to a much larger downward move highlights a rapid escalation in sell-side enthusiasm. Importantly, the larger the second candle and the greater the volume accompanying it, the more reliable the signal.
Evening star
The evening star expands the analysis further into a three-candlestick formation, representing a storyline of shifting market dynamics. The pattern commences with a long bullish candle, followed by an indecisive small candle (the star) that gaps above the previous close, and concludes with a large bearish candle that closes deep into the first candle’s body. The evening star is especially meaningful because it narrates a transition from bullish exhaustion to bearish control over three sessions, making it a robust signal of a pending trend reversal. The reliability of the evening star increases if the bearish candle is accompanied by high volume, confirming a surge in selling pressure.
Three black crows
Among the most striking bearish signals is the three black crows pattern. It comprises three consecutive large bearish candles, each opening within the body of the previous candle and closing successively lower. This pattern demonstrates relentless selling over several sessions, erasing prior gains and indicating that bearish sentiment is in full swing. Collectively, the three black crows can shift market psychology significantly when they appear after a lengthy uptrend, especially if accompanied by increased trading volume.
How to trade the bearish candlestick patterns?
Effectively using bearish candlestick patterns in a trading strategy requires more than mere recognition of shapes. The context in which these patterns emerge matters greatly; traders should analyze preceding price action, the scope of the trend, and any converging signals from other technical tools such as momentum oscillators or volume indicators. Confirmation is a best practice, waiting for a subsequent session that continues in the bearish direction can filter out false signals and decrease the chances of whipsaw trades.
In practice, traders may use these patterns to identify short-selling opportunities, define entry and exit points, or adjust stop-loss levels to protect profits as a trend appears to reverse. Risk management is crucial, as no pattern is infallible. Position sizing, stop-loss placement, and ongoing evaluation of the broader market environment all contribute to the prudent use of candlestick analysis. By integrating these patterns into a comprehensive market analysis framework, traders are better positioned to interpret crowd psychology, anticipate significant reversals, and navigate the complexities of price movement with a higher degree of confidence and skill.
-------------------------
Disclosure: I am part of Trade Nation's Influencer program and receive a monthly fee for using their TradingView charts in my analysis.
Thanks for your support. If you enjoyed this analysis, make sure to follow me so you don't miss the next one. And if you found it helpful, feel free to drop a like 👍 and leave a comment 💬, I’d love to hear your thoughts!
Gravestonedoji
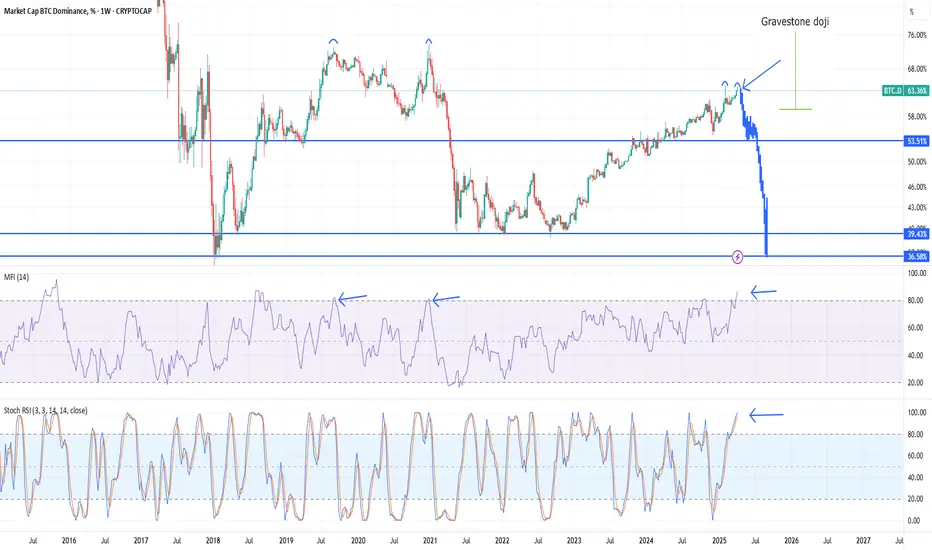
''Altseason 2025''Welcome back dearest reader,
I will probably get alot of backlash from bitcoin maxi's for writing this post, i have read and heard it all by now. I'm not disregarding their opinion on bitcoin and i think it will do well, but not as well as some altcoins which i have monitored.
First the technical part:
~Bitcoin has seemingly formed a double top pattern with now on the weekly a gravestone doji (confirming this sunday). Looking at previous action from 2019 and 2020, these have been topping indicators and indicate a bearish reversal which in turn will be bullish for altcoins.
~ MFI --> massively overbought.
~ Stoch RSI --> nearly at 100! Screaming for a reversal.
Over the past months everyone seemed to think ''this is the top, only to see dominance rise further and alts bleeding''. It is possible that BTC.D doesn't correct immediately, but i do suspect an altseason to be really close.
Sentiment: When everyone... i mean EVERYONE is bearish. ''Alts to zero'', ''bitcoin is the only good coin'', ''Ethereum is dead''. This has historically been the perfect time to buy. And that time is now.
''But, there are over 13 million altcoins now!''
Yes this is true, i don't think all of them are going to do well, stick to the ones available on big exchanges. Those have 400 different ones on average. From those i have covered some allready which i think are going to do well, it's worth your time to look at those ideas.
Any questions?
Ask.
~Rustle
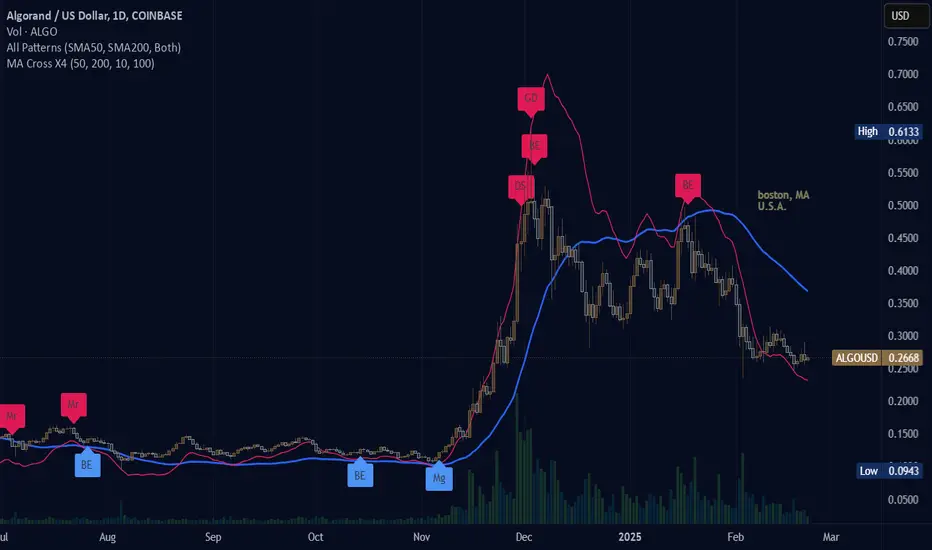
(ALGO) ALGORAND "gravestone doji"At the peak of price of Algorand the chart pattern formed a gravestone doji candle before depleting and falling into the reckoning wave of losses along with most other cryptourrency.
SPY: Beware of These Reversal Patterns!In the daily chart of the SPY, a potential double top pattern is forming, signaling a bearish reversal. The key resistance level for this pattern is around 550.12, where the price has failed to break through on two recent occasions, marked by red arrows.
This level is critical for traders to watch as it represents a significant hurdle for any upward momentum. If SPY fails to close above this resistance, it might lead to a bearish breakdown towards the neckline support at 542.62. A break below this level would confirm the double top pattern, potentially leading to a further decline towards the next support around 533.07.
On the weekly chart, a gravestone doji pattern has emerged, a strong bearish reversal signal, especially after a sustained uptrend. This pattern indicates that buyers were unable to maintain higher prices, leading to a close near the week's low.
The gravestone doji, appearing near the resistance level around 550.12, reinforces the bearish outlook suggested by the daily double top pattern. If the bearish sentiment persists, the first significant support to monitor is the 21-week EMA, which has historically provided dynamic support during uptrends.
Integrating the daily and weekly charts, SPY is at a crucial juncture. The double top pattern on the daily chart and the gravestone doji on the weekly chart both indicate potential bearish pressure. If you are bullish, a decisive close above 550.12 would invalidate the double top and suggest a continuation of the uptrend. However, the current technical indicators favor a bearish scenario, with the potential for a significant correction if key support levels are breached. For now, we should closely monitor these critical levels to gauge SPY's next move, balancing the bearish signals with the potential for bullish invalidation.
For more detailed technical analyses and insights like this, be sure to follow my account. Your support helps me continue providing valuable content to help you make informed trading decisions.
Remember, real trading is reactive, not predictive, so let's stay focused on the key points described above and only trade when there is confirmation.
“To anticipate the market is to gamble. To be patient and react only when the market gives the signal is to speculate.” — Jesse Lauriston Livermore
All the best,
Nathan.

Japanese Candlesticks - Doji CandlesAs traders, if we want to improve our technical analysis knowledge to better develop our price action skills, we owe it to ourselves to grasp candlestick patterns, in this case the Doji candlestick pattern.
This post will go into further detail about this unique candlestick group and will also explain the psychology behind these patterns and how they can affect future price movements in the market.
Before we go into further detail about doji candles, there are times this post will mention the words: 'OPEN PRICE, 'CLOSE PRICE, 'HIGH PRICE, 'LOW PRICE, 'UPPER WICK, 'LOWER WICK, and 'BODY.' So what are these?
OPEN PRICE: Open means a candlestick's first price when it started.
CLOSE PRICE: Close means a candlestick's last price when it ended.
HIGH PRICE: High means how high the price went during that candlestick.
LOW PRICE: Low means how low the price went during that candlestick.
UPPER WICK: An upper wick forms when the high price of the candlestick is higher than the close price (bull candle) or open price (bear candle) of the period.
LOWER WICK: A lower wick forms when the low of the candlestick is lower than the close price (bear candle) or open price (bull candle) of the period.
Body: The visual difference between the candlestick's open and close prices.
What is a Doji candlestick?
The Doji Japanese candlestick pattern is a class of single-bar indecision patterns whose open and close prices are either identical or close to identical and therefore either do not have bodies or have very small bodies. A doji candlestick pattern generally suggests indecision or uncertainty in the markets. The reason for this is because of the psychological meaning behind a doji candle. As previously mentioned, all doji candles' open and close prices are either identical or close to identical, meaning that during the time of the candle's formation, buyers (bulls) and sellers (bears) were both at a complete standoff and neither one came out on top.
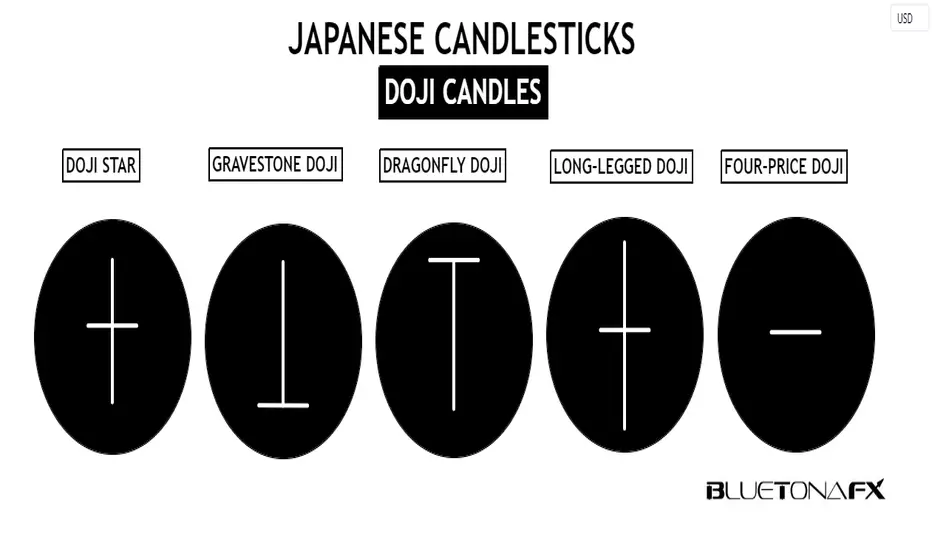
There are different types of doji patterns depending on where the open and close prices are, and these types are known as: doji star, gravestone doji, dragonfly doji, long-legged doji, and four-price doji.
Technical traders use the 'doji' term to refer to all of the above patterns but specifically call out a doji by its proper name when they want to be more specific, e.g., a dragonfly doji.
Doji Star
The doji star (also known as 'standard doji' or 'neutral doji') is a pattern that is composed of an upper and lower wick on either side of the opening and closing price that are approximately the same length.
The doji star’s main features are:
Identical or close to identical opening and closing prices.
The upper wick and lower wick are approximately the same length.
Overall, it has a cross shape.
It indicates indecision: the market hesitates between two directions.
When a doji star appears at the top of a bullish swing or at the bottom of a bearish swing, this is seen as a sign that there may be a possible change in the trend. The reason for this is due to the neutral formation of the candle and what it means psychologically: this candle pattern tells us that buyers and sellers were completely equal; it is not possible at this moment to judge which side of the market has the upper hand, so if a doji star appears near the top or bottom of a trend swing, then it is possible that there may be hesitation or uncertainty to continue the trend.
Gravestone Doji
The gravestone doji pattern is formed by a candle that has only the upper wick. This indicates that the price tried to move higher but failed to do so and closed at a price identical to or close to identical to both the open and low prices.
The gravestone doji’s main features are:
A long upper wick.
No lower wick
Open and close prices are identical or close to identical to the low price.
Overall, the pattern has an inverted 'T' shape.
This pattern is most significant at the top of a bullish swing.
It indicates indecision; this has a more bearish bias because of the upside rejection of the high price from the sellers.
The psychology behind the gravestone doji usually indicates that the buyers might be losing power because they can no longer drive the price up and the sellers might be in control. When a gravestone doji pattern appears, especially at the top of a bullish swing, this is seen as a positive sign that there may be a possible change in the trend.
Dragonfly Doji
The dragonfly doji pattern is formed by a candle that has only the lower wick. This indicates that the price tried to move lower but failed to do so and closed at a price identical to or close to identical to both the open and high prices.
The dragonfly doji’s main features are:
A long lower wick.
No upper wick.
Open and close prices are identical or close to identical to the high price.
Overall, the pattern has a 'T' shape.
This pattern is most significant at the bottom of a bearish swing.
It indicates indecision; this has a more bullish bias because of the downside rejection of the low price from the buyers.
The psychology behind the dragonfly doji usually indicates that the sellers might be losing power because they can no longer drive the price down, and the buyers might be in control. When a dragonfly doji pattern appears, especially at the bottom of a bearish swing, this is seen as a positive sign that there may be a possible change in the trend.
Long-legged Doji
The long-legged doji pattern is just like the doji star, but with a longer upper and lower wick on either side of the opening and closing price. This pattern suggests not only market uncertainty but also more market volatility due to the longer wicks on either side.
The long-legged doji's main features are:
Identical or close to identical to the open and close prices.
The long upper wick and the long lower wick are approximately the same length.
Overall, it has a cross shape.
It indicates indecision and higher volatility; the market hesitates between two directions.
Four-Price Doji
The four-price doji pattern (also called 'doji of four prices') is the rarest doji pattern type; it is extremely rare on the chart, especially on the higher time frame charts. It represents a straight horizontal line (only the body, without any upper and lower wicks). The pattern is formed when all four prices are the same: open, high, low, and close.
The four-price doji's main features are:
Completely flat horizontal body with no upper or lower wick.
Overall, it has a 'dash' shape.
Open, high, low, and close prices are all identical.
As rare as this doji pattern is, it does form from time to time. This happens either on very low-liquid assets or when volumes severely drop on the market, for example, during holidays or near the start or close of a trading session.
Be careful with short time frames!
Doji candles appear far too often in shorter timeframes; traders on short-term timeframes do not generally take them as serious signals for predicting future price movements. Doji candles on shorter time frames are not as psychologically impactful as doji candles that form on longer-term charts. A big reason for this is due to the fact that it is a lot easier for a doji candle to develop in a shorter time frame than in a longer one. For example, it is far easier for a one-minute candle to have an identical or close to identical open and close price than it is for a daily candle to have an identical or close to identical open and close price. Additionally, short-term timeframes feature a lot of price noise, which can be confusing for traders.
EURUSD 1 Minute Chart
As you can see in the image above, doji candles appear too many times in the shorter time frames to be effective.
Advantages and Disadvantages
With all technical analysis methods in the financial markets, there are advantages and disadvantages to them, and doji candle patterns are no different. The advantages and disadvantages of doji candle patterns are:
Technical traders use Japanese candlestick patterns to help understand and predict future price movements. Doji candles can be very effective in doing this, and traders should pay attention to them when they form on their charts as they can provide potential trading opportunities. However, due to their limitations, traders should use additional technical analysis methods alongside any doji pattern to predict future price movements. Doji candles are indecision candles and therefore do not guarantee trend reversals, but make sure you are cautious of them, observe them, and, most importantly, learn from them!
Trade safely and responsibly.
BluetonaFX
TSLA: Bull Trend Pullback - Watch Out for These Key Points!• Yesterday, TSLA did a Gravestone Doji candlestick pattern, just under the $191 resistance line, indicating a pullback;
• As I mentioned yesterday, any pullback to the $177 area wouldn’t be the end of the world, as the trend is still bullish (the link to my previous analysis is below this post, as usual);
• So far, it seems this is just a pullback, as there’s no bearish reversal structure on TSLA yet;
• If TSLA loses the $177, then it might frustrate the bullish sentiment;
• On the weekly chart, TSLA is still inside a Descending Channel, and it seems it found a resistance at the upper trend line again;
• Therefore, TSLA just reached a key resistance level this week. If it breaks this resistance in the next few days, we will see a meaningful bullish reversal pattern being triggered on the weekly chart, reversing the long-term bearish sentiment seen since 2021.
I’ll keep you updated on this. Remember to follow me to keep in touch with my daily analysis.

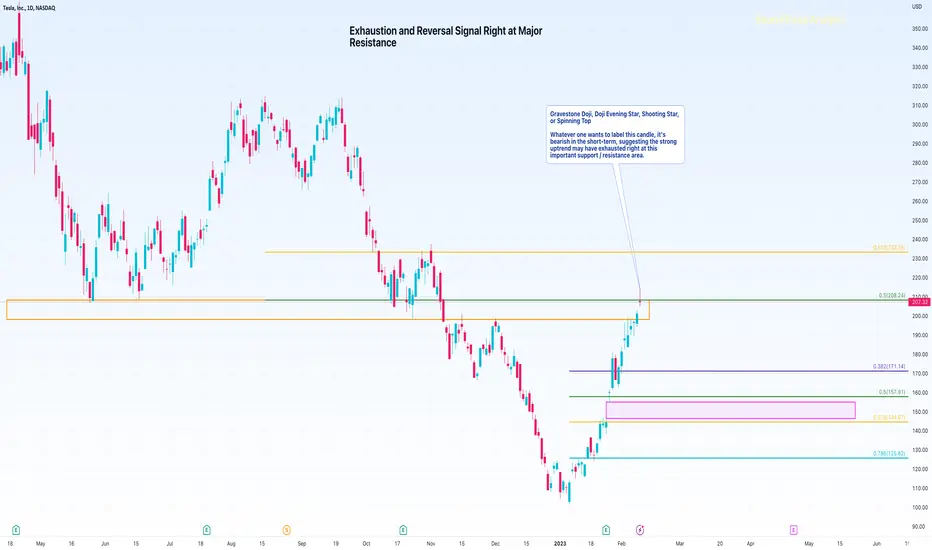
TSLA Looks Exhausted; Flashes a Reversal SignalA few months ago, SquishTrade wrote a bearish technical analysis on TSLA that forecasted a drop to a series of targets that were all reached. TSLA's downward move was more violent and rapid than anyone may have expected. Indeed, TSLA broke down from a huge head-and-shoulders pattern. Supplementary Chart A is the head and shoulders pattern that broke through its neckline in October 2022. It backtested and chopped for a bit, then fell like a stone. What seemed to be a move that would take several months to a year happened in about 2 short months.
Supplementary Chart A
Now, meme mania and the most-shorted stock list has lead the massive rally from October 2022 lows. This list includes stocks like TSLA, and investors filled with fear of missing out on the next massive moon event have piled into this stock. They've been helped by short-covering hedge funds who were like pigs lined up at the feeding trough but gorged a bit too long for their own health.
TSLA now looks exhausted. Note that this does not mean it heads straight back to lows. It could—it already made an unexpectedly massive down move from October to December 2022, and that was after a not so pretty decline in the first half of 2022. Markets and major stocks have been inflicting pain on traders of all stripes this year, so even if TSLA decides to make new lows underneath 2022 lows, it may not do so in an obvious or expected fashion.
Several technical points suggest that price will soon reverse. TSLA's price has likely exhausted this current rally higher. What happens next depends on the broader equity markets' direction, the nature of risk appetite relative to risk-free assets (government bonds such as the 10-year Treasury note, the 30-year Treasury bond, the macro environment (inflation, recession, price of money / interest rates) and TSLA's fundamentals as consumers' spending power likely begins to suffer from the rising price of money.
Note the orange rectangle, which is a major supply and resistance zone. Price has rallied right up to it without consolidating for any significant time beyond a day or two. This major resistance (formerly supply under the concept of parity) coincides with the 50% retracement of the last major wave of decline (green line).
A gravestone doji, evening doji star, shooting star, or spinning top has formed. Each candlestick pattern mentioned could be applied to this (perhaps the spinning top is a stretch). But the label isn't as important as what the implication it provides. It shows indecision right at a time when major resistance has been reached. Indecision is not the kind of state in which price action should be when it approaches such a significant level. But it arrived here too sharply, too fast. So it's exhausted right when it shouldn't be, right when extra momentum and vigor is needed for buyers to push through this level. Note that patterns containing the term "star" are not valid unless a third confirmation candle pushes down into the body of the candle that preceded the star.
A negative divergence appears using the Bollinger Bands. The divergence is more apparent using the %B indicator rather than the Bollinger Bands themselves. This shows that while price has made higher high on February 8-9, 2023, in terms of standard deviation, the high is actually a lower high as shown by the fact that the Bollinger Bands were not pierced by the highs over the last few days. Further explanations appear on Supplementary Chart B below.
Supplementary Chart B
Next, consider price targets, assuming price reverses here or a just bit higher. The most obvious target is the 50% to 61.8% retracement of the current rally. Those Fibonacci levels lie on either side of the huge gap fill area, another obvious target, shown by the magenta rectangle on the Primary Chart. The list of price targets follows:
Target 1: $200 (most conservative)
Target 2: $171.14 (somewhat conservative)
Target 3: $157.91 (moderately aggressive)
Target 4: $144.67 (fairly aggressive)
Target 5: $125.82 (aggressive)
No one can be certain in trading, investing, and forecasting. But traders can be sleuths, examining the charts for bits of evidence to see if they tilt the probabilities in one direction or the other. The probabilities here are tilted lower in the short-term and intermediate term. Yes, price could pull back and then make a higher high after that, or price could pull back and fall to retest / break December 2022 lows. A linear regression channel from the highs suggests that the downtrend could continue this year, but that is not as certain as the likelihood of a near term reversal and decline in price that ends the current rally.
Finally, consider the long-term view. The uptrend remains intact. But don't be deceived by that if you bought at $150-$180 over the last couple weeks and are counting your profits. The uptrend line remains down at $39-$45 depending on the time when it would be tagged (over the remainder of 2023).
Supplementary Chart C
________________________________________
Author's Comment: Thank you for reviewing this post and considering its charts and analysis. The author welcomes comments, discussion and debate (respectfully presented) in the comment section. Shared charts are especially helpful to support any opposing or alternative view. This article is intended to present an unbiased, technical view of the security or tradable risk asset discussed.
Please note further that this technical-analysis viewpoint is short-term in nature. This is not a trade recommendation but a technical-analysis overview and commentary with levels to watch for the near term. This technical-analysis viewpoint could change at a moment's notice should price move beyond a level of invalidation. Further, proper risk-management techniques are vital to trading success. And countertrend or mean-reversion trading, e.g., trading a rally in a bear market, is lower probability and is tricky and challenging even for the most experienced traders.
DISCLAIMER: This post contains commentary published solely for educational and informational purposes. This post's content (and any content available through links in this post) and its views do not constitute financial advice or an investment or trading recommendation, and they do not account for readers' personal financial circumstances, or their investing or trading objectives, time frame, and risk tolerance. Readers should perform their own due diligence, and consult a qualified financial adviser or other investment / financial professional before entering any trade, investment or other transaction.
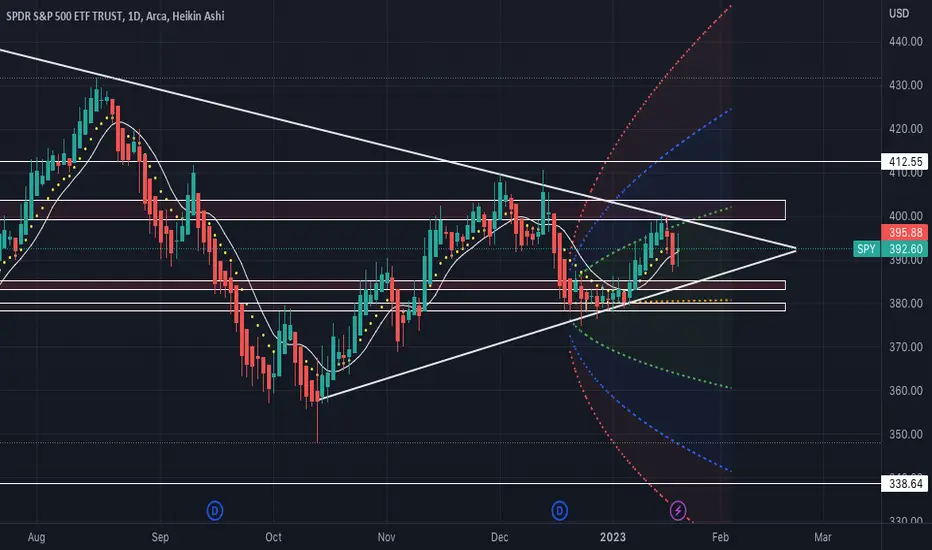
SPY FED BLACKOUT I don't have a solid prediction on direction going into tomorrow on SPY.
Im trying to stay neutral due to the daily candle being a absolute banger of a gravestone Doji....The line in the sand, the weird moment in tug of war when both sides are at a stand still and the wining team makes there move.
I am feeling like the bears will win this overall, however im also seeing quite a bit of buy pressure on the smaller timeframes. So I could see spy pushing up to the low 399 area and then making a continued move up , or a fast rejection of that level for a blow out back down to low 385 range.
This is a FED black out week , and major earnings week so I do predict this week will be pretty choppy with a lot of give and take on gains / losses.
Again im staying neutral and might not even trade tomorrow.
The main thing i will be looking at is the 9ema , and the 5sma getting pulled to the point of control as shown via volume.
Gravestone Doji-BTCUSDGravestone Doji Candlestick found on BTCUSD 1 HR Chart. For FMI (Forex Mastery Institute ) Studies.
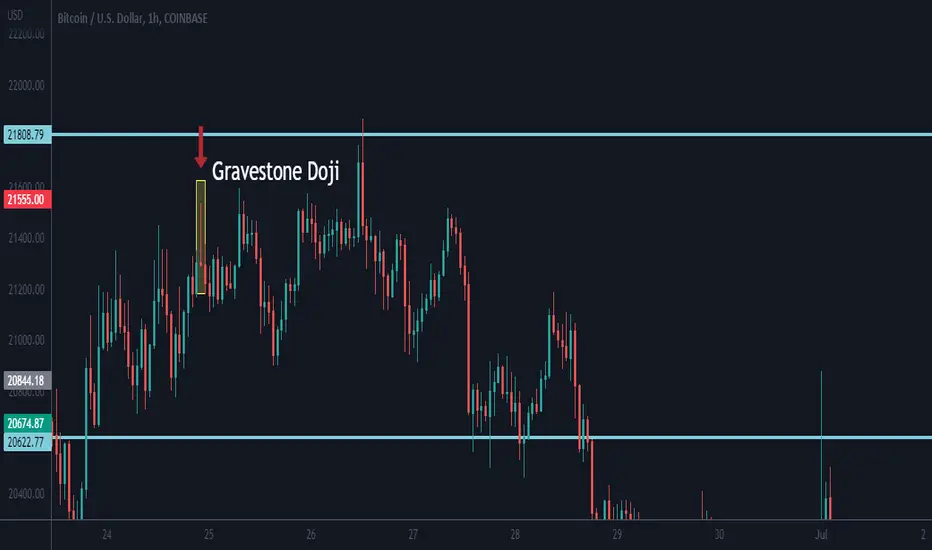
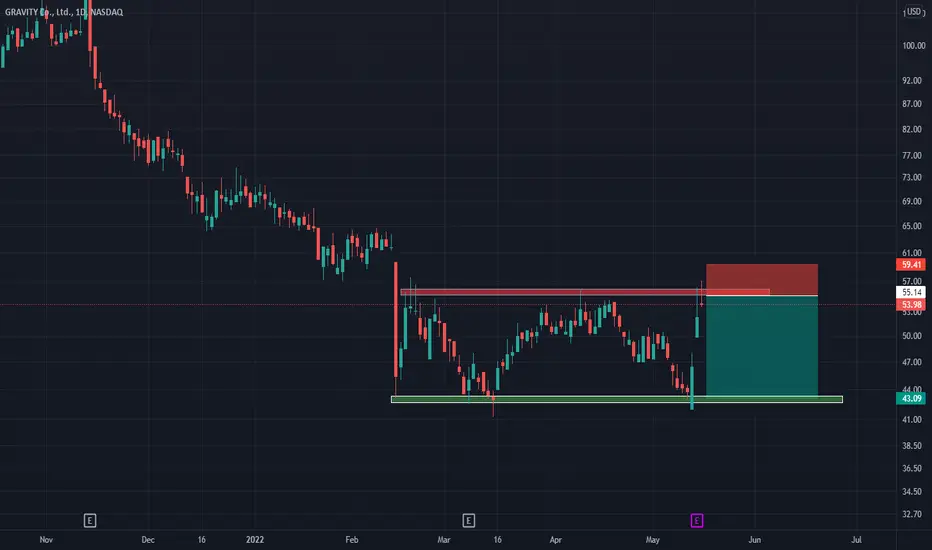
Proof that Gravity exists! Gravity
Short Term - We look to Sell at 55.14 (stop at 59.41)
Bespoke resistance is located at 55.00. A Doji style candle has been posted from the high. Our outlook is bearish. Selling spikes offers good risk/reward. The rally was sold and the dip bought resulting in mild net losses yesterday.
Our profit targets will be 43.09 and 41.20
Resistance: 55.00 / 60.00 / 65.00
Support: 43.00 / 40.00 / 30.00
Disclaimer – Saxo Bank Group. Please be reminded – you alone are responsible for your trading – both gains and losses. There is a very high degree of risk involved in trading. The technical analysis, like any and all indicators, strategies, columns, articles and other features accessible on/though this site (including those from Signal Centre) are for informational purposes only and should not be construed as investment advice by you. Such technical analysis are believed to be obtained from sources believed to be reliable, but not warrant their respective completeness or accuracy, or warrant any results from the use of the information. Your use of the technical analysis, as would also your use of any and all mentioned indicators, strategies, columns, articles and all other features, is entirely at your own risk and it is your sole responsibility to evaluate the accuracy, completeness and usefulness (including suitability) of the information. You should assess the risk of any trade with your financial adviser and make your own independent decision(s) regarding any tradable products which may be the subject matter of the technical analysis or any of the said indicators, strategies, columns, articles and all other features.
Please also be reminded that if despite the above, any of the said technical analysis (or any of the said indicators, strategies, columns, articles and other features accessible on/through this site) is found to be advisory or a recommendation; and not merely informational in nature, the same is in any event provided with the intention of being for general circulation and availability only. As such it is not intended to and does not form part of any offer or recommendation directed at you specifically, or have any regard to the investment objectives, financial situation or needs of yourself or any other specific person. Before committing to a trade or investment therefore, please seek advice from a financial or other professional adviser regarding the suitability of the product for you and (where available) read the relevant product offer/description documents, including the risk disclosures. If you do not wish to seek such financial advice, please still exercise your mind and consider carefully whether the product is suitable for you because you alone remain responsible for your trading – both gains and losses.
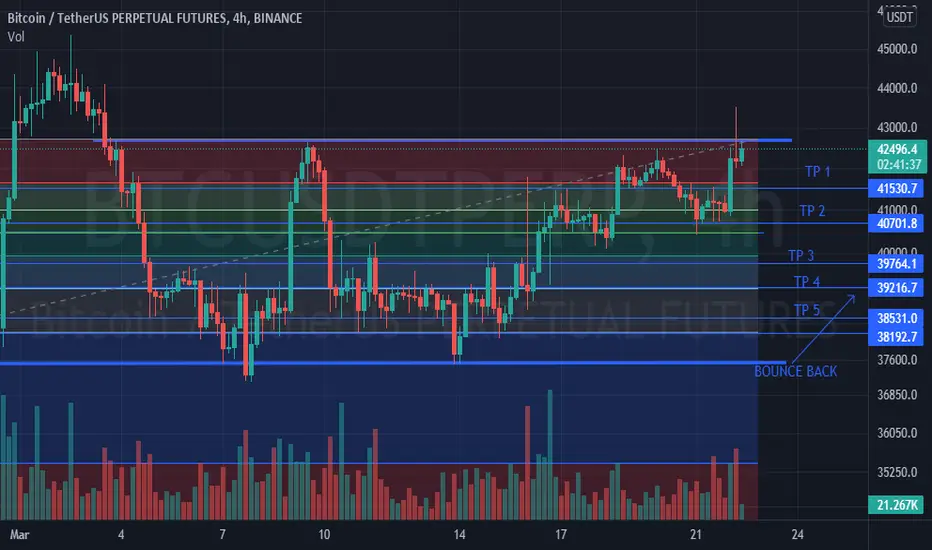
BTC 4H CHARTAs we can see, the current btc/usdt futures contract is forming gravestone doji, the long tail has been recognized and the rest will be confirmed after this candle if it goes as mentioned then we can see that btc will test all of its supports up to 38500 and we can see a bounce back from this level or before this if any fundamental come between......
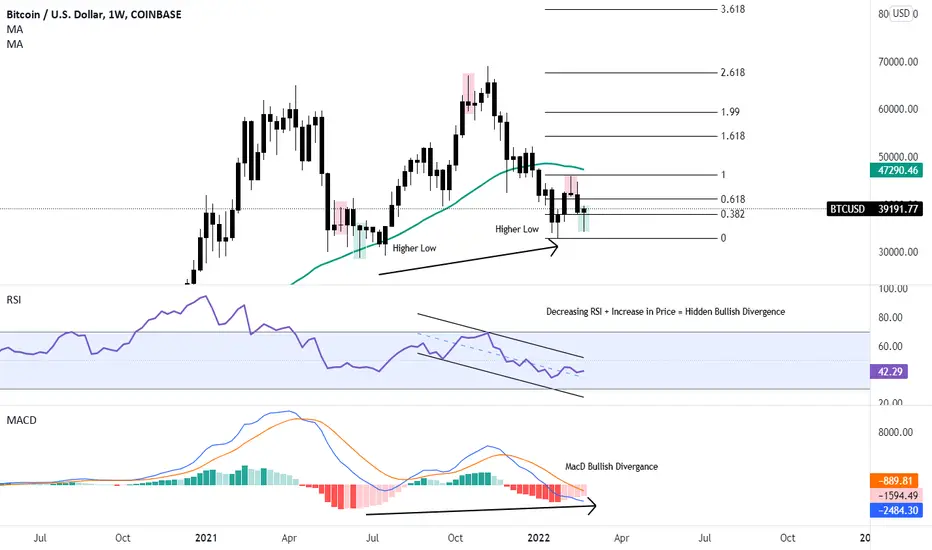
BTC Weekly Timeframe Analysis Chart
- BTC on the weekly timeframe. Weekly is not the strongest macro timeframe. Sometimes proves false signals.
Dragonfly / Gravestone Doji
- Highlighted in the green are the dragon fly doji's (recent signal doesn't close until Sunday)
- Highlighted in the red are the gravestone doji's
- Arguably the strongest significant Japanese Candle Stick for trend reversals.
Link: www.fxdayjob.com
RSI:
- Decreasing RSI + Increase in Price = Hidden Bullish Divergence
- Increasing RSI + Decrease in Price = Hidden Bearish Divergence
- Note that in summer of 2021 we had the same confluence in the chart.
MacD:
- Classic bullish divergence on the weekly.
- Note that bigger timeframes (Monthly, 2 week) are bearish.
Moving Averages:
- 50 Day $47,000
- 200 Day $20,000
Analysis:
- This is a high-risk trade b/c of current events.
- Fed is set to have a meeting regarding equities in March. (Likely to be very negative)
- I predict a further continuation rally here. May not bring us to ATH but, a recovery rally.
- Most importantly, do your own research. Strive to be a better trader every day.
SOLUSDT Long to retest 50Ma Hi everyone
Daily"
Rebound up from trend line.
Stoch RSI crossed up on over sold area. Strong sign of having had reached bottom daily looking to come back up and retest 50Ma. Possible price target $190 if gone over this resistance we can see a long move all the way to $240 if bulls keep on our side.
ALWAYS look for extra confirmation on any trade, Anything like a bullish or bearish candles such as the one we can see here "Grave stone Doji' for this small short.
Happy trading people!
(No financial advice)
DISCLAIMER
The trading ideas, analysis, and comments above should not be considered financial advice or recommendation to trade or invest in any financial product. Your personal situation has not been taken into consideration in the trade ideas. This page is for general educational purposes only. Do not buy or sell any product discusses on this page before doing your own research. Always do your own analysis and research and be aware of the risks involved in trading any financial product :)

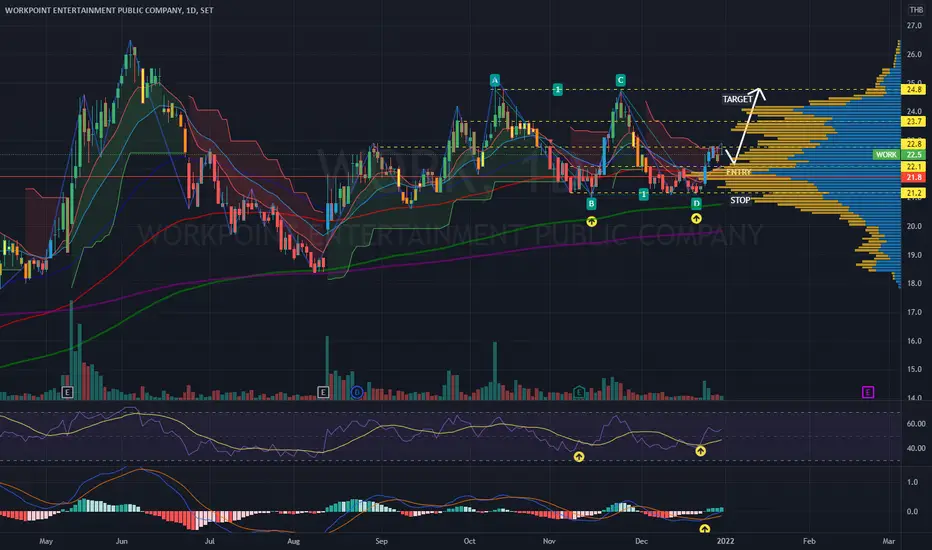
WORK | Harmonic ABCD | Entry @ Pullback |Gravestone DOJIWORK | Thailand SET Index | Media Sector | Price Action Trading
Chart Pattern: Harmonic ABCD Bullish Pattern
Price Action: Entry @ Pullback from bullish breakout with Gravestone DOJI candlestick
Stop-loss Position - 3 - 5% below Volume Profile POINT OF CONTROL
Risk Ratio: 3:1 minimum
Indicator:
> RSI bullish divergent crossover
> MACD golden crossing over baseline 0
Always respect your stop-loss
Good Luck
HNY 2022
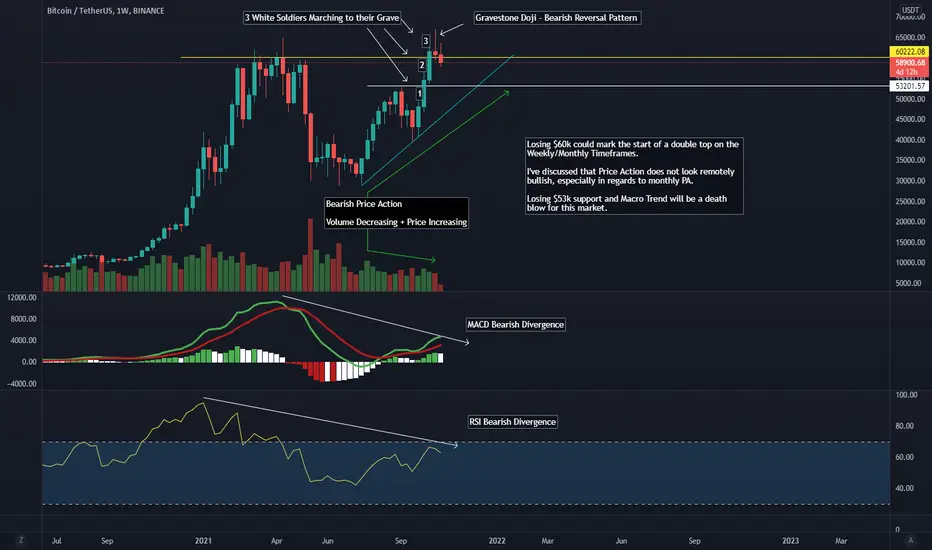
3 White Soldiers Marching to their GravesHello All,
Bitcoin is seeing some very bearish signs on the weekly chart. We had just seen 3 white soldiers pattern end with an ATH blow off top and grave stone doji. Historically this has marked the end of a run up.
Will it be the same this time?
In my opinion, I believe so. We are seeing a lot of bearish divergence on MACD/RSI. As well as bearish price action from 30k to 67k. Yes, we made an ATH but is this run sustainable for longer term growth? I believe not.
If 53k does not hold, our macro trend is at risk.
As always, be patient, use risk management, and good luck trading.
Solana reaches major Fib Channel Target (compare BNBUSD)This is basically a quickpost. The blue anchors show where both BNB and Sol have the fib log channels swing lows and a swing high point to define the fib log channel. Sol just closed at the op of the fib log channel 2 line. That is a very significant long term target after popping up out of a rising wedge. By my estimation most of the profits have already been made by going long. BNBUSD shows how powerful resistance at these levels can be.
There is a lot of clear bearish divergence on the MACD histogram and the volume and gravestone candle spell reversal. Yesterday's candle was already down over 17% from the high. To me that loudly states a lot of profit taking at the 2 line of the fib log channel
And just for the sake of the interested, here is your standard fib retracement. The golden pocket is often referred to the area between the 0.618 and the 0.65 retracement levels but I find that when doing retracements and extensions the 1.618 to 1.65 range works very well for targeting. And here he see it hit perfectly. I don't know what your trading system tells you. But mine says the upside is mostly gone.
Personally, I am not touching Sol in the near future. I have clearer entries on other tokens and coins that I think are closer to trending. In other words, I suspect this will chop around quite a bit. It is still pretty early but I would be watching for something like the chart below to play out. Fractal ABC corrections all over the place that could be played out technically for those interested. Of course, not financial advice and I am not a CMT.

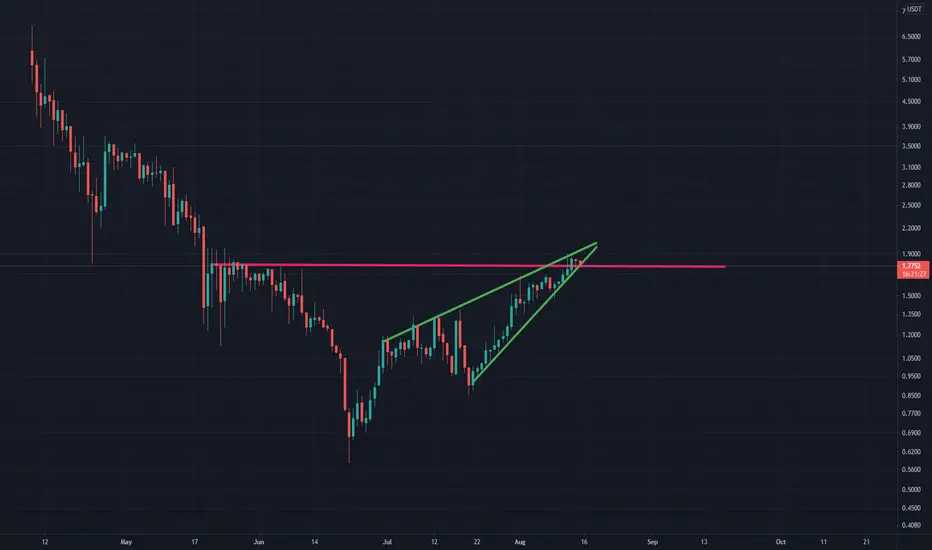
Pundix at a important point!Pundix is forming a rising wedge, which has a high probability to break down. The target would be 90 cents. We are also testing the resistance and support of 1.75 dollars.
One bad thing is supporting the rising wedge, Pundix is forming a gravestone doji, which indicates downside.
Hope I could help you,
yours Henrik.
Gravestone Doji on Weekly and Rising Wedge on DailyThis asset is looking weak on both the daily and weekly
we have a rising wedge on the daily and on the weekly we have a Gravestone Doji as seen here:
If we break down out of this wedge i will target the 0.786 and 0.886 retrace for profit taking.

Potential Gap fill to take us down 20%Price looks extended into resistance, after a huge gap up we saw a huge spike in volume.
Now it appears that the sell side volume is taking over as we have not had many green days since we got here and the MACD has given us our bearish crossover.
The weekly does not make make it look any better as we seem to have a confirmed Gravestone Doji on our weekly chart:
I believe we could see a huge drop in the coming days possibly to fill the gap below.

XAUUSD 15mTrade No. #02
''SELL MARKET ORDER''
Reasons for entering:
bearish bat
gravestone doji
evening star
Target: XAD

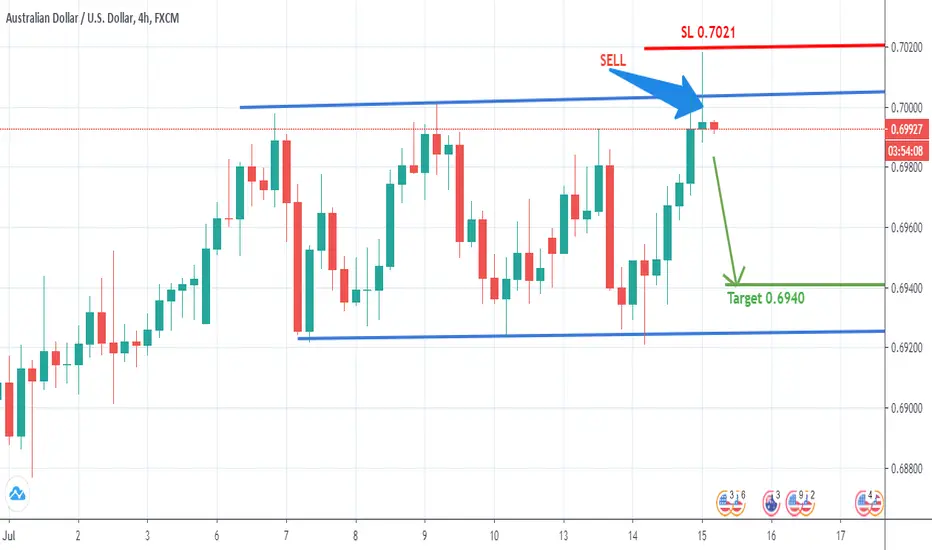
SHORT at Resistance on AUDUSD AUDUSD Price is at resistance and formed gravestone doji.
GO short at high with good RRR
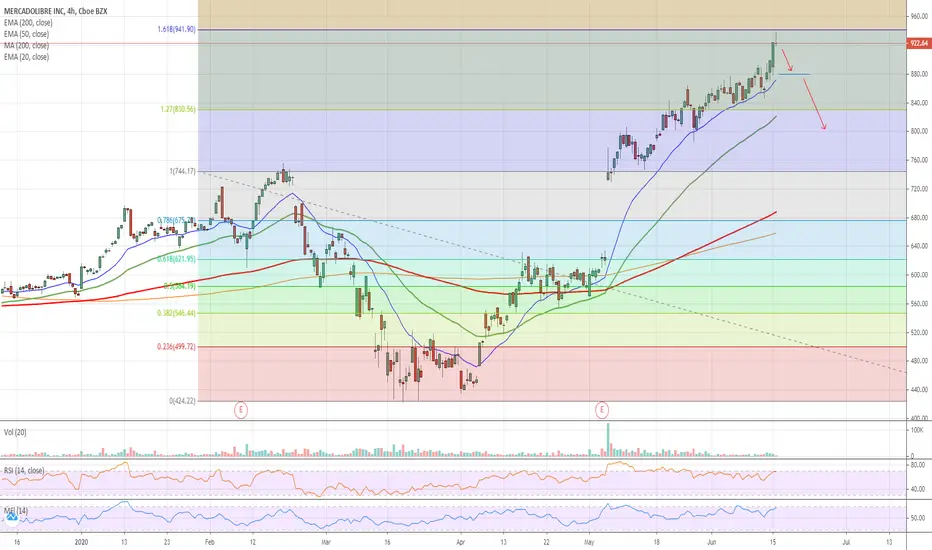
$MELI Hitting Resistance - Candle of Death$MELI Hitting Resistance - Candle of Death
Looking over-extended with the gravestone doji on 4 hr chart - finding resistance at the 1.618 fib level. High risk short play.
Short term target - $880.00
If 20d ema line is broken we could see $800 near term.
Note: Education analysis, not investment advice.