Griffain/USDT | Low-Risk Buy Setup with High Reward Potential!🚀 Trade Setup Details:
🕯 # Griffain/USDT 🔼 Buy | Long 🔼
⌛️ TimeFrame: 4H
--------------------
🛡 Risk Management:
🛡 If Your Account Balance: $1000
🛡 If Your Loss-Limit: 1%
🛡 Then Your Signal Margin: $56.63
--------------------
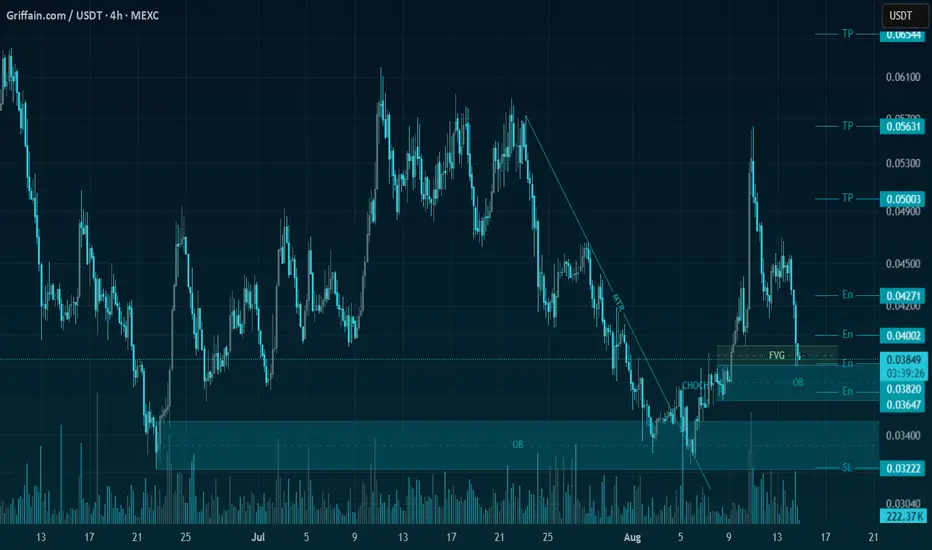
☄️ En1: 0.04271 (Amount: $5.66)
☄️ En2: 0.04002 (Amount: $19.82)
☄️ En3: 0.0382 (Amount: $25.48)
☄️ En4: 0.03647 (Amount: $5.66)
--------------------
☄️ If All Entries Are Activated, Then:
☄️ Average.En: 0.03913 ($56.63)
--------------------
☑️ TP1: 0.05003 (+27.86%) (RR:1.58)
☑️ TP2: 0.05631 (+43.9%) (RR:2.49)
☑️ TP3: 0.06545 (+67.26%) (RR:3.81)
☑️ TP4: 0.07924 (+102.5%) (RR:5.8)
☑️ TP5: 0.09786 (+150.09%) (RR:8.5)
☑️ TP6: Open 🔝
--------------------
❌ SL: 0.03222 (-17.66%) (-$10)
--------------------
💯 Maximum.Lev: 3X
⌛️ Trading Type: Swing Trading
‼️ Signal Risk: 🙂 Low-Risk! 🙂
🔎 Technical Analysis Breakdown:
This technical analysis is based on Price Action, Elliott waves, SMC (Smart Money Concepts), and ICT (Inner Circle Trader) concepts. All entry points, Target Points, and Stop Losses are calculated using professional mathematical formulas. As a result, you can have an optimal trade setup based on great risk management.
⚠️ Disclaimer:
Trading involves significant risk, and past performance does not guarantee future results. This analysis is for informational purposes only and should not be considered financial advice. Always conduct your research and trade responsibly.
💡 Stay Updated:
Like this technical analysis? Follow me for more in-depth insights, technical setups, and market updates. Let's trade smarter together!
GRIFFAINUSD
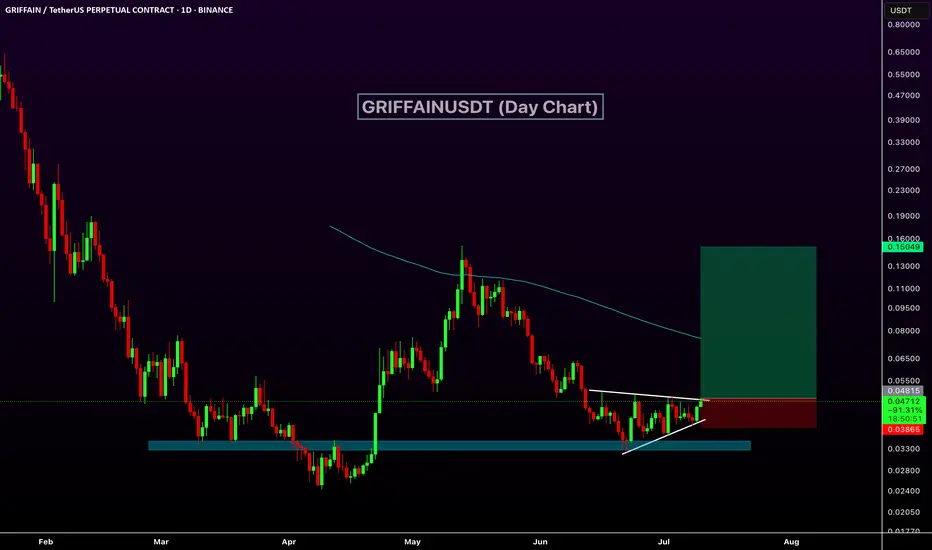
GRIFFAIN Chart Signals Bullish Rally$GRIFFAIN is forming a bullish ascending triangle pattern on the daily chart, signaling a potential breakout. Price is consolidating just below key resistance at $0.048, supported by a strong ascending trendline and a historical support zone.
A breakout above the triangle could trigger a sharp move toward the $0.15 level, offering a potential upside of over 100%-200%. The setup suggests growing bullish momentum and a possible trend reversal.
BITGET:GRIFFAINUSDT