GRIFFAIN/USDT NEW VOLUME INCREASE GRIFFAIN is showing a new trend in volume, which may be confirmed in the coming time frames. We will continue to monitor the trend to see if confirmation occurs.
GRIFFAINUSDT
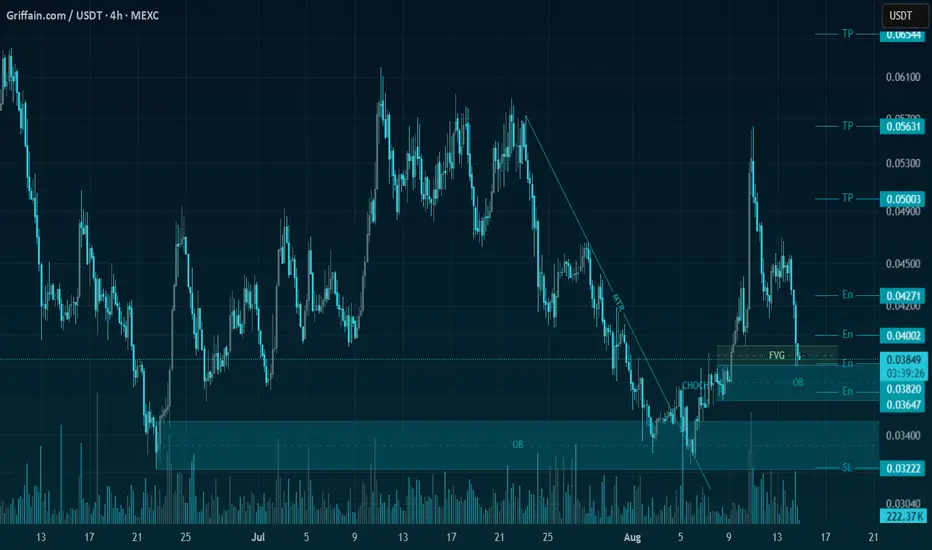
Griffain/USDT | Low-Risk Buy Setup with High Reward Potential!🚀 Trade Setup Details:
🕯 # Griffain/USDT 🔼 Buy | Long 🔼
⌛️ TimeFrame: 4H
--------------------
🛡 Risk Management:
🛡 If Your Account Balance: $1000
🛡 If Your Loss-Limit: 1%
🛡 Then Your Signal Margin: $56.63
--------------------
☄️ En1: 0.04271 (Amount: $5.66)
☄️ En2: 0.04002 (Amount: $19.82)
☄️ En3: 0.0382 (Amount: $25.48)
☄️ En4: 0.03647 (Amount: $5.66)
--------------------
☄️ If All Entries Are Activated, Then:
☄️ Average.En: 0.03913 ($56.63)
--------------------
☑️ TP1: 0.05003 (+27.86%) (RR:1.58)
☑️ TP2: 0.05631 (+43.9%) (RR:2.49)
☑️ TP3: 0.06545 (+67.26%) (RR:3.81)
☑️ TP4: 0.07924 (+102.5%) (RR:5.8)
☑️ TP5: 0.09786 (+150.09%) (RR:8.5)
☑️ TP6: Open 🔝
--------------------
❌ SL: 0.03222 (-17.66%) (-$10)
--------------------
💯 Maximum.Lev: 3X
⌛️ Trading Type: Swing Trading
‼️ Signal Risk: 🙂 Low-Risk! 🙂
🔎 Technical Analysis Breakdown:
This technical analysis is based on Price Action, Elliott waves, SMC (Smart Money Concepts), and ICT (Inner Circle Trader) concepts. All entry points, Target Points, and Stop Losses are calculated using professional mathematical formulas. As a result, you can have an optimal trade setup based on great risk management.
⚠️ Disclaimer:
Trading involves significant risk, and past performance does not guarantee future results. This analysis is for informational purposes only and should not be considered financial advice. Always conduct your research and trade responsibly.
💡 Stay Updated:
Like this technical analysis? Follow me for more in-depth insights, technical setups, and market updates. Let's trade smarter together!
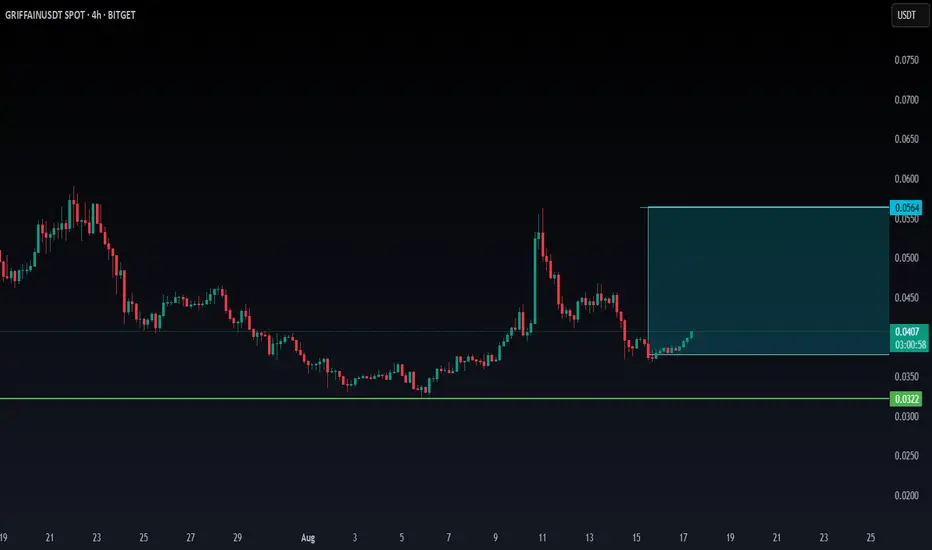
GRIFFAIN trading plan🟢 Available trading deal
📝 Currency $GRIFFAIN
✅ Entry points for the currency: at the current price of 0.04955 and the reinforcement will be at 0.04335
🔴 Stop loss is below 0.03595
💹 Potential targets: First target 0.0575 and if the currency enters a bullish wave, the target will be towards 0.0750 reaching up to 0.1250
📊 The profit-to-loss ratio is 5:1
📝 This idea is based on Elliott Waves analysis, especially after the rebound from 0.02431, the currency's low, and gaining support at 0.03595, which is a signal that Wave 2 has been formed, especially if the price action remains above the mentioned level
❤️ Good luck to everyone - do not enter any currency before studying the risk ratio you will undertake
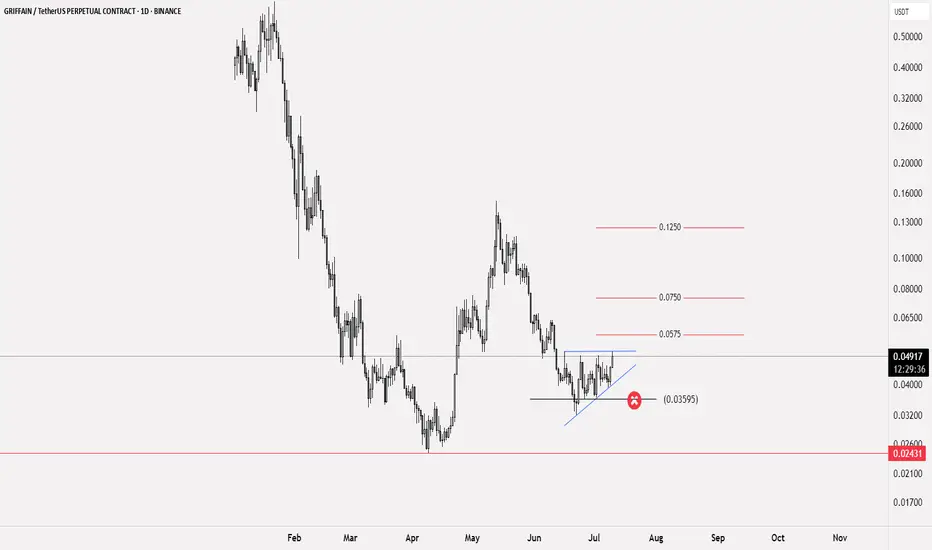
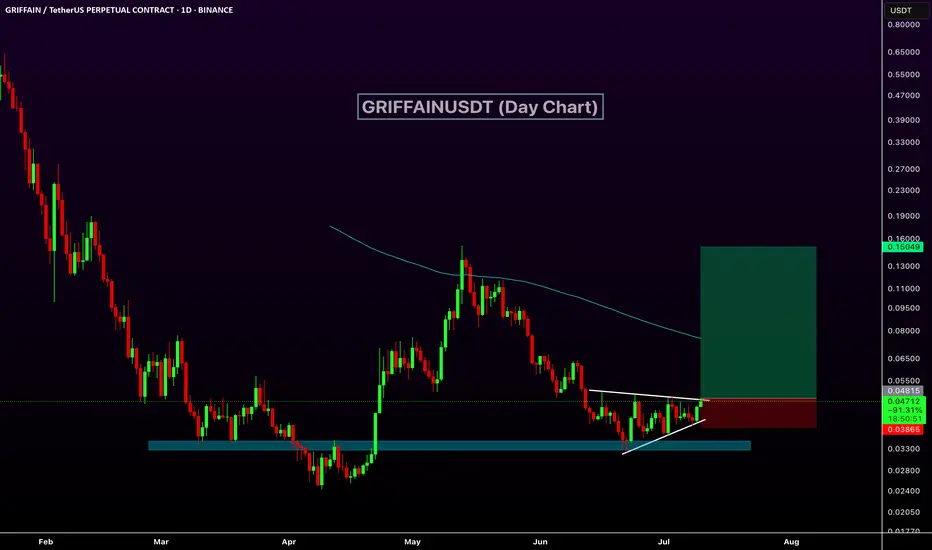
GRIFFAIN Chart Signals Bullish Rally$GRIFFAIN is forming a bullish ascending triangle pattern on the daily chart, signaling a potential breakout. Price is consolidating just below key resistance at $0.048, supported by a strong ascending trendline and a historical support zone.
A breakout above the triangle could trigger a sharp move toward the $0.15 level, offering a potential upside of over 100%-200%. The setup suggests growing bullish momentum and a possible trend reversal.
BITGET:GRIFFAINUSDT
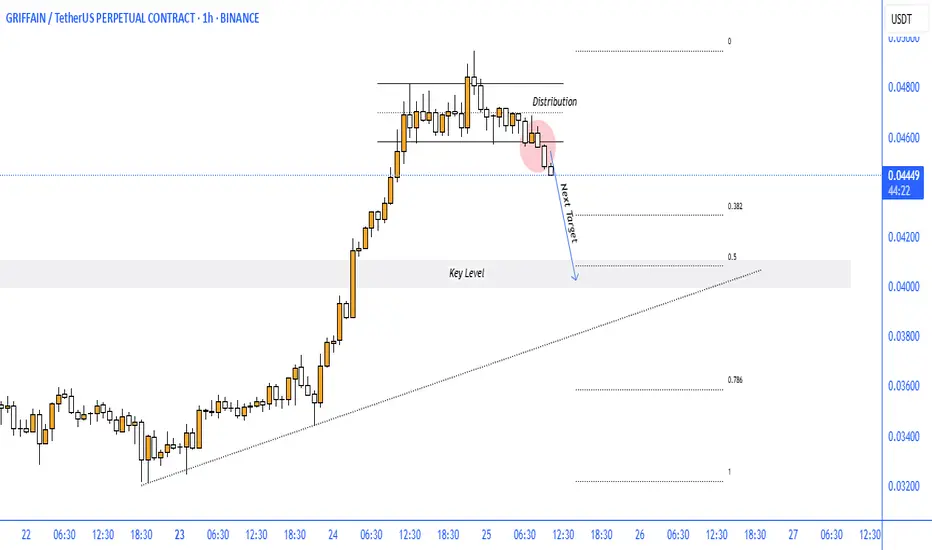
GRIFFAIN BEARISH SETUPGRIFFAIN/USDT (1H Chart) – Distribution Phase Signals Short-Term Bearish Reversal
The 1-hour chart of GRIFFAIN/USDT on Binance displays a distribution pattern at the recent high, suggesting bullish exhaustion and an imminent correction. Price has now broken below the consolidation range, confirming a shift in intraday sentiment.
🔍 Key Technical Insights:
Distribution Zone Formed: Price stalled at the top with several failed attempts to push higher, forming a range – a classic sign of distribution before reversal.
Bearish Breakdown: The bearish candle has breached support, initiating a potential downward move toward the 0.5 Fibonacci retracement level.
Key Level to Watch:
Next Target: $0.0400 (50% Fib level + historical demand zone)
Further Support: $0.0360 (Fib 0.786 region)
📉 Outlook & Expectations:
Short-term bias remains bearish below the $0.0458 zone. As long as price stays below the distribution range, expect continuation toward the $0.0400 support area, aligning with key structural and Fibonacci levels.
This setup is ideal for intraday or short-term swing traders watching for pullback entries or breakdown continuation.
SHORT #GRIFFAINUSDT expecting further downside📉 SHORT BYBIT:GRIFFAINUSDT.P from $0.12810
🛡 Stop loss $0.13193
⏱ Timeframe: 1H
✅ Overview:
➡️ BYBIT:GRIFFAINUSDT.P is showing weakness after reaching a local high, rejecting from a resistance zone.
➡️ POC (Point of Control) at 0.13193 acts as a key volume area with significant trading activity.
➡️ Price action suggests seller dominance, indicating a potential continuation of the downtrend.
➡️ If the 0.12810 support level breaks, expect an increase in bearish momentum.
⚡ Plan:
➡️ Short entry upon confirmation of a breakdown below 0.12810.
➡️ Increased selling volume will confirm the continuation of the bearish trend.
➡️ Holding the position with dynamic monitoring until the first Take Profit level.
🎯 TP Targets:
💎 TP 1: 0.11741 – first target based on the nearest support level.
📢 BYBIT:GRIFFAINUSDT.P is showing bearish signs, but volume and pullback dynamics should be monitored.
📢 A break below 0.12810 could trigger a deeper decline.
📢 If buyers show strength, watch 0.13193 as a possible reversal point.
🚀 BYBIT:GRIFFAINUSDT.P maintains bearish momentum — expecting further downside!

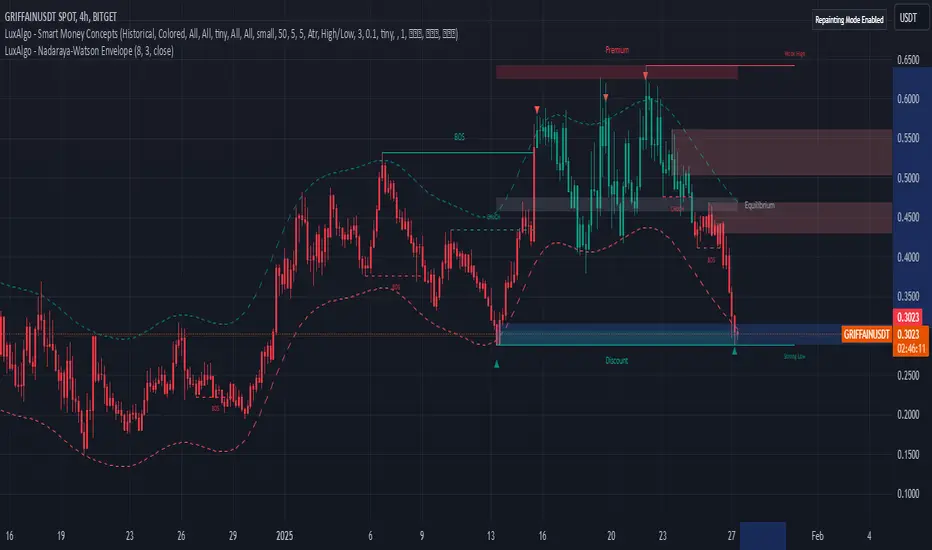
GRIFFAINUSDT Reversal Incoming! 100%+ Potential!🚀 GRIFFAINUSDT – A Prime Reversal Zone with Massive Growth Potential! 🚀
The market structure of GRIFFAINUSDT is showing clear signs of a potential bullish reversal, making this an exciting opportunity for investors looking to capitalize on a breakout rally.
📉 Current Market Sentiment:
The price has retraced into a strong demand zone, aligning perfectly with the Strong Low support level.
Historical price action suggests this level has previously acted as a reversal point, making it an ideal area for accumulation.
The discount zone further indicates a value-buying opportunity, as smart money often enters at such discounted levels.
📈 Bullish Signals:
Break of Structure (BOS) indicates the possibility of a trend shift.
The price is currently hovering near the Nadaraya-Watson Envelope’s lower band, a key dynamic support that has historically triggered upward momentum.
A move above equilibrium levels could ignite rapid upside movement.
🎯 Price Targets:
Short-Term: A swift 100% gain from current levels as buying pressure builds.
Long-Term: Given the supply-demand dynamics and previous price action, a surge toward $2–$5 is within reach as the market recovers.
💎 Investor Takeaway:
The current technical setup is incredibly favorable for a bullish reversal, and smart money is likely eyeing this zone for accumulation. With strong fundamentals and technical backing, this could be a golden opportunity to enter before the next explosive move!
🚀 Don't miss out on this potential moonshot! 🚀