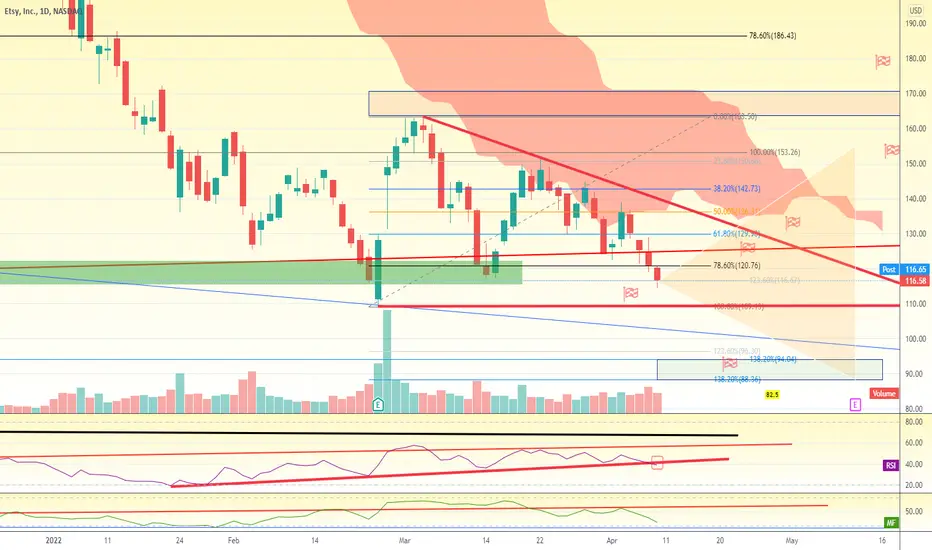
$ETSY Bearish close but good entry for swing or strangle @116.5Bearish daily close and sell RSI signal suggested further down move , however its good area for bounce targeting 120-136 . the idea is strangle here between 110-120 or 105-125 shall be profitable as expecting big move. logical scenario is going down up to earning then jump if results will be nice surprise otherwise the down trend will continue for further lower low.
Growth-stocks
FSLY - Showing strength in this moveHas claimed 11 EMA and VMA...holding well in the supply zone.
Once the 50 EMA is cleared, might go for gap fill @ 23

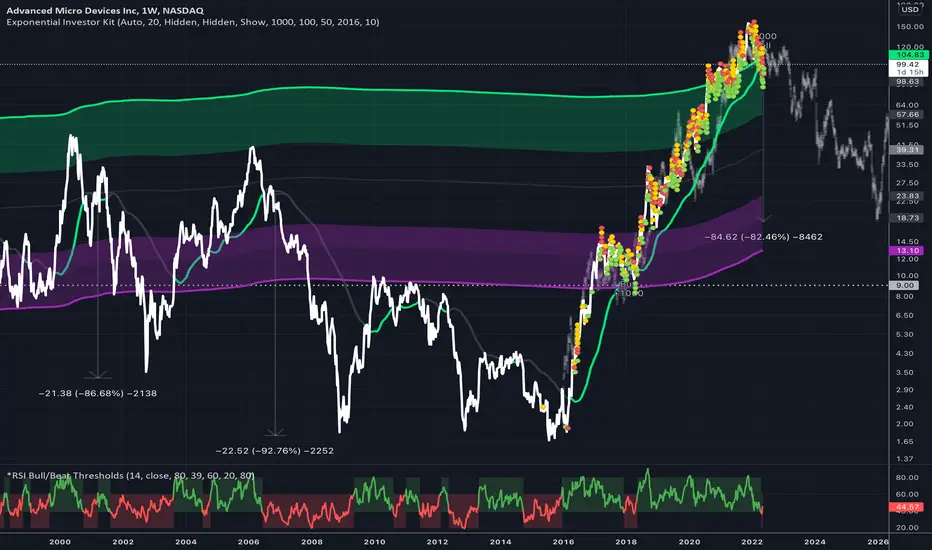
AMD - A Mighty Decline... to $18NOT SO BULLISH CASE
AMD today announced decent earnings and had a very good bounce off a small decline recently. Aided by less hawkish noises from the Fed mulling a 'soft landing', the market lapped it up - with AMD rallying almost 10% for the day. The reversal was quick and pronounced. With perhaps more juice to squeeze out of this green lime, it would need to reclaim and begin and sustain a new uptrend above $120 if the bull-trend is to continue.
BEAR CASE
With all that being said, there are many more reasons to be bearish . I therefore favour a short position in the region of $105, with a $120 stop-loss. Here is why:
1. TOP OF EXPONENTIAL CHANNEL
Firstly, there are an awful lot of similarities here when comparing us to May 1985. Beginning a recent breakdown below the 50 week MA trend line in the main chart, after a parabolic decade. We're also moving downwards generally from the top of the exponential channel. In the past, these movements have coincided with significant corrections for this stock as we'll explore. We recently lost the 50 MA, we've now just re-tested the underside of that, providing us with a great risk-reward entry of 8:1.
The bottom of the channel currently sits at $13 and a prior horizontal pivot point (dotted line) of $9 should also provide good support. Getting all the way to $13 would still represent a 82% decline from today's prices and 88% from all-time highs.
2. RSI BEAR ZONE
You'll also notice the 2nd indicator below, showing the RSI has just commenced and triggered a new bearish zone. Dropping below 40 on the weekly chart for the first time since November 2017. In future posts I will go into further detail as to how & why these custom indicators work. In the absence of this, it's still abundantly clear to see from prior periods in the RSI bear zone, that these have triggered significant declines over the years:
86% - May 1985 to November 1990 (5.5 years)
86% - July 2000 to October 2002 (2.5 years)
92% - May 2006 to December 2008 (2.5 years)
A decline of 82% from $105 to $18 should not be unexpected.
3. FRACTAL
Taking the same bar pattern from the 1975 to 1985 period and condensing it down into fewer years - we have generated similar logarithmic gains from 6 years instead of 10. This would also suggest a quicker but still slow'ish grind to the downside, potentially to as low as $18 by December 2025.
4. FUNDAMENTALS
With such huge shipping disruptions forthcoming in Asia, the market may still be unaware of the forthcoming impact on availability of product and therefore their manufacturing/foundry capabilities for the quarters ahead. On AMD's website discussing Supply Chain Responsibility, they reference that 80% of their manufacturing is done in Asia still to this day. They are very much dependent upon Taiwanese subcontractors. Even without any further deterioration in the conditions and the lockdowns in that part of the world, I would argue this as well as any other geopolitical issues have not been priced in to their forward performance. AMD is still priced to perfection.
Below are some of the risks they mention on their annual report, including many others (removed for readability):
Global economic and market uncertainty may adversely impact our business and operating results.
The loss of a significant customer may have a material adverse effect on us.
The ongoing novel coronavirus (COVID-19) pandemic could materially adversely affect our business.
The semiconductor industry is highly cyclical and has experienced severe downturns.
IT outages, data loss, data breaches and cyber-attacks could compromise our intellectual property or other sensitive information.
Uncertainties involving the ordering and shipment of our products could materially adversely affect us.
If we lose Microsoft ... our ability to sell our products could be materially adversely affected.
If we cannot adequately protect our technology or other intellectual property... we may lose a competitive advantage and incur significant expenses.
We rely on third parties to manufacture our products, and if they are unable to do so on a timely basis in sufficient quantities and using competitive technologies, our business could be materially adversely affected.
If essential equipment, materials, substrates or manufacturing processes are not available to manufacture our products, we could be materially adversely affected.
SUMMARY
As uplifting as the above sounds, there's an opportunity here for us. Let's come back and revisit this one in 6 months time. Even if you're not short, avoiding such a bad time to go long is advised! Crossing below the top of the green channel recently indicated to take profits and now we've just got a sell signal...so it's time to take it...
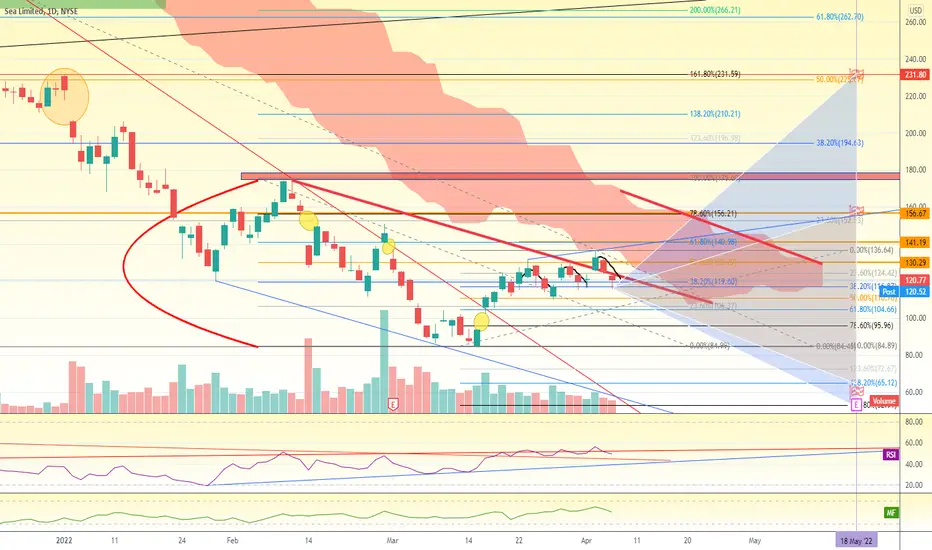
$SE Wild swing +/- 30$ up to earning report. now at 120Recent 3 peaks rejected from the red cloud as expected. now if it can go up thru that cloud and close above 135-136 again then targets will be 140-156-175 and can be extended to 210-230 if earning report surprised investors. ER will be at 22-5 ... from other side, support at 110-104-95 gap closing will works good as bounce levels. If break below 95 then possible to make lower low between 65-70 which is wild bearish target and will give investor very strong entry point for long term investment but unless market melt down this is not probable . more likely its for uptrend but could take sometime.
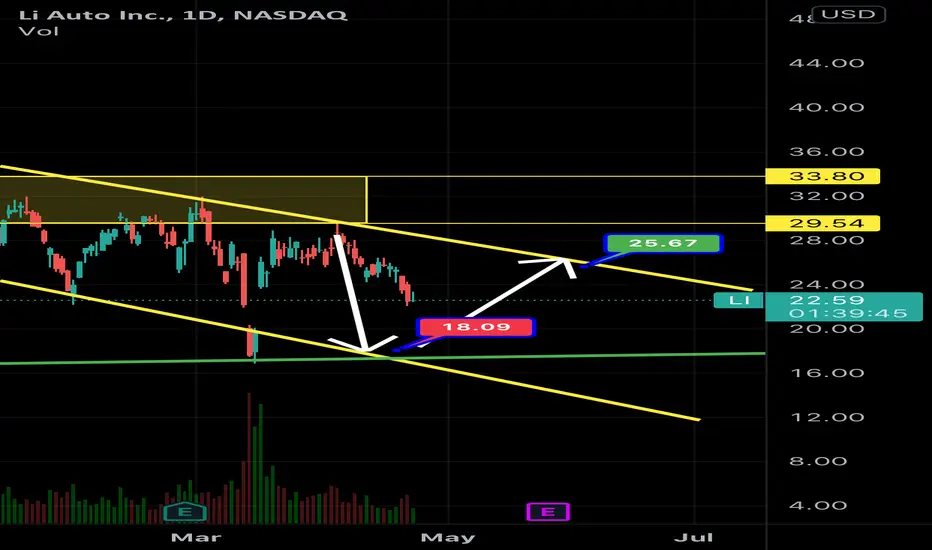
LI AUTOPrice still inside the yellow channel ,
(16.75$ -18$) is a good buying zone
We’re targeting : 25$ in the next 5 month
In general Li is one of the best electric car in china , having a great numbers ,
company for future
@REVENUE_JO
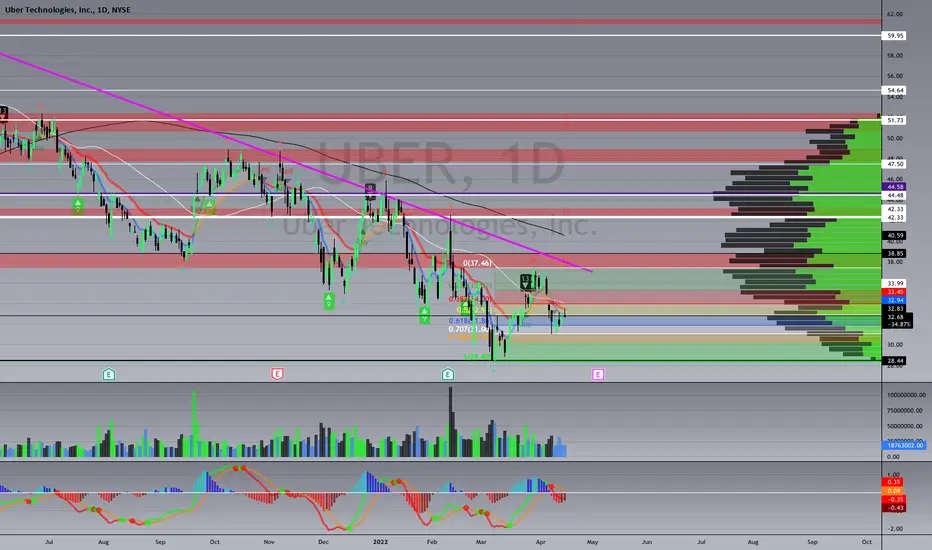
#UBER fib leveles #UBER so if the fib levels are correct from our most recent swing low we wicked that .768 level and bounced off for a potential short term opportunity for calls to the upside at the 34, 35, 36 strike as there is a huge level at 37.50, looking at some flow data 35 strike for the 20th of may has 67 thousand OI sitting on it now 40 has 41 thousand both of which are interesting to me. looks like most short dated contracts are looking at that May 20th date or the Jan 2023
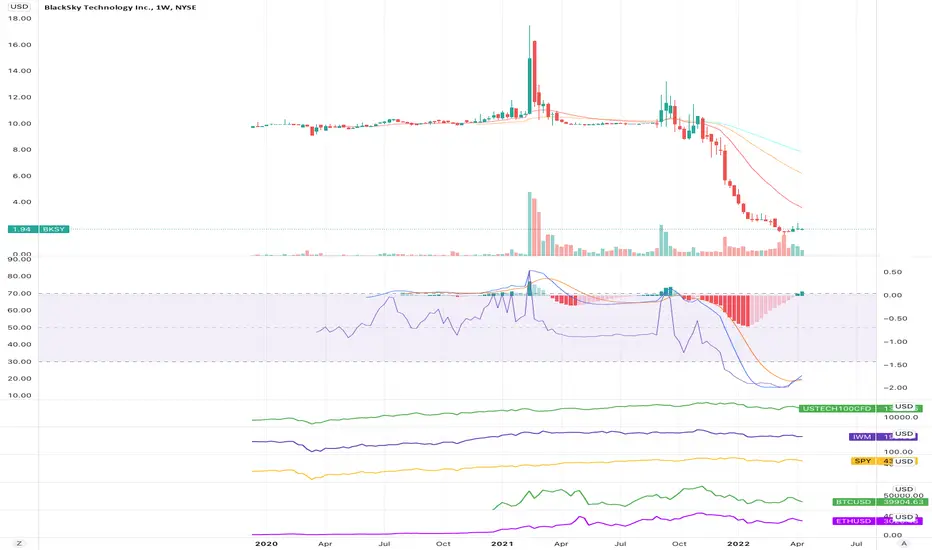
Added some shares at $1.80, back to $10 is a 5xCurrent Market Cap: $231.336M
EPS: -0.99
Recently this company launched satellites with Palantir's edge ai for faster image processing,
which is being used by governments to get a better understanding of war conditions,
so this is not just an empty worthless company, and is competing in a space with the likes of PlanetLabs.
Good risk to reward if buying at these levels.
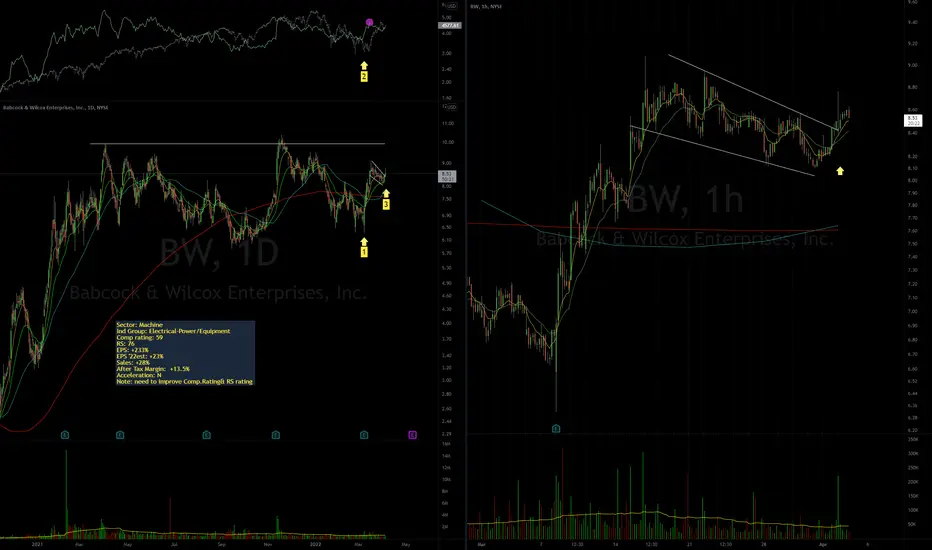
BW big base - big potential opportunity1. Nice rally on EPS report;
2. RS-line showed strength, meaning that the stock is Relative Strong and started to move before market bottomed.
3. Nice tight bull-flag. Still within bigger base but first constructive price action since basing started a year ago.
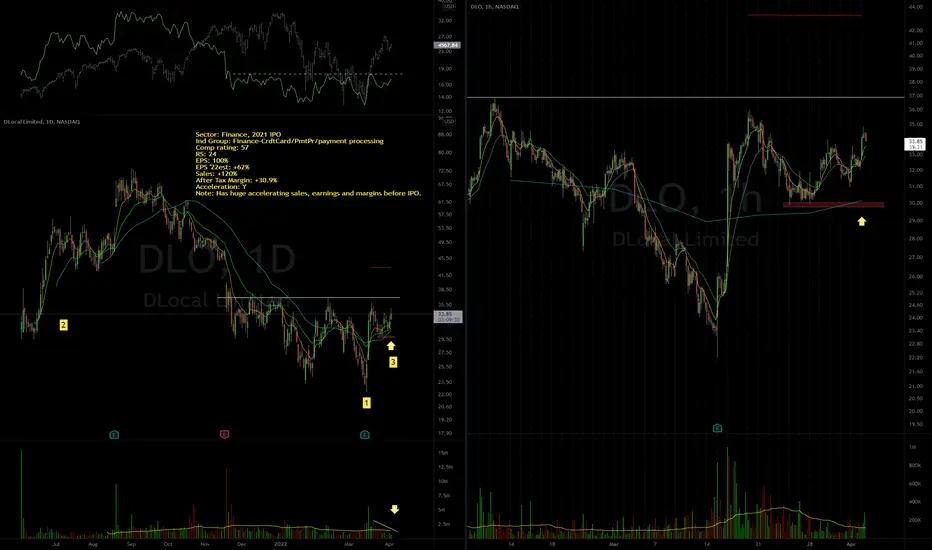
DLO transition phase into Stage 21. Strong rally on earnings report + volume increase. +100% Last Qr. EPS
2. Back into IPO price range
3. Price is consolidating constructively while volume is drying up.
Diamond bottom. All eyes on.Etsy has been a phenomenal stock and its been on a very nice downtrend since its top in November. LTF chart printing a lovely diamond bottom. Wait for breakout upwards or buy on next sign of weakness.
RSI coming into bullish territory.
AO showing low volatility so a big move is on the way.
Resistance @ .382 (162.65)
2YR/10YR spread close to inverting, keep your stops close.

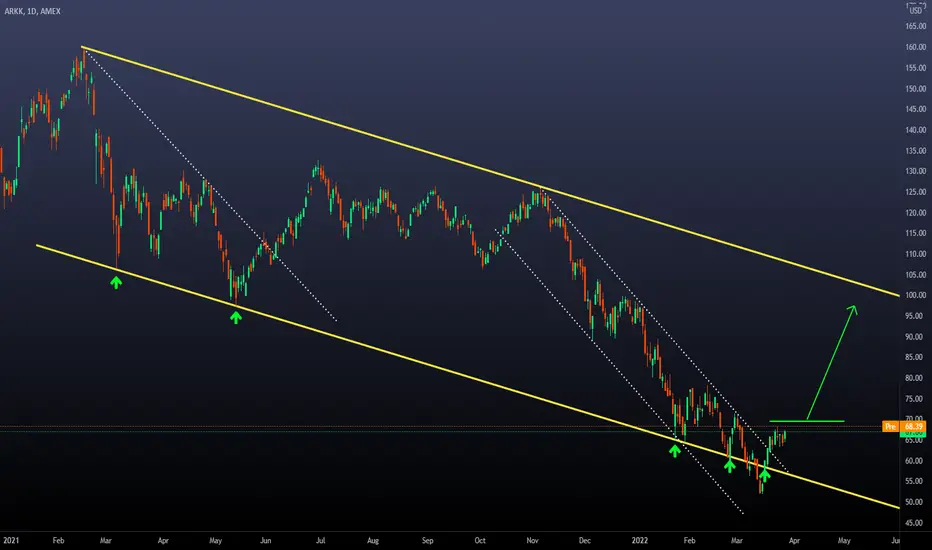
Is the bearish trend finished? ARKK.Today I will share my view on Cathie Wood's ETF and the pending setup I have.
* The main structure of the current situation is the yellow descending channel , where we have been observing several contacts there.
* The confirmation for me to start thinking about bullish opportunities happened when the inner descending channel was broken.
* After that, I decided to wait for 4 days of corrective movement (which had already happened) and define activation levels on a new high. (green horizontal line)
* The invalidation level or stop loss for this situation, if the price reaches my activation level, is 62.00. I will consider that my view was wrong; therefore, I close my position on a 1% loss.
*If the previous scenario is true, I will make a re-entry on a new local high, following the same concept as before.
*I'm doing this because I think the upside potential is really good ( target on the end of the green arrow ), which provides a risk to reward ratio of around 4.5. That's why I have a re-entry plan; even if I'm stopped out 3 times until I can catch the real movement, the setup would still be profitable.
Thanks for reading; feel free to share your view and comments on the chart.
Growth vs. Value: Skating to Where the Puck Will BeHockey legend Wayne Gretsky famously said: "Skate to where the puck is going to be, not where it has been." This sometimes applies in investing and trading.
Towards what object have investors been skating, figuratively speaking?
Currently, financial media, fund managers, and commentators have been emphasizing the opportunities in value over growth for several months. And for good reason: Energy, a value / cyclical sector unloved for about a decade, has outperformed every other sector this year by a huge margin. It has risen by approximately 20.5% since January 1, 2022. Even it's uptrend channel could not contain it (although it looks to be consolidating at the moment or perhaps mean-reverting).
Increasingly, market participants have been "skating" towards value areas and away from growth for over a year now, as anyone who has been burned by long trades in tech / disruptive innovation knows. For example, a spread chart (also called a ratio chart) of ARKK/SPY shows just how dramatically growth has struggled. ARKK is a well-known US ETF containing high-beta stocks typically categorized as disruptive-innovation stocks, i.e., high growth names. This chart evidences just how much growth has struggled vs. the S&P 500. Notice, though, how this spread chart shows how close to major, long-term support the ratio has moved.
Examples abound of high-growth names having been crushed in powerful bear markets in those names. Some of them are even top names with innovative products and services and an impressive record of earnings / sales growth: Square ( NYSE:SQ ) has declined about -68% from all-time highs, Upstart ( NASDAQ:UPST ) fell about -81% from its high to its low in late January 2022, and ( Roku ) dropped about 78% from its peaks. Even large cap tech not gone unscathed: Facebook NASDAQ:FB suffered a nearly -50% decline after a huge earnings / guidance disappointment. But in general, large-cap tech has been the exception in growth until the selloff this year. While growth / tech in general has struggled for months, large-cap tech names such as GOOGL, AAPL, MSFT, and NVDA have outperformed. Even AMZN's sideways move for about a year should be considered outperformance relative to other high-growth names as shown by the ARKK chart above: see the chart below, which is a relative chart of AMZN vs. ARKK, revealing that even with AMZN's lengthy sideways move, it has dramatically outperformed growth / tech names more generally.
Markets are in constant flux. So often, just when the little people (retail traders like me) take notice of a powerful new trend or outperformance, it ends. So I'm trying to watch for where markets are moving rather than focusing on where they are.
In short, is growth bottoming out relative to value? Here are a few charts to consider.
1. The main weekly chart above (also copied below) is a spread chart showing the ratio of NASDAQ:IJT (small-cap growth) vs. small cap value. Notice how close to major long-term up trendline support the ratio has moved. And the weekly ratio is also right at support at March 2021 and May-June 2021 lows. The RSI for this relative chart also shows that it's oversold to 33.65, a level that only appears in multi-month (and often multi-year) intervals. Even the two RSI lows in 1H 2021 occurred 2 months apart, but this is the exception looking back longer term.
2. Large-cap growth is right at support at a long-term uptrend line. See the weekly spread chart of the ratio between XLK/SPY. AMEX:XLK is a US ETF that is heavily weighted towards large-cap tech.
3. Equal-weighted growth vs. equal-weighted tech RYG/RPV is also very close to long-term upward trendline support.
4. Interest rates are nearing long-term downtrend channel resistance—at the upper line (the actual downtrend line). Interest rates have soared powerfully since mid-2020, and the Federal Reserve has hawkishly signaled coming rate hikes, and market participants have behaved as though rates will keep on going to the moon—by selling tech / growth, which struggle when rates rise b/c of discounting of future cash flows used to value such names. The viewpoint that rates could turn around in the near future seems radical, contrarian and unreasonable. But consider this chart below. Could rates turn around just after a large move just after millions of market participants have been flocking towards value names that outperform in rising-rate environments?
Some well-known experts have already taken this view. www.cnbc.com
It seems priced into the market right now that the 10-year yield could continue rising, that the interest rates could even breakout higher above long-term downtrend resistance, and that the Fed is likely behind the curve in controlling inflation. It seems consensus that value could continue to outperform long-term, and that growth could break even long-term support levels and continue to plummet. But if this is priced into the market, shouldn't one consider buying what's already priced in? Especially because maybe what is priced into the market will not last. Thinking about where the "puck is going to be" may suggest that tech / growth is making a multi-month or multi-year low or that interest rates are going to pullback in the next few months, allowing tech to thrive again.


AIR ARABIA STOCK WEEKLY ANALYSISAIR ARABIA showing strong bullish breakout
Not only to keep but to buy more.

This is my current plan on ROKUROKU is down 70% from the previous "ATH" and is below a clear descending trendline; I'm really interested in this kind of name to look for opportunities in case a new bull run comes. My main thesis to support the idea that a new bull run may come is on the logarithmic chart.
As you can see, these big drops have already happened in the past , and after that, we observed massive bullish movements. So my view is that there are similarities between them and that past behavior may repeat again.
Ok, nice that these mean that we should buy now? Of course not; that's why we use technical analysis to detect common patterns between all these past situations and try to find which would be the most efficient way of trading this "opportunity." My conclusion is that I want to observe breakout followed by a correction in the daily chart of 7 to 12 days and a clear 10% retracement.
IF that happens, then I will be interested in trading on a new local high in the same way you can see on the chart, with a target on the next major resistance level.
What happens if the price keeps falling? Then I will not trade, and I expect a move towards the next support. From there, I will look for the same setup I'm mentioning here.
Thanks for reading! Feel free to share your view and charts in the comments!

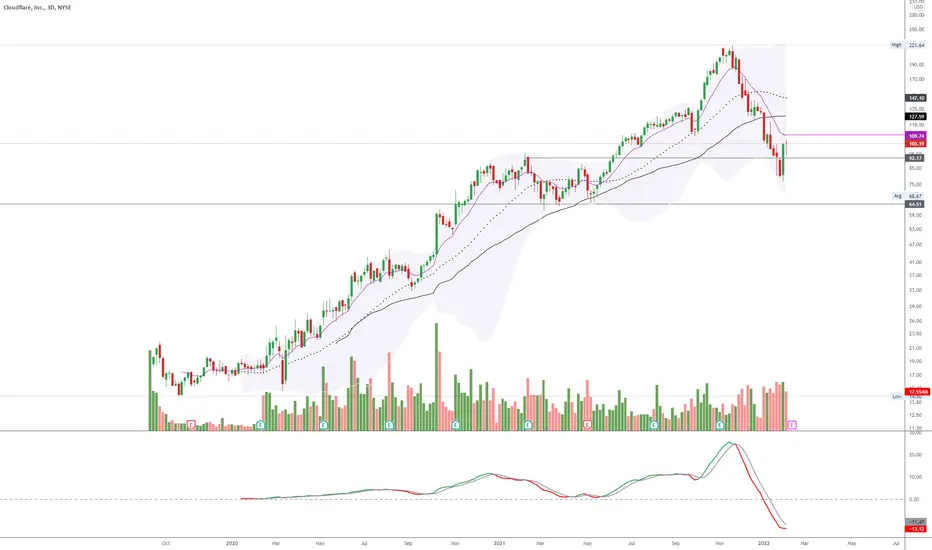
NET - No clue what's nextOne of THE most bullish chart since 2020 got hammered hard and found good support from the breakout zone. With ER next week, where price will end up is anyone's guess. with crazy moves like SNAP, FB, SPOT, NFLX, AMZN, I wouldn't want to gamble before consolidation.
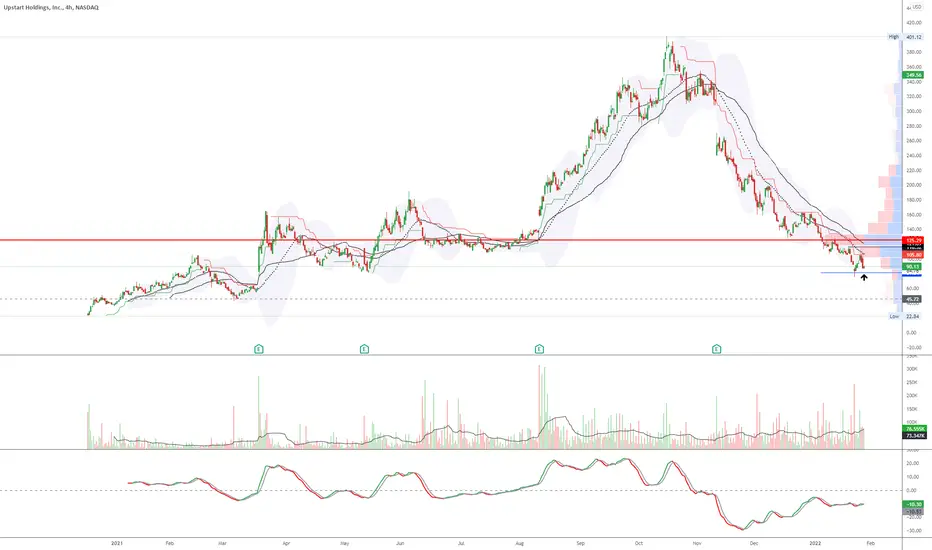
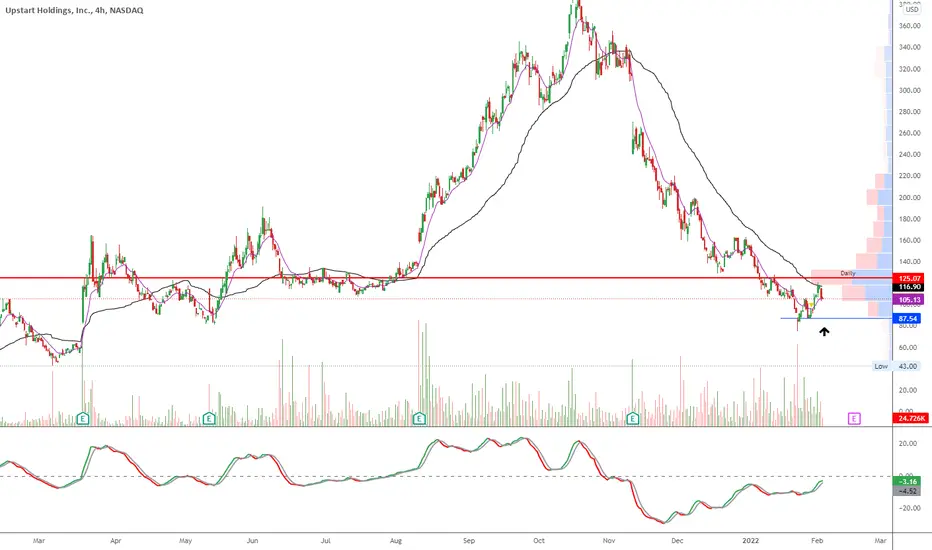
UPST - Continues to lead the growth namesRallied hard from the recent low and pulled back - as expected from VWMA on 4H...I would still be long as long as it stays above 87...below there is gap to be filled around 60.
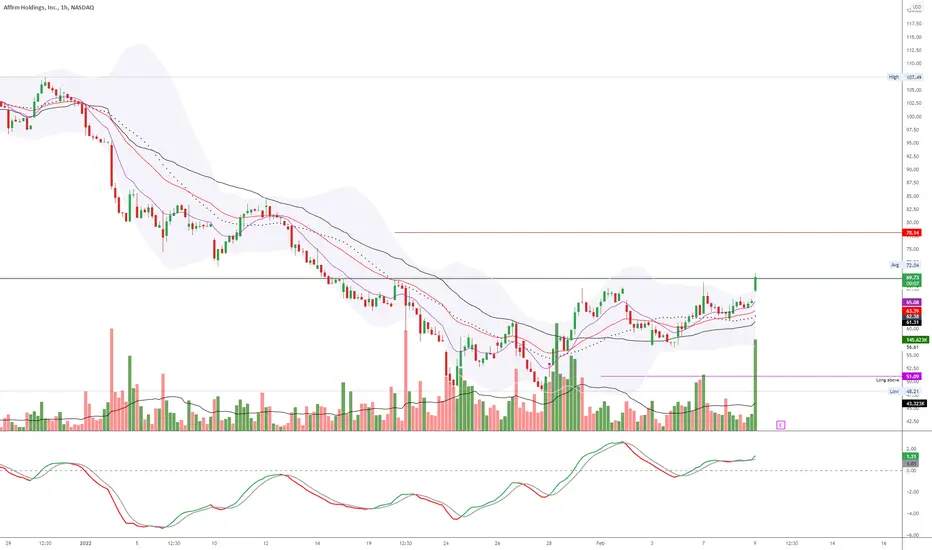
AFRM - Looking like another bearflagPrice action over next couple of days would decide if this is another bearflag or reversal.
Trend favors bears...double bottom at 48 would put this in an interesting spot.
If it stays above 56, bull case becomes strong.
I am bullish on this long term, but need to base before I can jump in.

HUGE Long-Term BUYING opportunity on PayPal #PYPLWe've just opened a LONG #PYPL (PayPal Holdings) position using 2.50% of our equity as we believe that the current post-earnings sell-off is quite overdone at these levels.
The stock is down over 58% from its all-time highs of $310 that it reached mid-summer last year. Our view is that while there are definitely issues related to the future growth trajectory of the company that investors are rightfully worried about, the current price action is pricing in the worst possible scenario for the company moving forward, which in our opinion has a very low probability of actually materializing. Furthermore, the weak forward guidance and the severely lowered investor expectations will make it that much easier for the company to beat its own forecasts in the coming months, considering its leadership position in its sector, thus surprising the street positively. This will then cause a chain reaction of positive analyst upgrades and price target revisions. Yes, this whole process might take some time to materialize, but if you are looking for a solid growth stock with a remarkable long-term potential to double your money, then #PYPL is a screaming buy anywhere around the $125-130 range.
There is no question about the fact that the miss on the bottom line (EPS) in the most recent earnings report together with the poor forward guidance that the management gave on the earnings call after have been the major drivers for the vicious sell-off that we are seeing today.
For 2022, management expects net revenue to increase about 15% to 17% (19% to 21% ex-eBay), and that’s below the roughly 18% analysts were forecasting. The earnings outlook wasn’t any better, with management forecasting adjusted earnings of $4.60 to $4.75, well below analyst estimates of $5.21.
On the new users front, PayPal expects to add about 15 million to 20 million net new active accounts this year, and analysts were forecasting growth of about 55 million. This was definitely one of the most disappointing components of the report.
However, we believe that the down-beat forward guidance given by the company is hugely blown out of proportions and it seems that investors have been very quick to forget that #PYPL is the leader in the digital payments space and could technically be considered as the largest digital bank in the world with over 300 million clients. Our analysis shows that the eBay transition that the company has been going through has definitely weighted on its financial performance. However, we are in the final stages of it and it will be over and done with by the second half of the year.
What investors need to focus on is the fact that the company’s growth rates excluding eBay have remained above 20%. In addition to that the #AMZN (Amazon) partnership with Venmo hasn’t even started yet, and PayPal is free to explore many new partnerships now that it is no longer constrained by its relationship with #EBAY (eBay) . Also, operating expenditure growth is also expected to moderate down the road, allowing management to flex the leverage in the business model and help expand margins.
Apart from adding the stock to our long-term corporate investment portfolio here, we've also opened few long-term CALL options on $PYPL, which we expect to substantially boost our portfolio returns in 2022.
Follow and copy us for more detailed market analyses, profitable trading ideas and a consistent portfolio performance.
Sincerely,
@DowExperts

$ARKK - Highest weekly volume in its existenceVolume is a truth indicator. Last week's volume was the highest in the history of $ARKK. I think we have found the floor. Price action today is likely a lot of shorts covering. I would expect to consolidate around these levels for a few months before any major upside movement, but this is a good level to start adding to your growth portfolio.

UPST - Better short term price action among the peers
Rejected 4H ATR as expected.
If it can hold the recent low of 75, I'd expect this name to lead the pack.
Long term I am very bullish on this name...what they do is the future with literally sky as the limit.
at the risk of being ridiculed, I expect this to be a trillion dollar company in next 10 years. ONLY 4 american companies have managed to achieve that feat, so a lot needs to fall in place for that to happen.
Below 75, capitulation(?) move to 45 is totally possible.