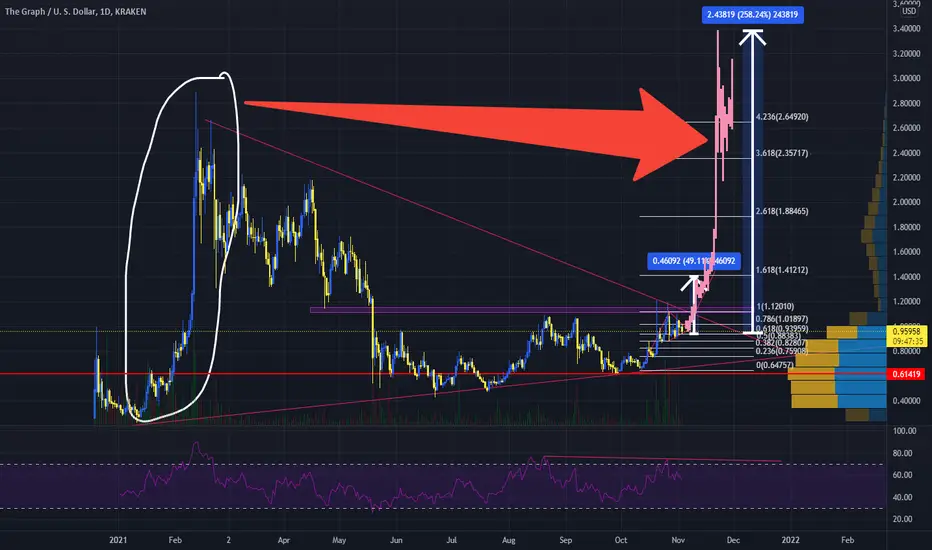
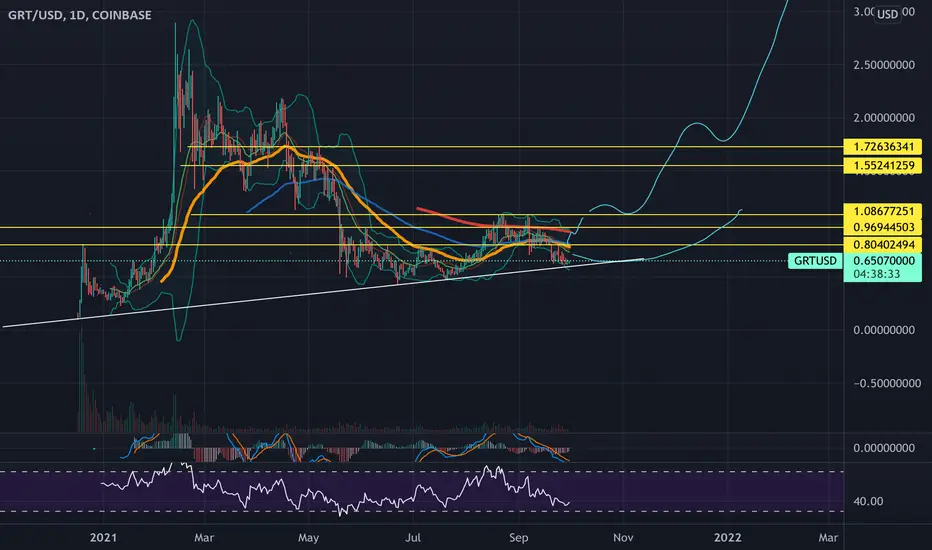
GRT The Graph Bottom Trendline Re-testHello friends, today I am reviewing the 1D linear scale chart for The Graph (GRT), a cryptocurrency alt coin.
In the chart I noted:
1) GRT price has been in a long-term triangle pattern since Jan-Feb 2021. The price is approaching the apex.
2) The price recently tested the top trendline of the triangle and got rejected and may possibly re-test the bottom of the triangle again, resulting in a 20% price drop to around $0.70-$0.72.
3) The Ichimoku Cloud is showing green and the price has stayed above the cloud since the end of October 2021. If the price drops, it may only be a very quick wick down for the re-test.
4) The RSI (relative strength index) tested the bottom support trendline and could be re-testing it again forming a double bottom to help push the prices higher.
5) The Volume has not gained much momentum since March 2021 but has not significantly decreased either.
6) The VPVR (Volume Profile) shows support and resistance at the current price levels as well as the potential price drop area. If GRT can manage to break upwards out of the triangle, there is limited resistance above.
What are your opinions on this?
If you enjoy my ideas, feel free to like it and drop in a comment. I love reading your comments below.
Disclosure: This is just my opinion and not any type of financial advice. I enjoy charting and discussing technical analysis. Don't trade based on my advice. Do your own research! #cryptopickk
GRTBTC

GRTUSDT -> Looks like it's going to fall a littleEverything is on the chart. Of course, as always, it is not investment advice. Shared for practice and note-taking. But in my opinion, I can't see any tiny signal that could increase the price of GRT...

GRT triangle breakoutThe Graph seems to be ready to break up this triangle 📐 and if successful I think there is chance for run to 1.448 and even higher. GRT , come on!📈
ENTRY : local high @ 1.1243
SL : local low @ 1.0793
TARGET : height of the triangle projected from midpoint of the local range (BUY STOP-LIMIT - SL) @ 1.448
RRR : 7.1
INVALIDATION : when SL level hit
Check my other stuff in related ideas.
Please like👍, comment🗣️, follow me✒️, enjoy📺!
⚠️Disclaimer: I'm not financial advisor. This is not a financial advice. Do your own due dilingence

Graph (GRT) Semms BullishGRT just broke out of an important resistance. I expect a retest pullback to $0.9 and the targets of $1.2 and $2 after that.

GRT Buy position ✔Hello Traders. Hope you are having a great day.
Today I want to share my thoughts on GRT on 4H timeframe. As you can see GRT has this descending trendline as a resistance in the way.
So I have marked the best point to buy and Targets are shown on the chart. Also you can put SL below 0.62$.
🚩 Always remember to put stop loss for your orders in order to reduce the risk of your trades.
🚩 Always keep an eye on BTC chart as well because it can affect the movement of altcoins as you all know my dear traders.
Thank you guys for reading my idea on GRT and don`t forget to comment what you think. ✌

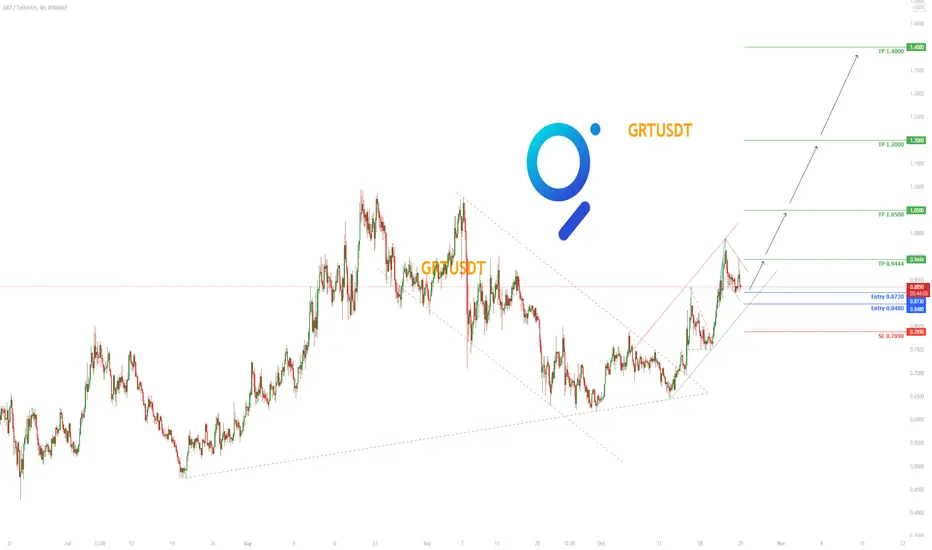
GRTUSDT Technical Analysis⏳ Spot
💎 GRTUSDT has broken above a significant resistance and it has also broken above the symmetrical triangle. It might go for a Pullback soon
🌐 Tradingview
🏁 Short & Medium Term
💵 Invest Only 5% of your Portfolio
🎳 Entry at Market or at 1.0937 - 1.0490
☕️ TP1 1.1870
🍺 TP2 1.2911
🍻 TP3 1.4463
🍾 TP4 1.5831
🍷 TP5 1.7000
🍸 TP6
🍹 TP7
🎁 TP8
🚫 SL 0.9500
Good Luck 🎲
Check the Links in Description and If you LIKE this analysis, Please support our page and Ideas by hitting the LIKE 👍 button. ❤️ Your Support is really appreciated! ❤️
Traders, if you have your own opinion about it, please write your own in the comment box. We will be glad for this.
Feel free to request any pair/instrument analysis or ask any questions in the comment section below.
We will have more FREE forecasts in TradingView soon
Have a profitable day 😊👍🏻

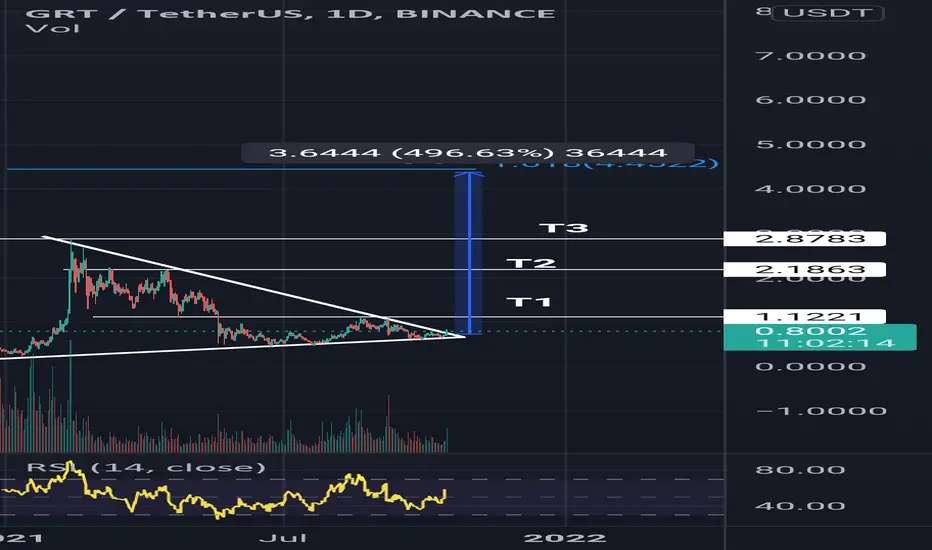
#GRT The Graph 1D Chart Breakout ready?The Graph (GRT) is one of the top 100 cryptos but it has been on a downward trend within a triangle pattern for many months. It seems we are near the apex of the triangle.
Taking the flagstaff from the last pump and moving it to the breakout area, it seems that the 1.618 fib may be reachable.
Also considering the fractal pattern from when GRT launched, we may be able to see massive gains.
Coinmarketcap on GRT: coinmarketcap.com
What are your thoughts? Comment below and hit the like please. Thank you!
Disclosure: This is just my opinion and not any type of financial advice. I enjoy charting and discussing technical analysis . Don't trade based on my advice. Do your own research! #cryptopickk #bitcoin #altcoins
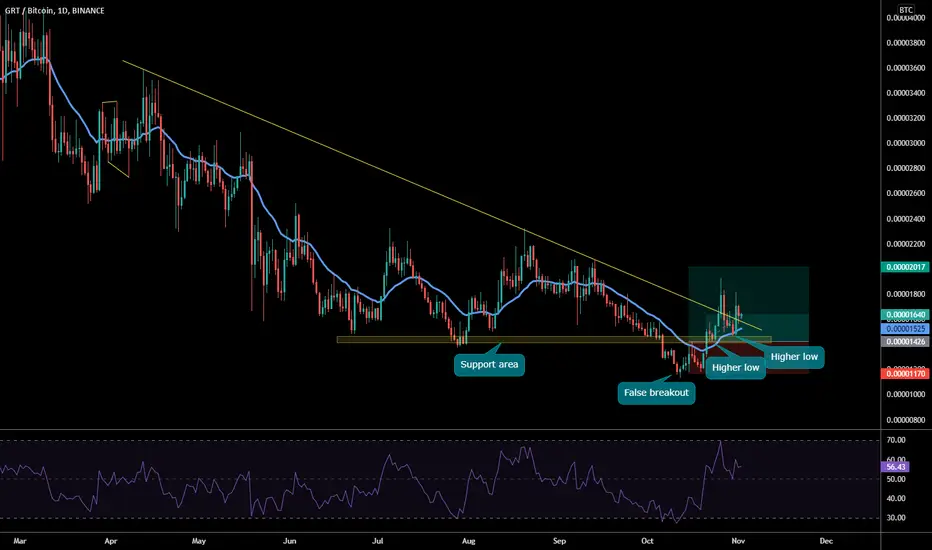
GRT/BTC buy opportunityHi followers,
BINANCE:GRTBTC formed nice move up after a false breaking the support area,
This move followed by higher lows and a retest of the support area,
Possible scenario is a consolidation before breaking out the big downtrend line, which may suggest a big move up.
Don't forget to manage your risk! 👌
Good luck and trade with care 🙏
If you like my content - 👍 Like, 💬 comment, 👆 follow and 👉 share!
❗❗❗
Disclaimer: This information is not a recommendation to BUY or SELL. It is to be used for educational purposes only!
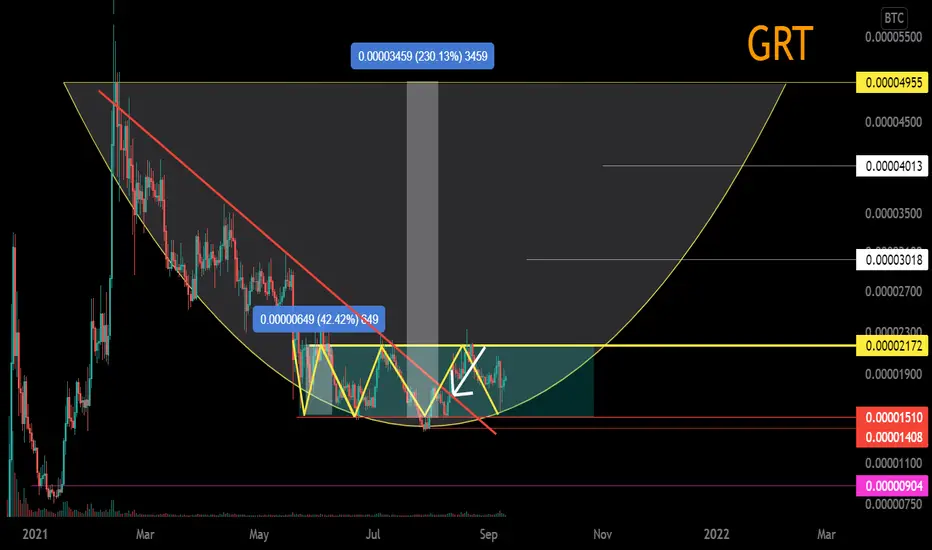
GRT/BTC Secondary trend. Channel 42%.A large cup is formed, in it formed (potential Phase 2) horizontal channel 42% (shown in the graph). Work in it. The price came out of the downtrend secondary (red line).
GRT/BTC Main Trend. Cup 230%. Accumulation channel 42%.
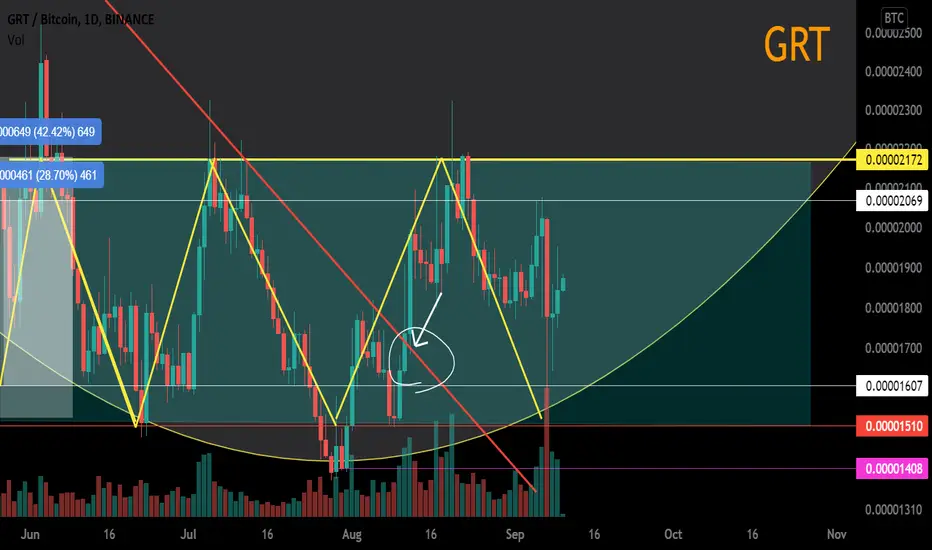
GRT/BTC Main Trend. Cup 230%. Accumulation channel 42%.A large cup is forming. The price came out of the downtrend secondary (red line). A 42% channel has formed in the sideways trend (potential 2 phase of the cup), i.e., accumulation of the position.
GRT/BTC Secondary trend. Channel 42%.
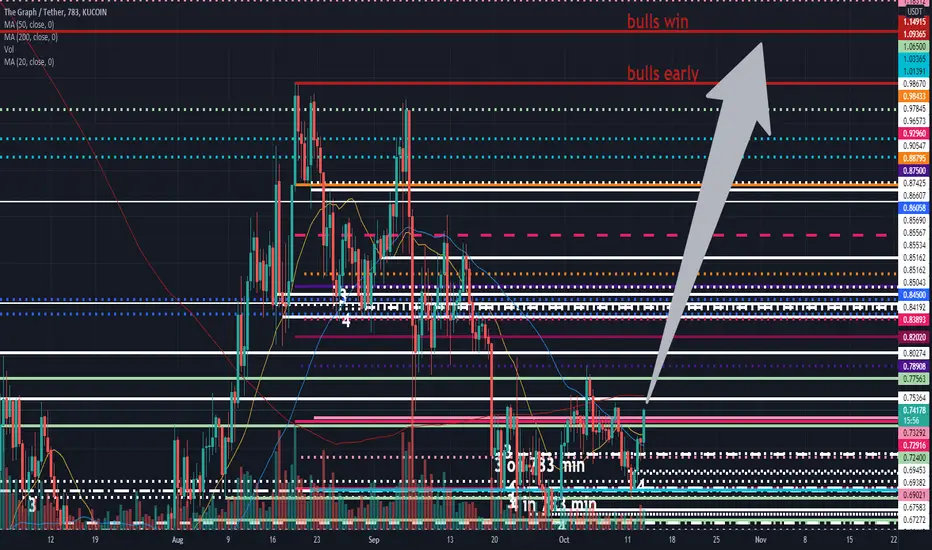
GRTUSDT Technical Analysis⏳ Spot
💎 GRTUSDT has been making HHs and HLs in the ascending channel, It has formed a Bullish flag pattern and after the breakout and retest I expect it to go higher. It might go down to 0.8480 before it goes up.
🌐 Tradingview
🏁 Short & Medium Term
💵 Invest Only 5% of your Portfolio
🎳 Entry at Market or at 0.8730 - 0.8480
☕️ TP1 0.9444
🍺 TP2 1.0500
🍻 TP3 1.2000
🍾 TP4 1.4000
🍷 TP5 ______
🍸 TP6 ______
🍹 TP7 ______
🎁 TP8 ______
🚫 SL 0.7890
Good Luck 🎲
Check the Links in Description and If you LIKE this analysis, Please support our page and Ideas by hitting the LIKE 👍 button. ❤️ Your Support is really appreciated! ❤️
Traders, if you have your own opinion about it, please write your own in the comment box. We will be glad for this.
Feel free to request any pair/instrument analysis or ask any questions in the comment section below.
We will have more FREE forecasts in TradingView soon
Have a profitable day 😊👍🏻
GRT / USDT AWESOME !Hey , guys !
GRT is start to go up now !
Lets look together !
Its will awesome ;)

GRT/USD - The Graph is lining up perfectly for a breakout! 🚀Key Support level: $0.70
Key Resistance level: $0.85; $1.24
The Graph (GRT) has consolidated in this large blue pennant since establishing its all-time high at $2.88 in February 2021. The price is reaching the end of this formation and a breakout is likely before November. Until that happens, GRT is constrained by the current support ($0.65) and resistance ($0.85) levels. The indicators are turning very bullish as well, giving confidence that a breakout is in the cards.
Technical Indicators
Volume: Volume is stable and any break above the current pennant will trigger a bull rally. If that happens on increasing volume, the breakout will be confirmed as soon as we close above the pennant with a green candle on the daily timeframe.
RSI: The RSI is curving up on almost all timeframes. This indicates a bullish price action and the price increase will only accelerate once we break away from the pennant.
MACD: The MACD on the three-day timeframe just crossed to the positive side. The last time this happened GRT doubled in price from its support line and rallied for a month (July-August). This makes a price above $1 very likely in the near future.
Bias:
Bullish. The current price action shows a clean break above the pennant is very likely which can be followed by a rally towards the next resistance level at $1.24. If the price breaks away from the pennant, it can also experience a throwback to retest the previous resistance (currently at $0.85). If that is successful the previous resistance will act as support going forward. On the other hand, a failed breakout will push GRT back towards $0.70.
Short-Term Price Prediction for GRT Price:
As soon as the breakout takes place, GRT should quickly push above $1 with the first resistance sitting at $1.24. The all-time high is still quite far away today, however, a strong rally on increasing volume after the breakout could quickly narrow the gap towards $3.

GRTUSDT Technical Analysis⏳ Spot
💎 GRTUSDT has formed a symmetrical triangle and a descending channel. After the breakout it has got rejected from the Support line by a large green candle. it seems that it is going to form a Bullish flag on the lower TF. After the breakout I am expecting more bullish move
🌐 Tradingview
🏁 Short & Medium Term
💵 Invest Only 5% of your Portfolio
🎳 Entry at Market or at 0.7333
☕️ TP1 0.8888
🍺 TP2 0.9696
🍻 TP3 1.1111
🍾 TP4 _______
🍷 TP5 _______
🍸 TP6 _______
🍹 TP7 _______
🎁 TP8 _______
🚫 SL 0.6660
Good Luck 🎲
Check the Links in Description and If you LIKE this analysis, Please support our page and Ideas by hitting the LIKE 👍 button. ❤️ Your Support is really appreciated! ❤️
Traders, if you have your own opinion about it, please write your own in the comment box. We will be glad for this.
Feel free to request any pair/instrument analysis or ask any questions in the comment section below.
We will have more FREE forecasts in TradingView soon
Have a Profitable Day

GRT- money making machineHere u go boy biggest breakout of the year. Get ready for 500% move in GRT Token. 5x money this bull run- yes sure.
Stop loss will be below the support line.
GRT looking goodGoing up to test $1. a gain of about 30 percent from current prices of 75 cents USDT
GRT UpdateStill super frustrated with GRT.
Love the project.
China outlawed Bitcoin - price didnt dump. Seems like buy the dip it is?
GRT/USD - Massive triangle about to be resolved! Bearish trend.GRT has formed a massive symmetrical triangle which will soon be resolved. The bias right now is rather bearish with price pushing hard on our support.
If BTC continues to fall, it is likely it will pull alts with it and take us to the next support level at $0.5.
For this reason I'd not trade this right now, nor buy. Wait to see how our pennant resolves, if price falls lower, then best to consider an entry at $0.5.
Daily timeframe indicators are also bearish, so not much to say about that. My bias remains bearish for now as the overall market looks ready to re-test its key support levels including ETH and BTC (see ideas linked below).
Like and follow if you liked this idea!


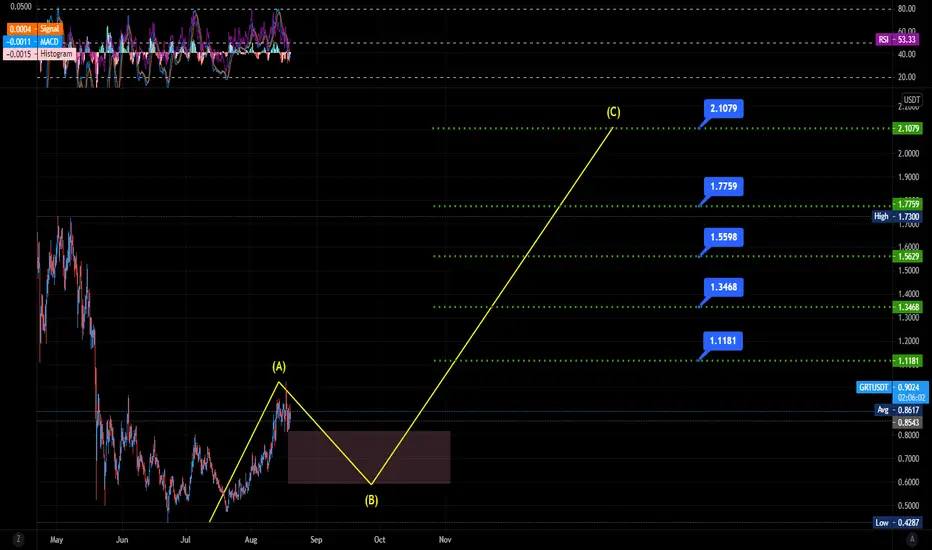
1$ Graph soonGraph is moving back to reclaim $1 price and will confirm it as a support. Strong project with Strong fundamentals will be going to give it huge push. This bull run target will be back to $5.

₿ GRTUSDT 1D ₿ : 11.Sep.2021 (Update)As we can see, the price is fluctuating in a sideways range and we can not expect good growth from it until its static resistance is broken. BINANCE:GRTUSDT
⚠️ This Analysis will be updated ...
👤 Arman Shaban : @Ar_M_An_4
📅 11.Sep.2021
⚠️(DYOR)
