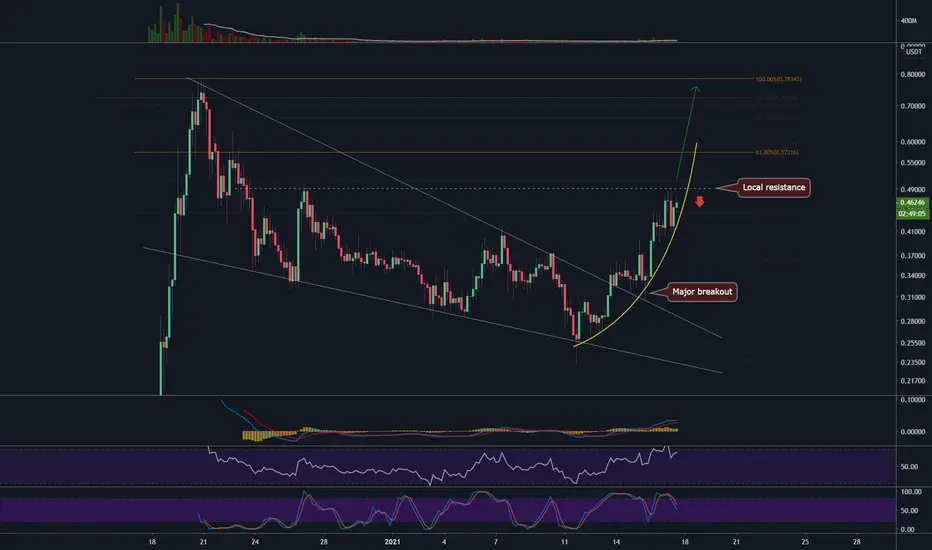
GRT/USD - Bull run to $1GRT has been pushing higher these past few days after breaking the descending wedge.
We are now at the local resistance around $0.50.
The momentum is very strong as indicated by the yellow parabola, as long as we maintain it, I do not wee why GRT won't test ATH level and push over $1.
Indicators on daily are not even over bought, therefore, there is a lot of fuel left in this run, unless BTC spoils the party as it is ranging inside a large pennant (to be decided).
GRT is also one of my top picks for 2021, see articles linked below.
Like and follow if you liked this idea!
GRTUSD
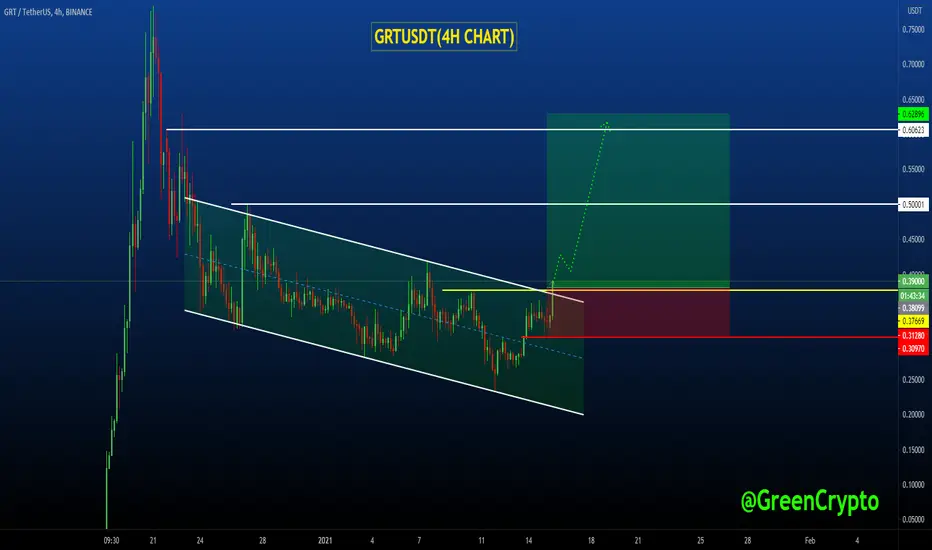
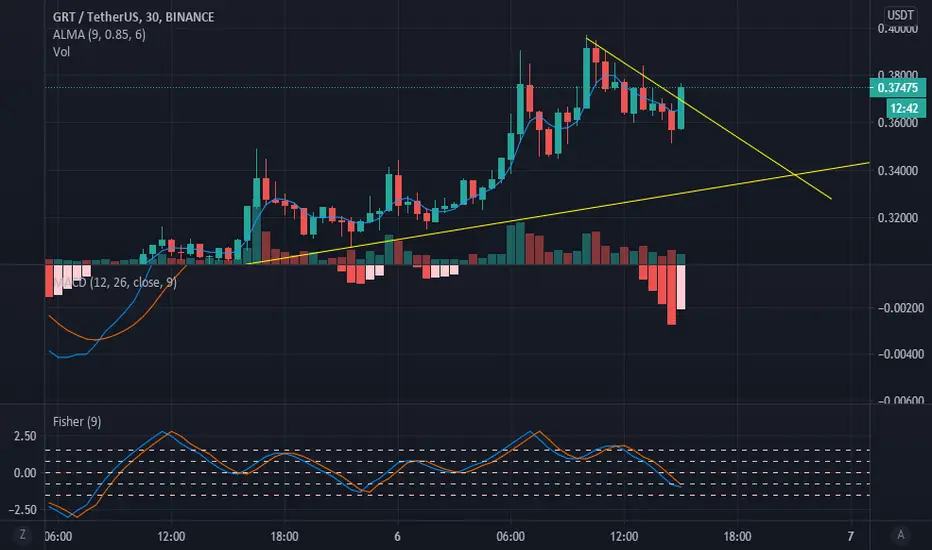
GRTUSDT (Descending Channel Pattern)#GRTUSDT ( 4H chart) Technical Analysis Update
Descending channel
GRT/USDT currently trading at $0.375
Long Entry-level: Above $0.385 (only enter long after 4 h candle closes above the resistance level at $0.385)
STOP LOSS: Below $0.310
Resistance level 1 (Target 1): $0.50
Resistance level 2 (Target 2): $0.60
Max leverage: 3X
ALWAYS KEEP STOP LOSS..
Follow our Tradingview Account for more Technical Analysis Update, | Like, Share and Comment your thoughts.
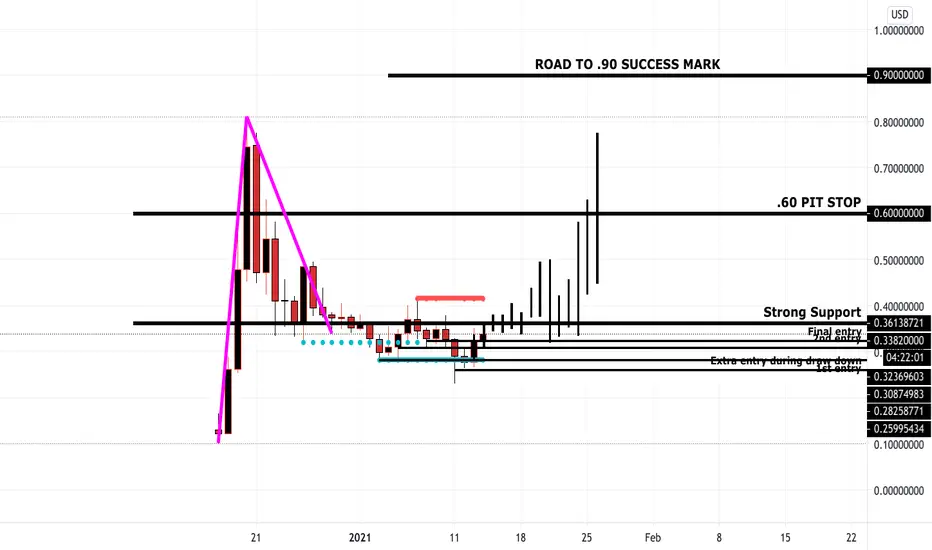
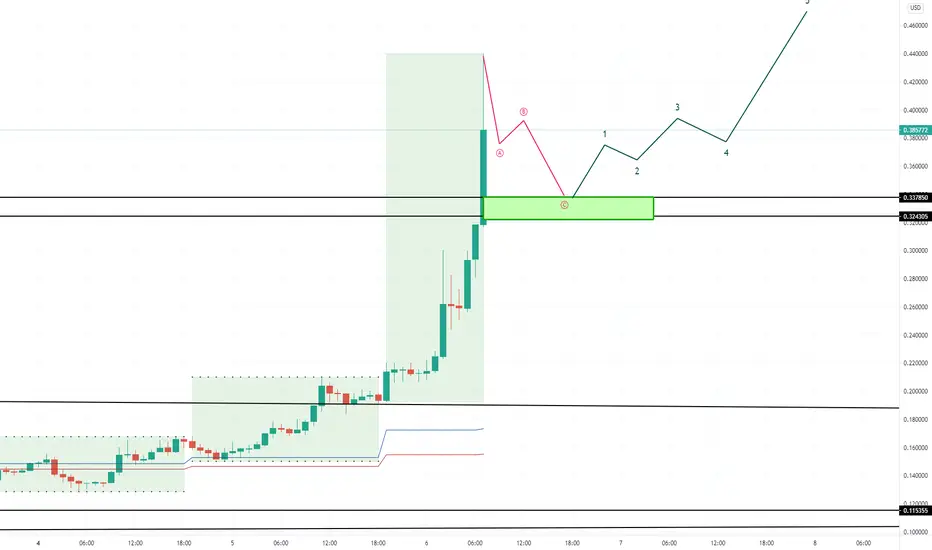
GRT road to .90 (UPDATE)Hey guys GRT has made a great move up , if you have been following us on the ROAD TO .90 you should be celebrating a move up , 30% profit ,
we are almost at the pit stop at .60 . profit is rolling in , please tell me any other pairs you want , please give me a follow and share and lets make profit together , i appreciate all the love you guys give me . i will def keep going and i hope all of us profit from a great year 2021.
like like like
follow me for more profit pairs
ALL comments welcome
& dont forget to PAY YOURSELF FIRST , before anything . have a good day guys.
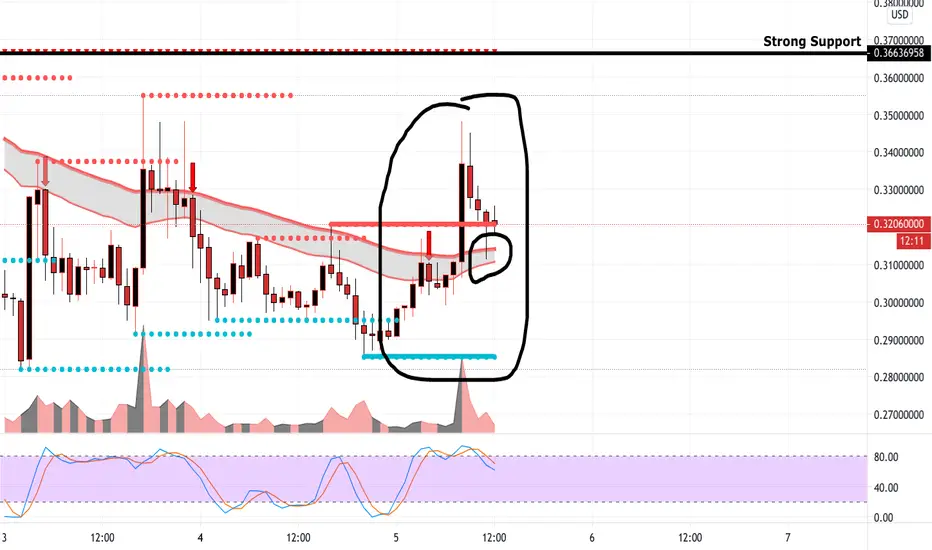
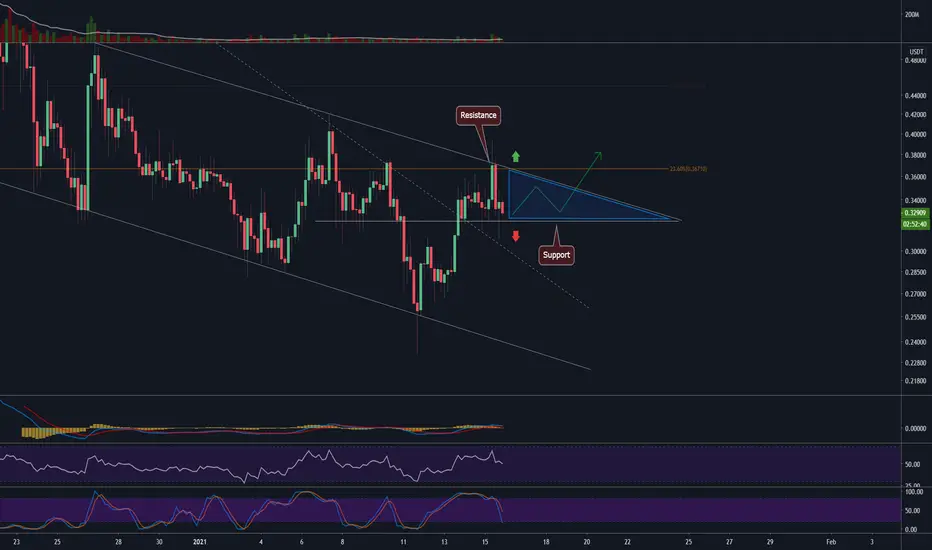
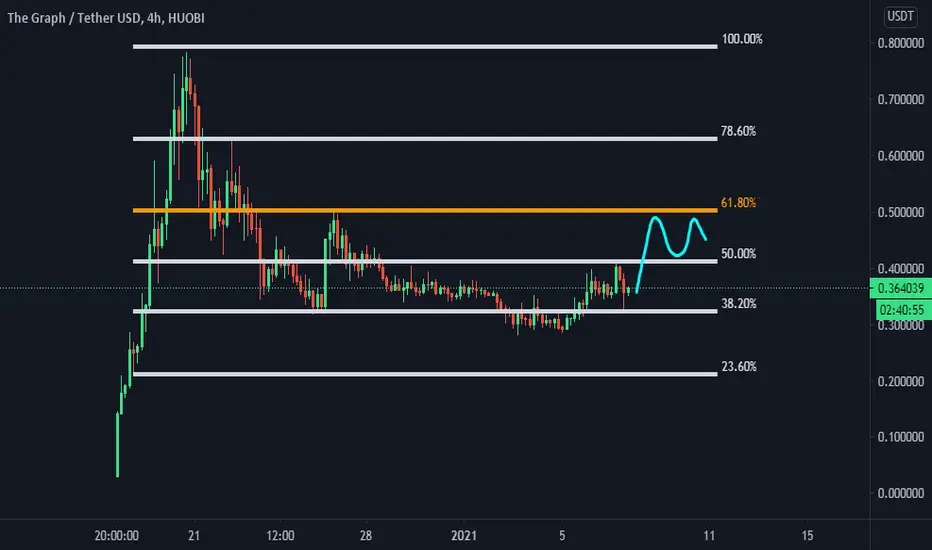
GRT/USD - We broke out of the wedge to find new resistanceGRT broke out of the descending wedge only to hit the resistance at Fib. 23.6%.
Today we had a quick rise after breaking the wedge and a sharp rejection at Fib 23% as indicated by the chart. This is not ideal since the rejection candle was longer indicating we may range a bit around the support area before we can have another attempt at resistance.
If we fall under the support line, we may touch the old wedge line and make it support. In that case we will have a bearish chart for the next few days. As long as the support line holds, there is a good chance we will break-up as the price is compressing and has to move out.
Best to wait for this formation to resolve before entering.
Like and follow if you liked this idea!
Beginning wave 3 in GRT / GRTUSD / The GraphThe recent pullback in cryptos allowed GRTUSD to finish or possibly near finish its ABC correction. I say possibly because it's still possible for the recent upward movement to be A-B-C, but it looks more like a 3rd wave even having a parabolic look to it. A lot of cryptos start their ICO with an A-B-C downward correction that could last quite a while. Technically, GRT did have a tiny one the first day, but immediately started a very strong bullish impulse wave the first few days followed by a sharp zigzag correction. I'd like to see a full 5 waves up on the hourly to confirm the bull trend, but things are already starting to look really interesting.

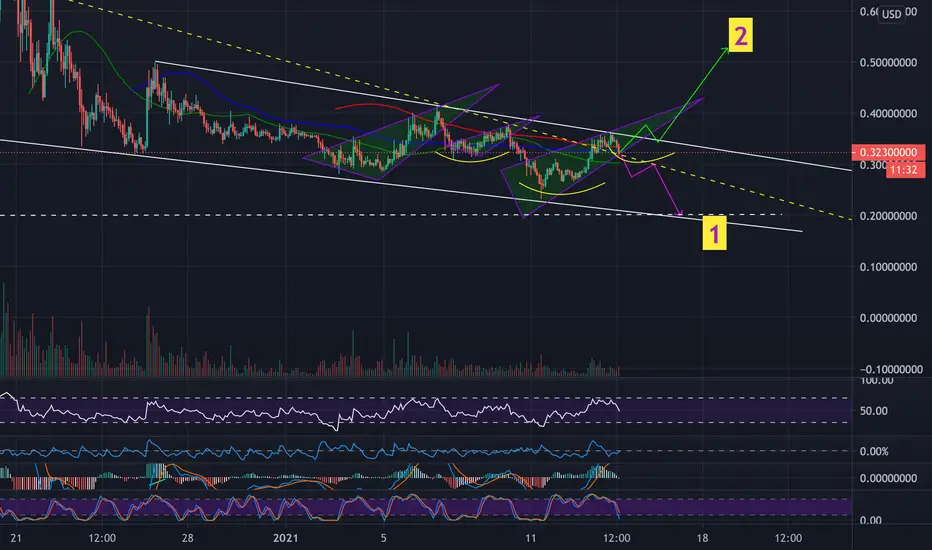
GRT Updated and price targetsGRT - token that can go up 40% in 1 day and dump 40% the second. Currently I am watching 2 possible scenarios unfold (I know, what a genius).
I am leaning towards #1 end point but will change my mind if we decisively bounce of the dashed yellow resistance line then go above the descending channel and retest by bouncing off it. If we go this route then I will expect a move to $.50. Breaking out with having a heavy lid like that seems less likely to me. Maybe 35% chance. Break out would most likely happen via a right shoulder (inverse) build up. It could take days and drag. If I start seeing a shoulder like pattern I will start getting a bit more bullish.
However, we are all very familiar with rising wedges and GRTs love with wedges. I am giving it a 65% probability we will break down towards $.2 level. We had a powerful move off recent lows but that move didn't carry us higher
PS: I am sour about GRT so take this with a grain of salt. I had very high hopes for this token and I think this was a classic pump and dump scenario that I got sucked into
GRT road to .90 (UPDATE) CLEANUPhey i did a little cleaning up of the chart , with steady take profits on the .60 clear 100% increase , .90 100% increase again .
at the pit stop , im selling off a % to profit from increase , as well again at .90 .
to keep moving around profits in the market .
GRT/USD - Descending wedge, expect breakoutGRT is forming a descending wedge with a nice bullish divergence on RSI (lower price, higher RSI, see yellow arrows) on the 4h chart.
We may still play inside the wedge, but this is looking positive mid-term, I would expect GRT to break-out at the next opportunity and push above the previous ATH in a second major leg up.
If however we fail to do so, GRT may correct further down. I find this unlikely as GRT fundamentals are quite strong. Nevertheless, new coins can correct up to 95%. So watch out!
Like and follow if you likes this idea!

$GRT $BTC | LONG - The patience retestBINANCE:GRTBTC
This is another coin to watch to see how it responds to a test of previous resistance.
Strong rejection is what we'd ideally be looking for.
Exits targeting confluence of Fib retrace & highest volume nodes on the volume profile visible range.
Worth noting we've formed a lower high and a higher low so wouldn't be surprised if range were to tighten before we saw a significant break.

GRT - Following other Coinbase listings like CVC & Mana?Hello Traders,
GRT/USDT is looking very nice.
We have a confirmed bullish structure with HH's & HL's.
A couple of key items:
- 25/50 EMA Cross on the 1 hour.
- Price has flipped the 25,50,100,175, & 225 EMA.
- Bullish divergence on the RSI.
Targeting:
- Recent Highs of $.41.
- If this can be broken, I would expect a restest of the ATH's. (And why not, it seems just about anything in crypto right now, is doing its own thing and giving big surprises)
Hold on to your hats and keep your arms and legs in the coaster because this is going to be a ride!
Thanks!

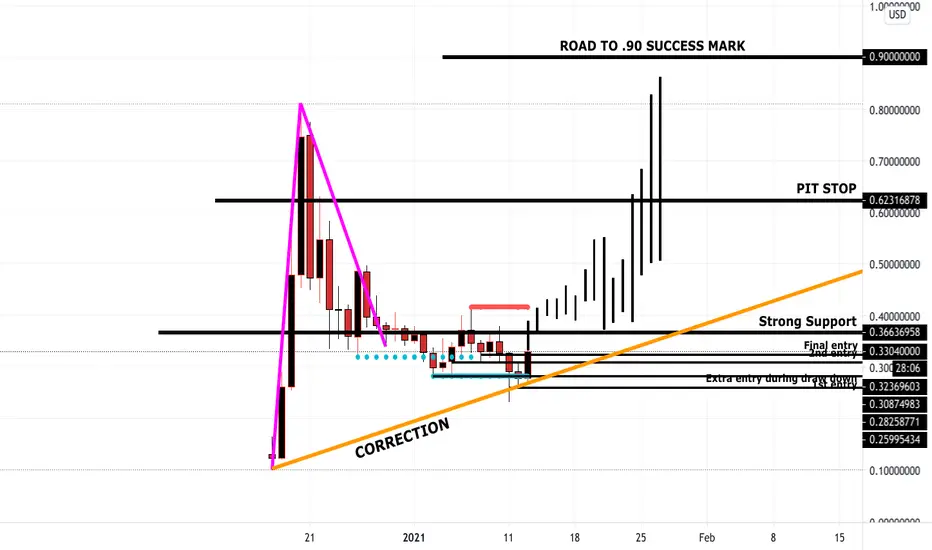
GRT road to .90 (UPDATE)Hey guys i was doing some extra research , seems like GRT will be having a huge spike/increase in tokens within the first 6 months on '21
With the increase in GRT tokens this has pros & cons in the near future.
with this OUR ROAD TO .90 should look a little close to my chart hear .
after i would say we move back down , and after a upwards of about 1.50 until a huge decrease with the supply going up a steady decrease i would def buy anytime now until we hit our pitstop
thanks for all the love guys
ALL comments welcome
like like like
follow me for more updates
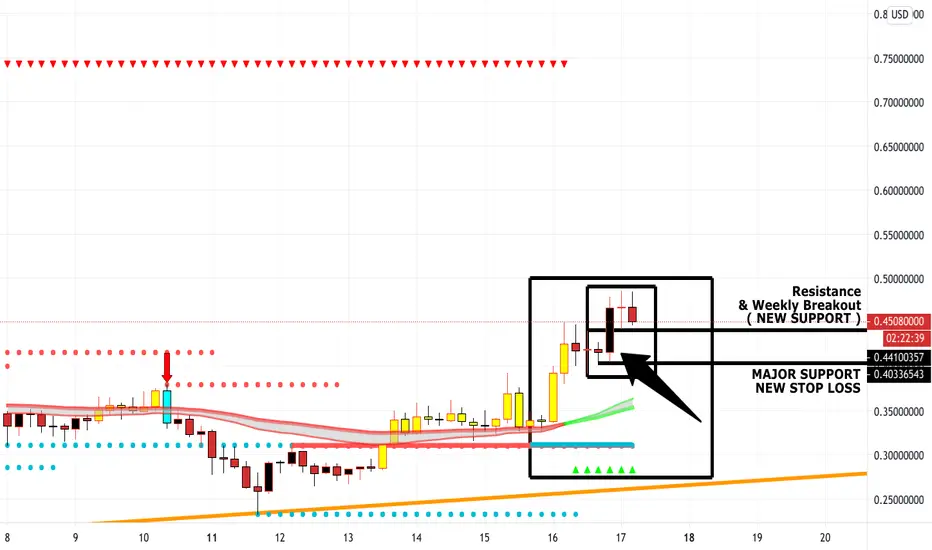
$.38 is the next strong resistance. Can we break that?After second attempt GRT broke $.3170 resistance level. Looks like next strong resistance level is $.38 can we break that? this is my first time charting. I am open to any constructive criticism
Thank you!

GRT road to .90 (UPDATE) 15 min chartHey guys quick update in grt , looks like it made its move back up to around .33
so it looks like our entries should be in profit if you are following are ROAD TO .90
ALL comments are welcome
follow me for more
dont forget to Like Like Like


GRTUSDT: Possible Long (10.01.2021)On h4, the price found support at $ 0.3 (61.8% Fibonacci). Besides, the downtrend line was broken upwards, which indicates a possible end of the downward correction.
On h1, the price forms wedge-shaped patterns, which indicate a possible start of a rapid upward price rise.
We recommend buying GRT to keep the position above $ 0.5

GRAPH Token S/R Flipprice break above the Resistance zone also made good bounce on
Buy : 0.38 - 0.383
Stop : 12%
Target : 0.4 , 0.46 , 0.52 , 0.62

The Graph (GRT) • A rocket in the making?GRTUSD on a steady structural uptrend while above established trendline basis.

DONT WORRY , GRT is down but STILL on the road to .90 (ADD-ON)just a quick update on GRT , i love being part of this at the very beginning , because we get to see everything happen .
even though it seems to be down , on a bigger note with GRT market cap we can easily move to $1.00 .
on the daily chart look how this is the bottom of STOCH RSI , deff waiting on a movement up in my opinion i say around JAN 10 on the chart we should see a great move up
i hope everyone following me has entered by now
follow me for more entries
thanks guys for all the great feedback i love it .

GRT ready to go back upStart Nibbling GRT here with a SL below .28 cents, it will turn back up from here.

GRT end of consolidating buyzone
hey guys this seems to be the end of the buyzone , if you see on my 30min chart its already becoming green , on the 1hr chart its closing ,
this is indicating that the motion is moving from red to green , judging by the wicks and volume i would say this is the end of the buyzone