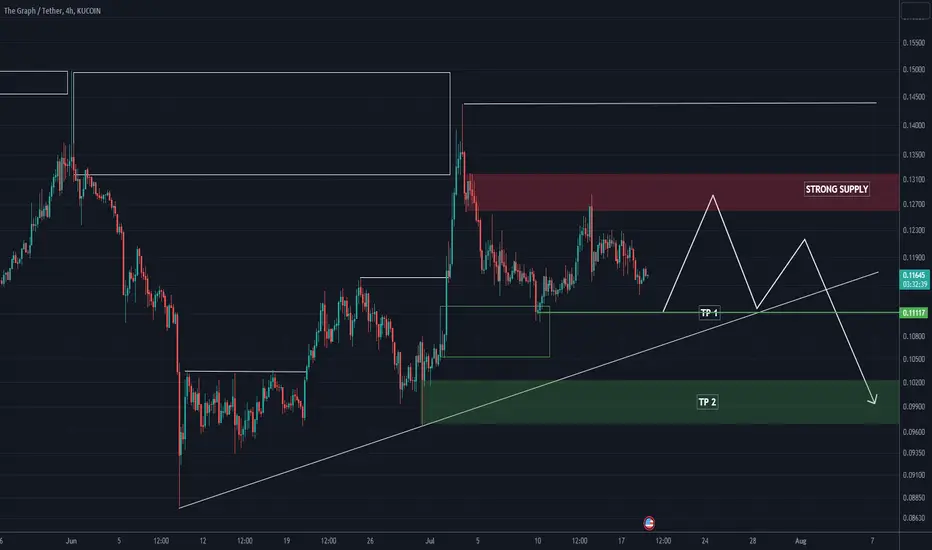
GRT ANALYSIS (4H)Hi, dear traders. how are you ? Today we have a viewpoint to SELL/SHORT the GRT symbol.
For risk management, please don't forget stop loss and capital management
When we reach the first target, save some profit and then change the stop to entry
Comment if you have any questions
Thank You
GRTUSD
GRTUSD: looking for a refillI like GRT and have been buying and selling; but, still have a small bag that I want to expand. GRT is doing things to become more decentralized and with AI tag on its brand, I think it should do well. But with anything in crypto world, you never know if a project will be successful or even a scam or not. So, I have waited for an attractive price point for a large purchase and looks like I might get it again. My first big purchase (over 5k at the rectangle area) earlier this year gave me almost 3x and I sold more than half. I want to put that back in again at the same area if it comes back to retest. Stop loss will be a bit loose below December low since I can afford to lose that much only. If I don't get it, then I will wait until I see a higher high above July high. Moves on GRT are very fast, so multiple limit orders are in the plan. Hopefully things will work out.

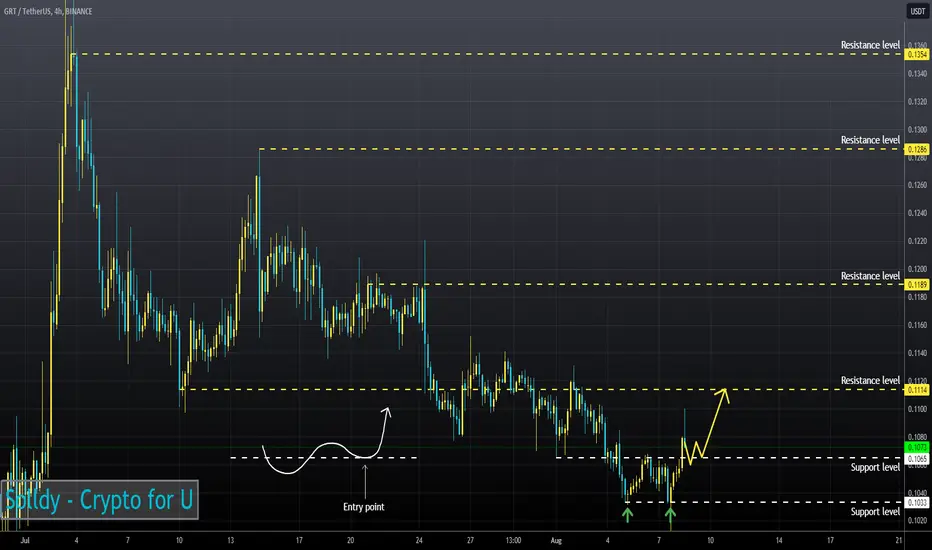
GRTUSD ❕ double bottomTrading volumes are low.
The price has broken upwards through 50EMA (4H TF)
RSI is moving in the buying zone.
50EMA broke up through 100EMA (30m TF)
I think the chart will start to bounce on holding support.
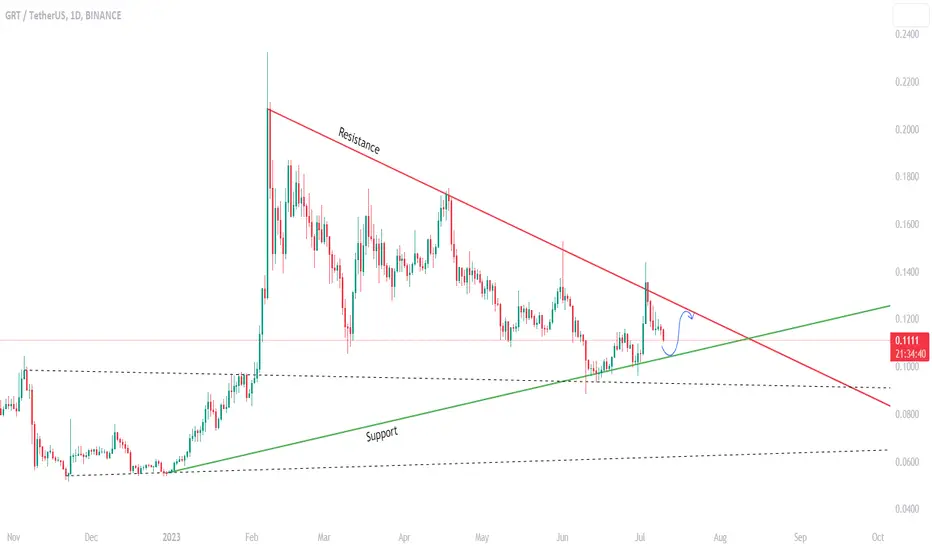
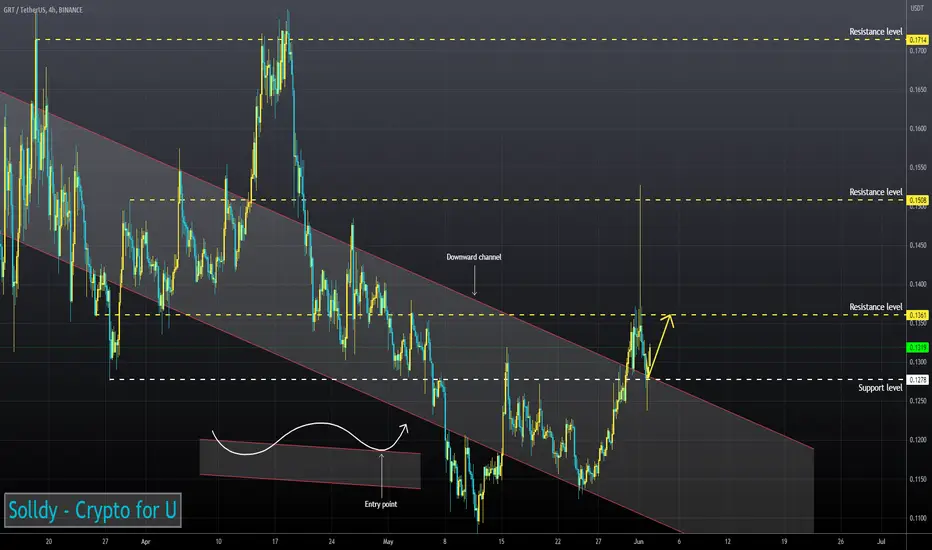
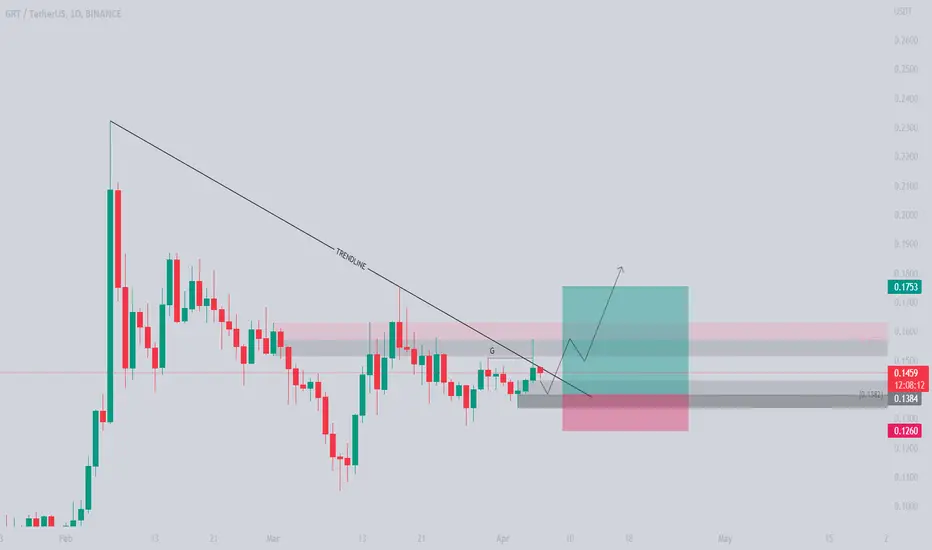
GRTUSDTThe current situation of BINANCE:GRTUSDT (Graph Token) is as follows:
A few days ago, we witnessed an unsuccessful breakout that led to a price decline up to this point. There has been a downtrend lasting for more than 150 days, but fortunately, we also have a supportive trend line with two strong supports.
we have a change of character from a downtrend to an uptrend, and we can confirm this with higher pivots that have been formed. However, this doesn't necessarily imply a reason for the price to go up.
In my opinion, a price of 0.105 could be a reasonable buying price with the target of retesting the downtrend line.
⚠️"Daily crypto market analyses I provide are personal opinions & not financial advice. Trading carries risks, so do your own research & seek advisor's help."
Don't forget to like and comment
Graph prepared for 23 cent 🔥GRT prepared for bullish movement to 23 cent.
If resistance breakout price rise to 23 cent.
Take position after breakout and retest in daily time-frame.

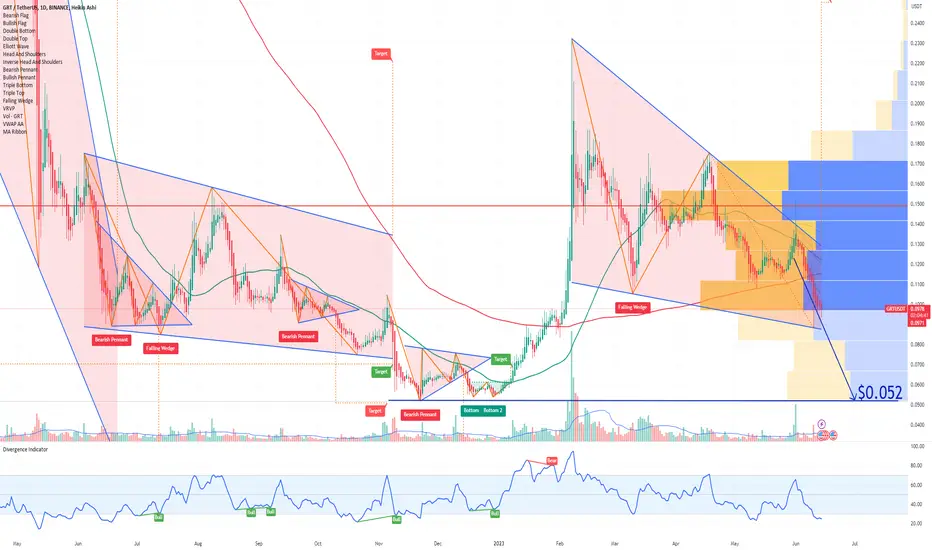
GRT The Graph migration to ArbitrumIn my opinion, despite the majority support for The Graph Improvement Proposal and the planned migration to Arbitrum, there are potential concerns for the GRT crypto token. The shift to Arbitrum, as an off-chain solution, may introduce uncertainties and risks that could impact the token's value.
Furthermore, the support level of $0.052 could be a significant point to monitor, as breaching that level may trigger additional selling pressure and potential downward momentum for GRT.
Looking forward to read your opinion about it!
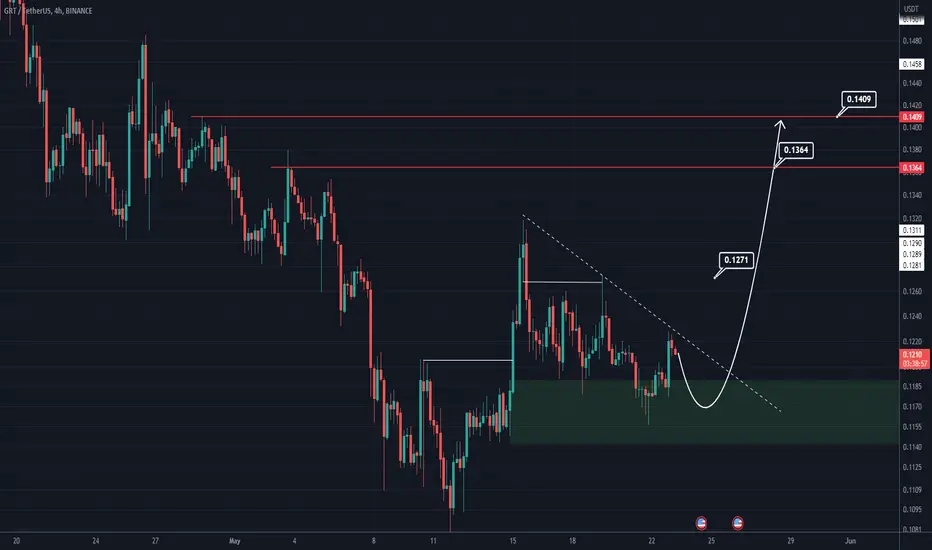
GRT LONG SETUPHi, dear traders. how are you ? Today we have a viewpoint to BUY/LONG the GRT symbol.
For risk management, please don't forget stop loss and capital management
When we reach the first target, save some profit and then change the stop to entry
Comment if you have any questions
Thank You
GRTUSD ❕ above the channelTrading volumes have increased.
The price has fixed above the upper boundary of the channel.
The asset fixed above the 200EMA on the 4H TF.
The 50EMA broke through the 200EMA on the 4H TF.
The RSI chart is moving in the buy zone (4H, 1H and 30m TFs)
I think the GRT will continue its rise.
GRT target 128%4h time frame
-
GRT creating a potential triangle
Not a good time to enter now
Better to wait it completes breakout and retest
Stay prepared!
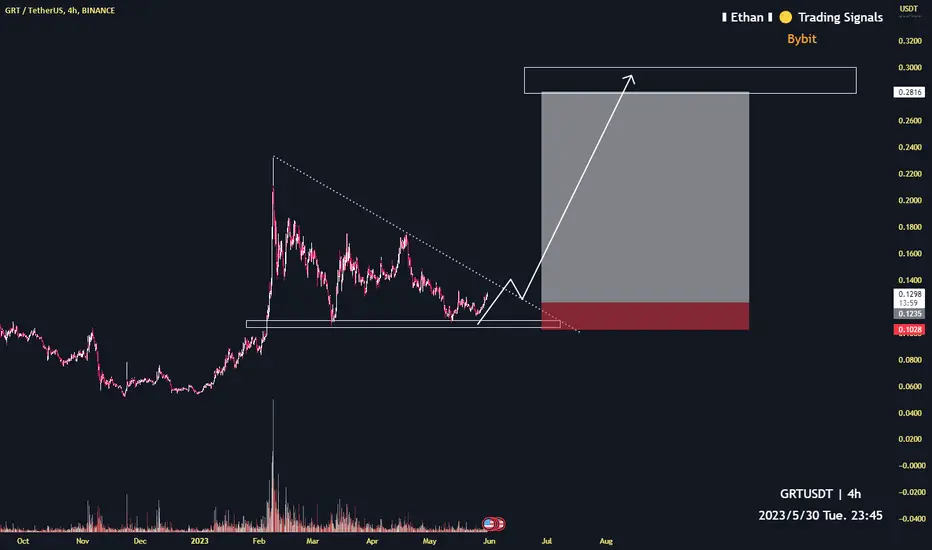
GRT updated chartGRT updated the chart after T1 hit
Entry zone: 0.120 - 0.11
T2: 0.275 - 0.295
T3: 0.58 zone
Stop? Close 1 day below 0.10
2nd trend predicts where the price might move, with major resistance on T2.
Best of Luck out there in the wild crypto world.

THE GRAPH long term more gain and shine 💣🚀💣Hello 🐋
we expect to see more gain for the price in log term targets 🚀💣
Brief explanation 📖👌💡
It is an indexing protocol designed with the specific aim of querying networks like Ethereum and IPFS.
In simple words, projects with complicated contracts (such as Uniswap and even the Bored Ape Yacht Club NFT collection) store information on Ethereum’s network.
The Graph makes it very difficult to read anything other than the basic data directly from the blockchain.
Without getting too far into technicalities, The Graph solves the complexities through a decentralized protocol that’s designed to index and enable the performance of efficient querying of the network data.📖
Please, feel free to share your point of view, write it in the comments below, thanks 🐋

$GRT long to $1+?JSE:GRT looks great here.
As you can see from the chart, JSE:GRT has formed a large bull flag. Upon breakout to the upside, the first target to hit would be $.32. If it can get above that I think it can hit $1 or $1.46.
Let's see what happens in the coming months.


GRTUSDT is going to blowGRTUSDT has repeatedly respected the uptrend trendline. This is an amazing confirmation of strong bullish momentum. We are certainly going to capitalize on that.

GRT - Bullish caseIf GRT closes above the red zone (above 0.155), then it'll fly
Target 1 - 0.30
Target 2 - 0.73
GRTUSDT LONG ideai think GRT is ready to breakout and fly . we have a fake break and I'm thinking for a retest then main move should be start.
⚠️this is not financial advice so #DYOR
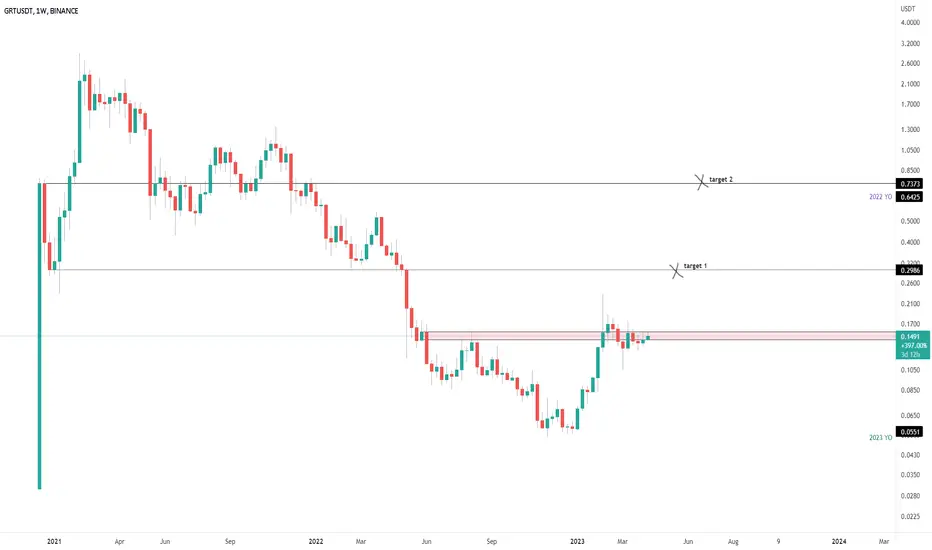
GRTUSDGraphtoken
Obv and volume profile paint a bullish picture
Targets short to long term listed
That volume spike means we’ve probably bottomed and will start the reversal run
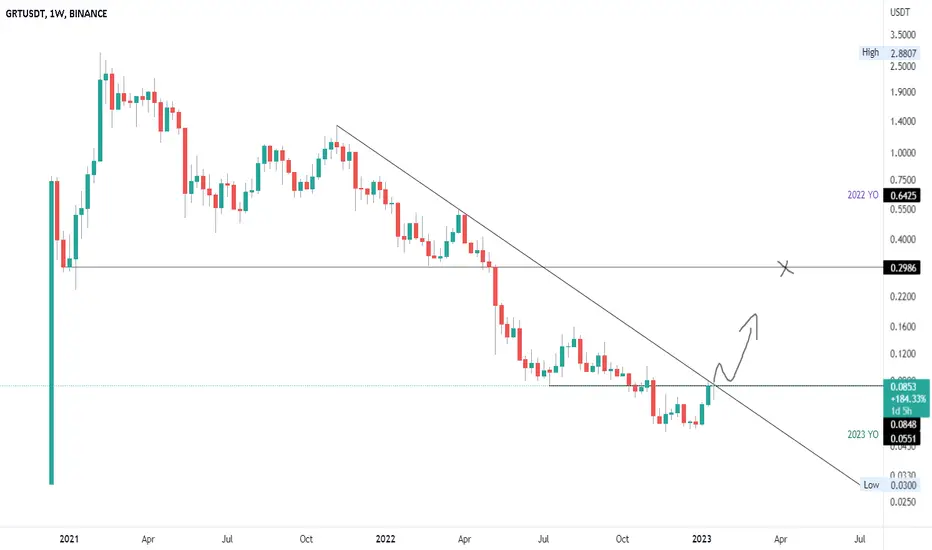
GRT - Echo Bubble PopGRT finds itself at two intersecting resistances.
First is the June 2022 lows, and the second is the year old diagonal.
If we get a close above those two intersecting resistances, then I think it's reasonable to target ~30c.
GRT CAN MAKE A CORRECTIONHi, dear traders. how are you ? Today we have a viewpoint to SELL/SHORT the GRT symbol.
For risk management, please don't forget stop loss and capital management
When we reach the first target, save some profit and then change the stop to entry
Comment if you have any questions
Thank You

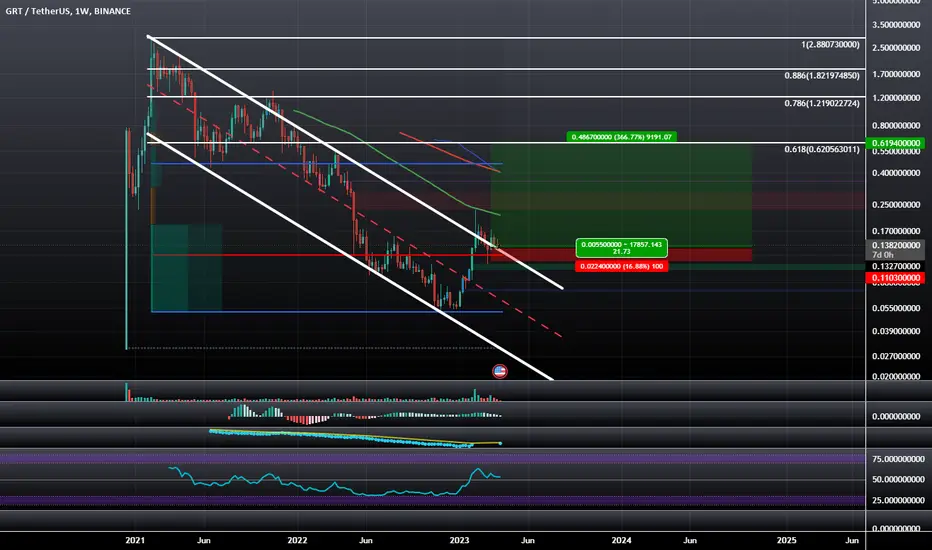
GRTUSD: Potential Macro Descending Channel Break Hook and GoGRT has spent some weeks backtesting the supply line of this channel as support and may be preparing to soon continue it's ascent and potentially make a 0.618 Retrace which would take it to $0.62
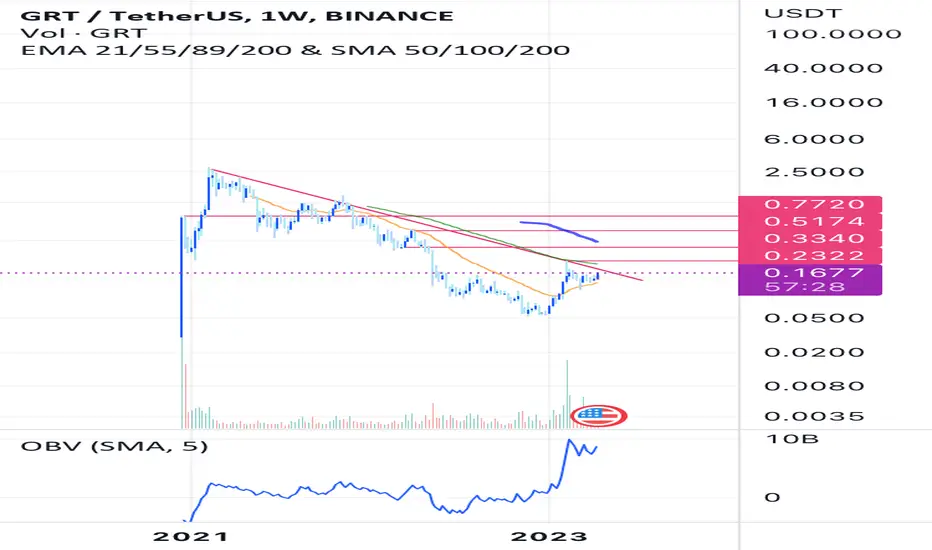
The Graphhello everyone...
graph is out of the falling wedge... made a strong movement and currently trading above the 0.14
the next main resistance is 0.33 which is highly possible since the weekly rsi is above 50
I think the bear cycle has completely ended for this coin and bull has taken over for long run
good luck

RSI Spikes an correlating market structure.When using .768 and .236 for the upper and lower RS] bands, and then drawing a rectangle around all correlated candles, you can see how clearly the market reacts to these areas of interests in high value.
When, combined with the three primary market sessions drawn as an indicator based on Jerusalem time zone, it is clear to see how to exploit this and time your entries and exits with a moderately higher chance of accuracy than without or with traditional Fibonacci levels. I will often draw a candle around the first 15 minutes of market price in the day based on Jerusalem the timezone, (not showing on chart) thusly, giving a very accurate area of interest and high value as well.

RSI Spikes an correlating market structure.When using .768 and .236 for the upper and lower RSI bands, and then drawing a rectangle around all correlated candles, you can see how clearly the market reacts to these areas of interests in high value. When, combined with the three primary market sessions drawn as an indicator based on Jerusalem time zone, it is clear to see how to exploit this and time your entries and exits with a moderately higher chance of accuracy than without or with traditional Fibonacci levels. I will often draw a candle around the first 15 minutes of market price in the day based on Jerusalem the timezone, (not showing on chart) thusly, giving a very accurate area of interest and high value as well.
