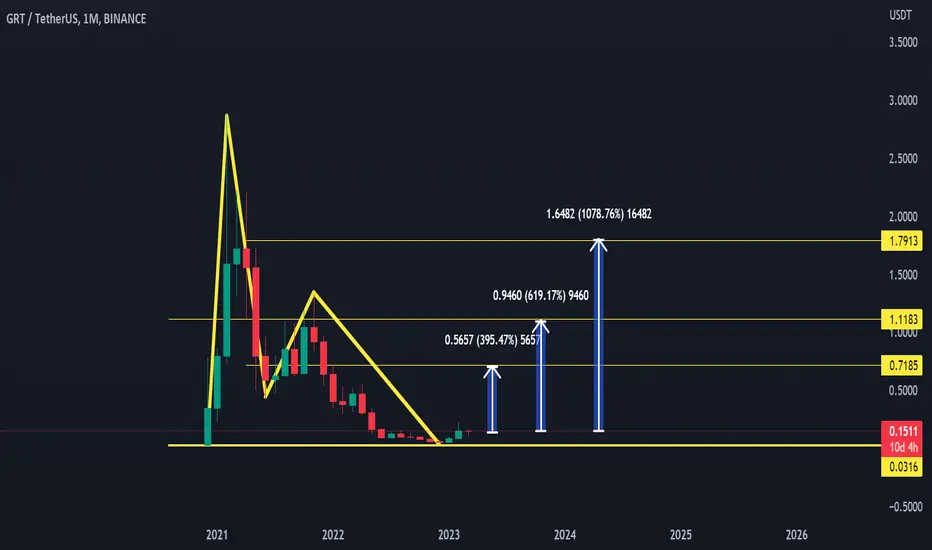
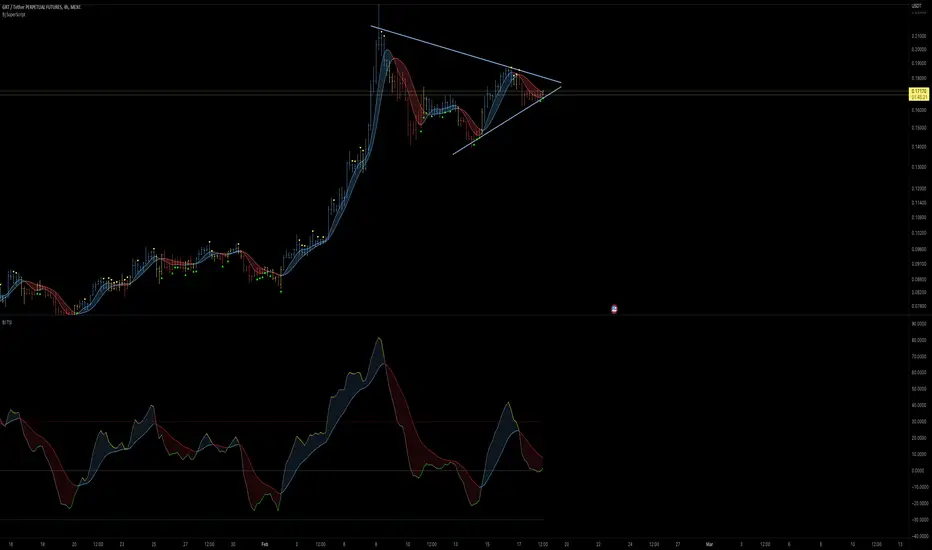
GRT Triangle bigger than originally thought.After several candle close outside of the original yellow triangle, it is clear that the more valid triangle is now this bigger tan triangle. We can see the top trendline of the tan triangles trajectory angle also matches the angle of the purple descending channels as well for added confluence. While that means we haven’t yet actually broken up out of the triangle just yet, the good news is when we do the breakout target will be higher than original expected. I arbitrarily placed the breakout measured move target line here for a rough estimate. opefully it breaks out of the triangle somewhere close to this region. *not financial advice*
GRTUSD

GRTUSD breaking up from symmetrical triangleShown here in yellow. If price action holds the 1 day 50ma (in orange) as solid support. The triangle should break up and take us above the horizontal green channel trendline. *not financial advice*

GRTUSD long (76 % gains) NEWGRTUSD has been correcting after making 320 % gains and currently the price remains under the downsloping reistance line.
Spot trading - Long setup:
entry: 0,1189 $
Target: 0,21 $
Good luck

$GRT 1ST LOOKgraph breaking out and heading to .50 IMO
tested the downtrend line
currently using 18 week high/low channel as support
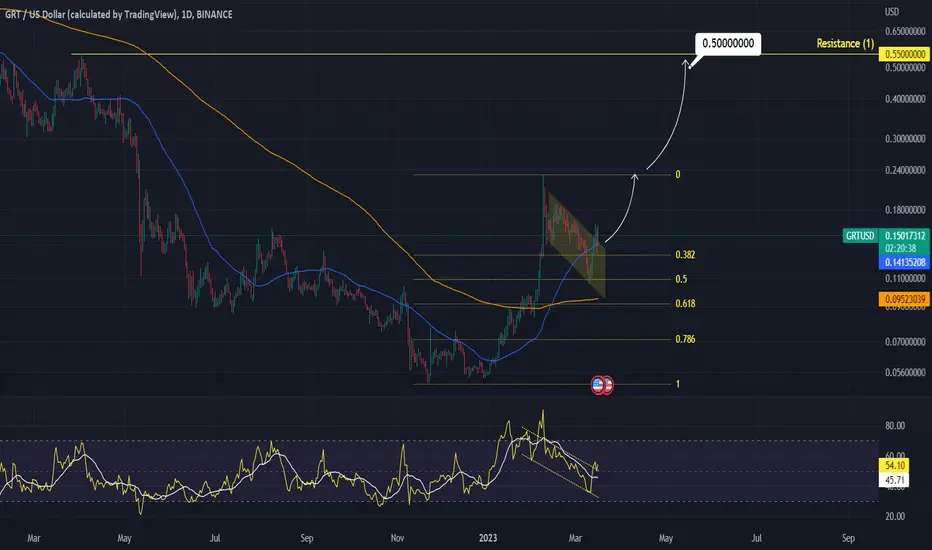
GRTUSD Bull Flag completed. Huge rally ahead.GRTUSD just broke above its Bull Flag pattern as well as the MA50 (1d).
With the MA200 (1d) supporting on Fibonacci 0.618, we see this as a solid long-term buy opportunity.
Trading Plan:
1. Buy on the current market price.
Targets:
1. 0.5000 (right under Resistance 1).
Tips:
1. The RSI (1d) has also broken above its own Bull Flag.
Please like, follow and comment!!
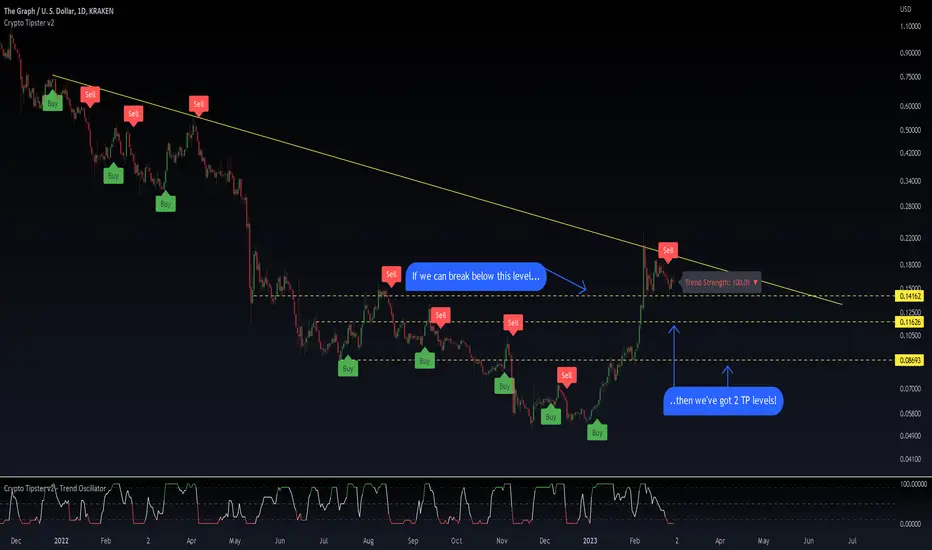
GRT/USDTGRT losing steam and starting to show first signs of trend shift.
If it loses this support it will go down hard imo.
Currently trading at Mid Range, expecting Range Lows in due time.
This is a swing short for me and I will have 2 Targets as shown on the chart.
Follow, like the idea and feel free to leave a comment.
Check out other ideas if you like this one.
#GRTUSD - 25-50% Drop Incoming#THEGRAPH is showing signs of turning relatively bearish sometime very soon. We've had a big pump up and now support is spread thin.
If price was to drop under the nearest level of support we can see losses of at least 25% initially, with potential for twice that.
What Do You Think?
If you enjoyed or agree with this idea - drop us a comment, like & follow! 😀
Ideas by theCrypster meet the guidance notes and disclaimer as mentioned below and within our website. See Signature for more info! ✌️
🔥🔥🔥
Crypto Tipster v2
theCrypster
🔥🔥🔥
fib time zone real or load of crabs?BINANCE:GRTUSDT
fib time zone real or load of crabs? find out next monday feb 27 00:00 UTC-8!

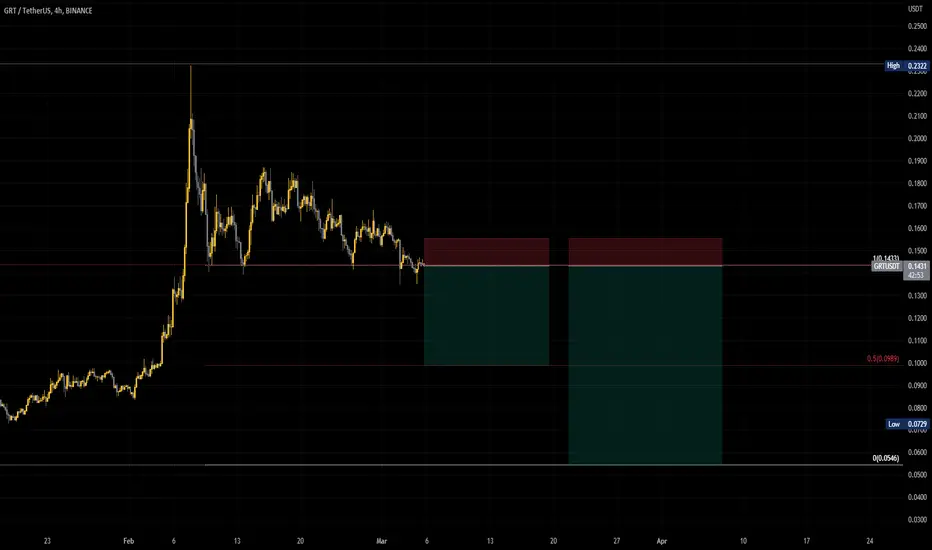
GRT/USDTIn the four-hour time frame, it loses the support of 100 ma.
The upcoming support is the range of 0.14 to 0.1420, which if it cannot maintain, it will correct to 0.13.
If bitcoin falls to 21-20 thousand dollars, this currency can correct up to the range of 0.10 dollars.
In general, it is in a very good condition. In the daily time, it can rise to $0.3, provided that Bitcoin either Range or rises.
GRTUSD ❕ trading in rangeThe volatility of trades decreased as did the volumes.
Price has fixed above 50EMA (4H TF).
I believe that GRT can start bouncing after it overcomes the upper boundary of the range.

Graph gains 30%GRT is preparing for breakout short-term trend line.
After breakout it can reach $0.23.
It can rise to $0.5 in second step.

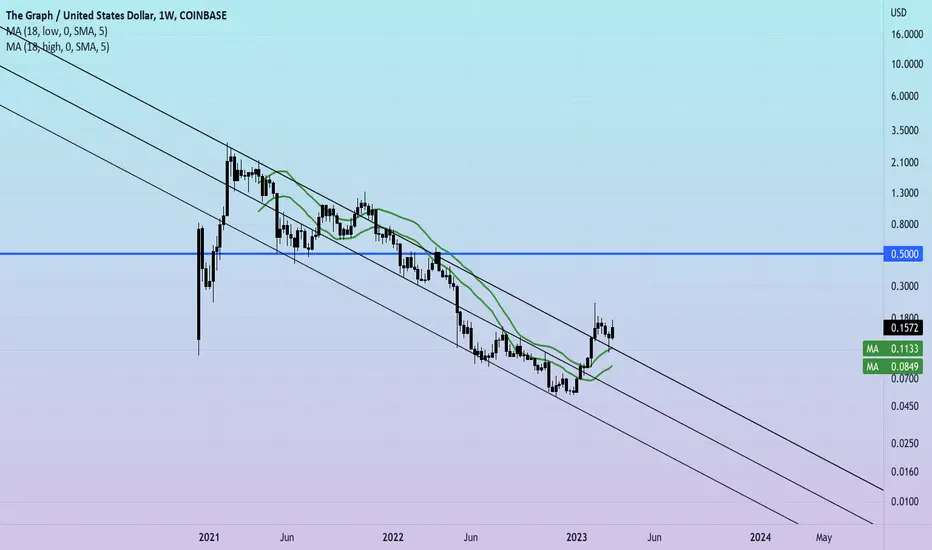
VOXEL looks like FIL at $5 and like GRT at 8c- FIL reclaimed the June-Oct '22 range, then pumped above it.
- VOXEL just reclaimed the June-Oct '22 range, and looks poised to pump.
VOXEL now looks like FIL looked at $5 or like GRT looked at 8c. Alts will play only as long as BTC hangs in there. If BTC crashes, then all this goes out the window.

Long: FTM/USDT.P, MATIC/USDT.P, and GRT/USDT.Pentered these a little hastily a little while ago but i'm thinking there may be just a tad more bullish price action to squeeze out from the insane moves we've seen recently.
i'll be playing these really defensive, moving stops up and scaling out as needed

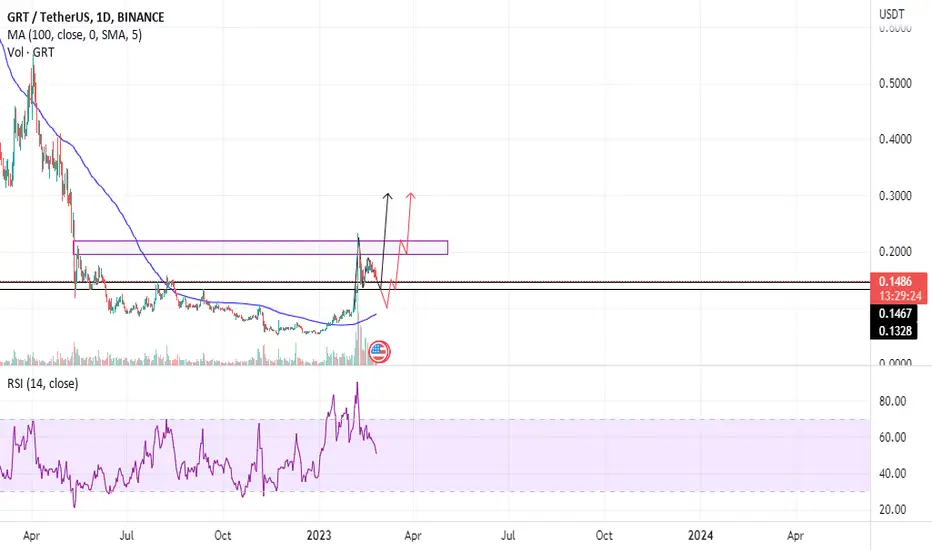
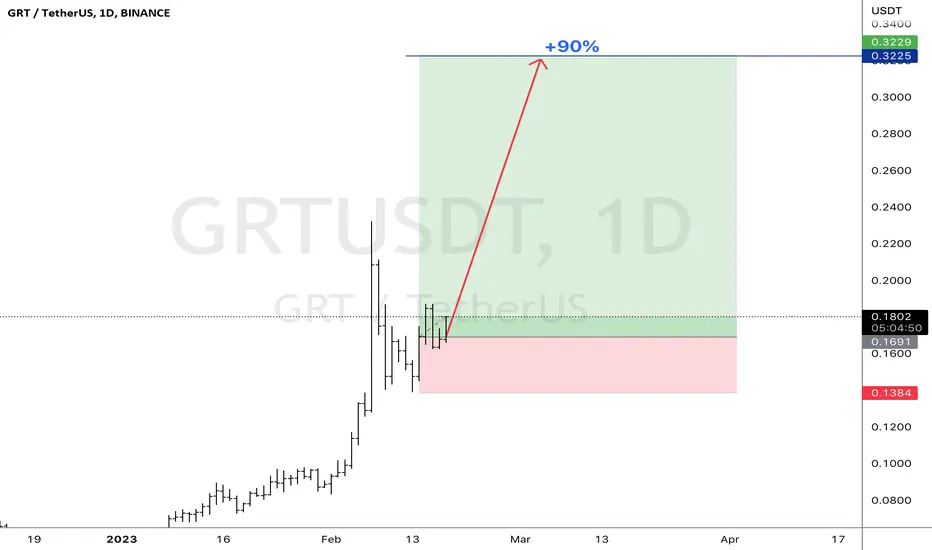
GRTUSD BullishGRT The Graph has very strong uptrend, SL zone is $0.1384 TP 0.3225 risk reward 1/5. All indicators and price action shows that big players entered long ...
THE GRAPH/GRTUSD UPDATES
If you hold this, we hit TP2. Not financial advice.
Im looking for short.
Congrats and check me out for more free ideas crypto and forex
Thank you.
Follow for more.
.
GRT The Graph LONG 20230214Signal:
Red -> Green
Context: Green * N
GRT, The Graph, GRTUSD , GRTUSDT, GRTUSDTPERP , CRYPTOS, CRYPTOCURRENCY
DISCLAIMER
This is only a personal opinion and does NOT serve as investing NOR trading advice.
Please make your own decisions and be responsible for your own investing and trading Activities.

GRT (the graph) Is confirming breakout from descending channelWe can see here on the weekly chart that GRT (aka The Graph) has broken up from its descending channel and price action is currently very close to the descending channel’s breakout target. Much like many other crypto assets at the moment, we can also see that that descending channel has a large flag pole attached to it as well forming a bear flag. While the descending channel has validated its breakout, it is as of now still uncertain whether or not the bearflag will confirm a bullish breakout as well and pull an inverted Bart pattern. However, CoinMarketCap’s rankings of the “most valuable AI and big data crypto projects and tokens” currently has The Graph as the leading platform in market capitalization. According to Pablo Jodar, a crypto analyst at GenTwo, “I think it is linked to the rally on AI stocks, due to the ChatGPT effect.” Consider all the hype behind AI focused cryptos at the moment this greatly increases the probability that GRT will also confirm the bullish breakout up from the bearflag and reach the higher bearflag target as well. I have posted both targets here on the chart and will update this post once each target is hit. GRT is an indexing protocol that is setting itself up to be the decentralized google for searching blockchains.
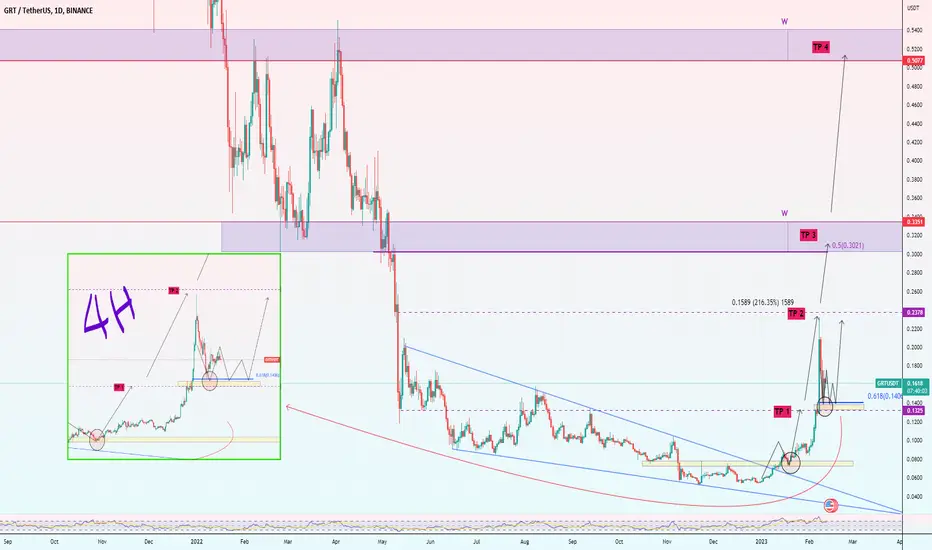
GRTUSDT, new opportunity to growth, THE GRAPH. Update2Hello guys. This is an update of previous analysis (blow link), As you can see on the chart the first and second targets with 216% reached, and then the price corrected to fib 61 and needs some rest here and has a good support base on TP1, for now I expect the price fill the weekly candle shadow and new ascending is on If the whole market follows. So I expect growth to the other targets. The targets will be 13 - 23 - 30 - 50.
Good luck.
If you like the idea, do not forget to support with a like and follow me for next analysis :)
Write your comment and opinion below for me
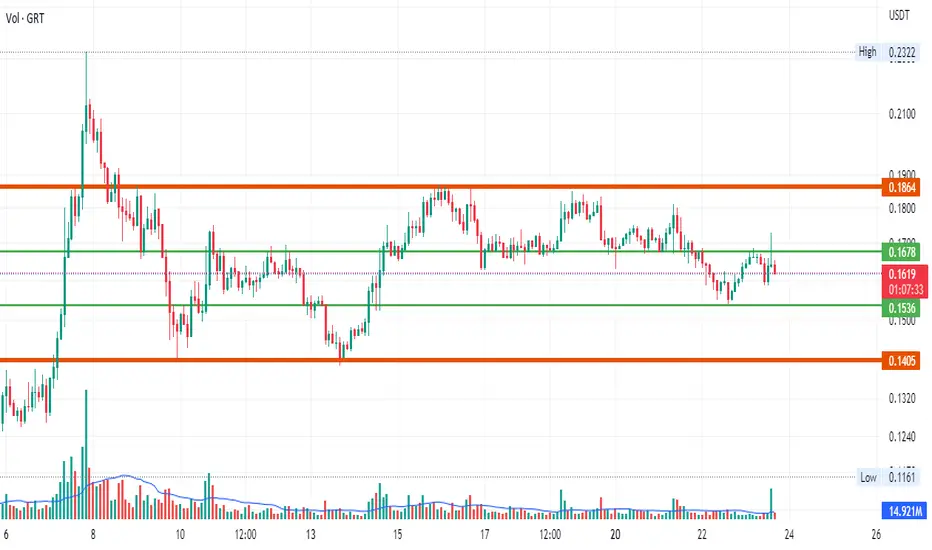
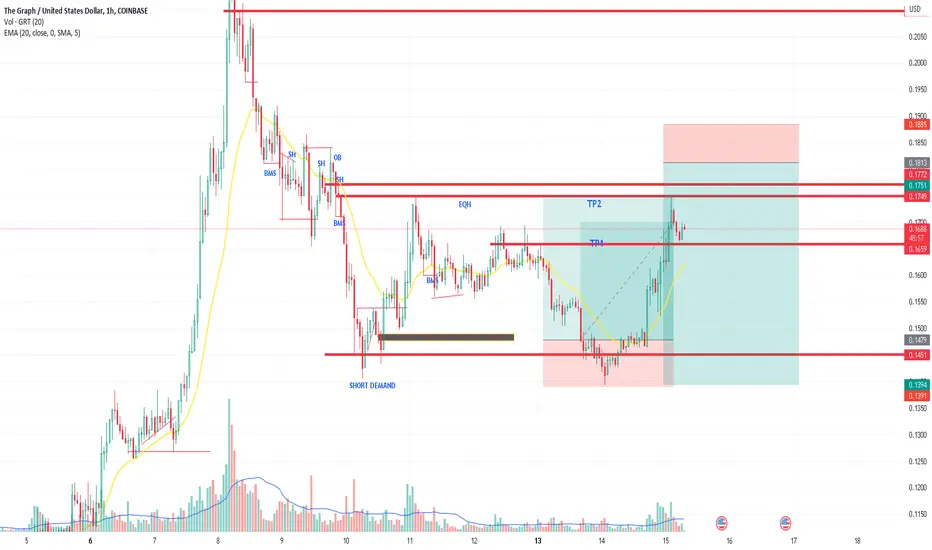
The Graph ($GRT) - demand zone and range $GRT The Graph
-> Continuation on a break above .1680
-> holding range eq atm
-> ideal long zone below in green (.618)
Either current level holds or green for a long setup. I prefer green but if this pushes we may have already got our chance to buy there with the local low.
Below green I think the major move is over on a macro level.
Vatsik

GRT/USDTSPOT BUY PLAY:
GRT /USDT BROKE the consolidation range and retested it in small timeframe. Once it retest the same in bigger timeframe. That's where the game begins.
Buy Zones are always mentioned on the charts itself with potential TAKE-PROFIT zones.
STOP-LOSS = 25% below the average buying price
TAKE-PROFIT zones are mentioned in the chart itself. DYOR.
Always DO YOUR OWN RESEARCH before taking any trade or before investing your hard earned money.
Suggestion/Tip – It is always better to take profit, whether all the zones are bought or not.
Suggestion/Tip 2 - When price is moving on right way
"it is always recommended to move stop-loss to profit side".
If you like the idea and benefited from it please like , share & comment to keep us motivated.
