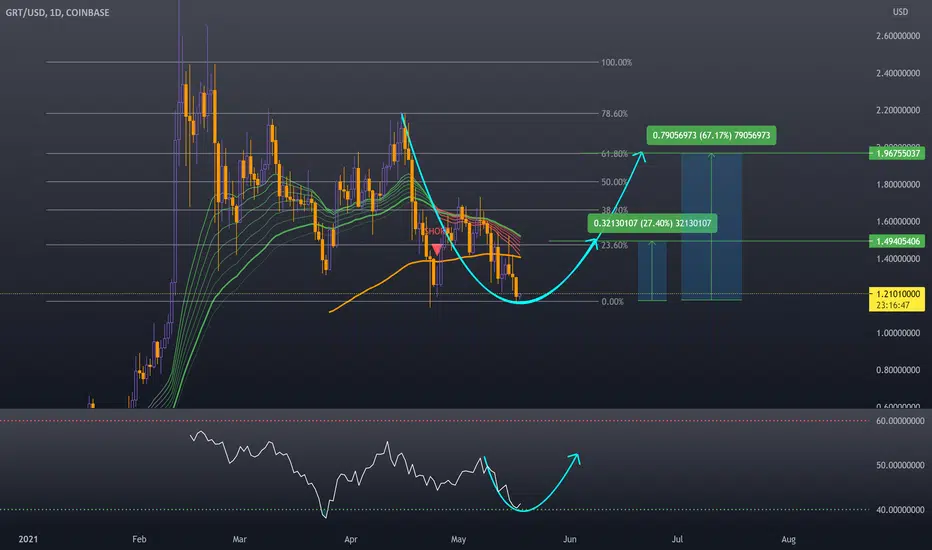
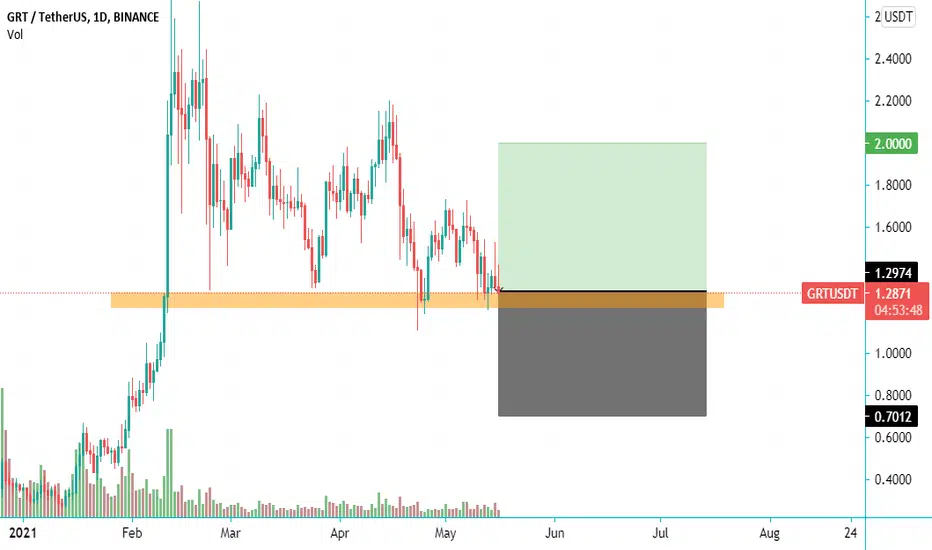
Grtusdt

TheGraphWhen peoples see Despairs and fears, i see opportunities. Double Bottomed here. Patience is your weapon.
Trading Parts :
- Buy Zone Now
- Rebuy Zone 1$ ( Strong Buy )
TP1 : 1.49$ (Security TP)
TP2 : 1.96$
Stay safe, follow BTC and don't be greedy !
Happy Tr4Ding !
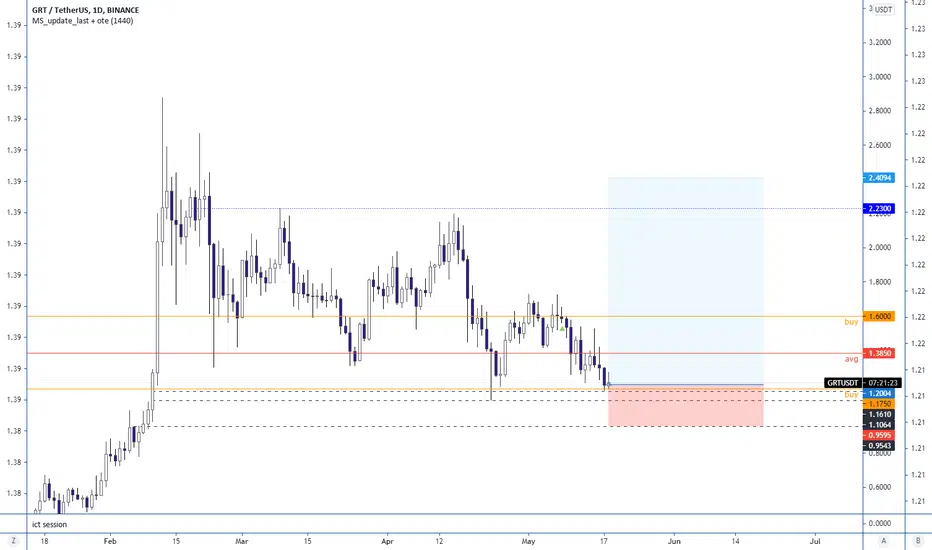
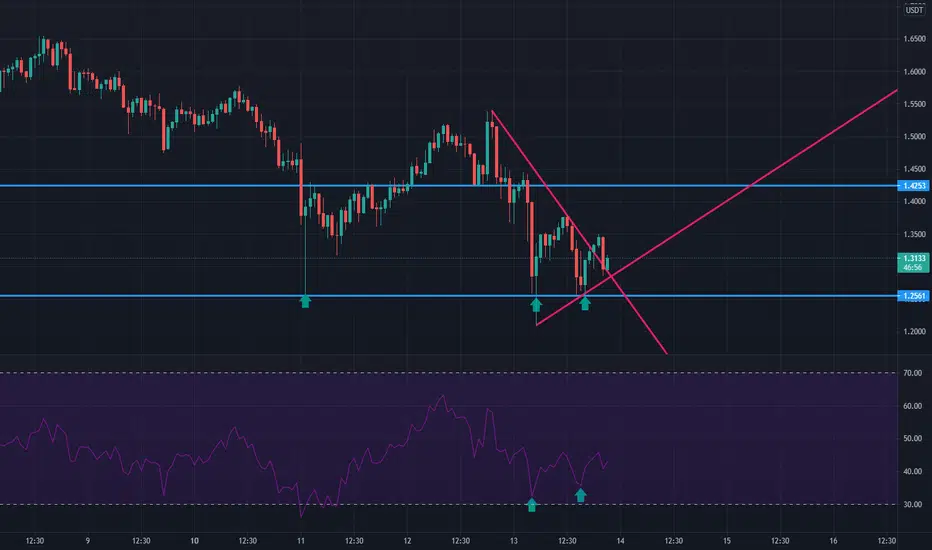
GRTUSDT short term ideaPlease be aware that BTC must hold $45k support however, GRT has found support during this fear at the levels shown.
Some great longer term holding potential too.
What do you guys think?
Stay patient, watch BTC.

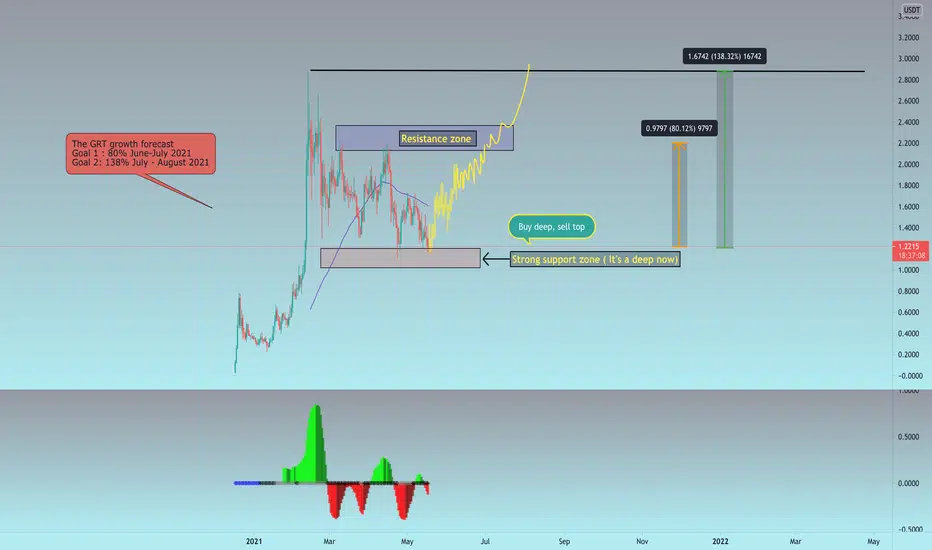
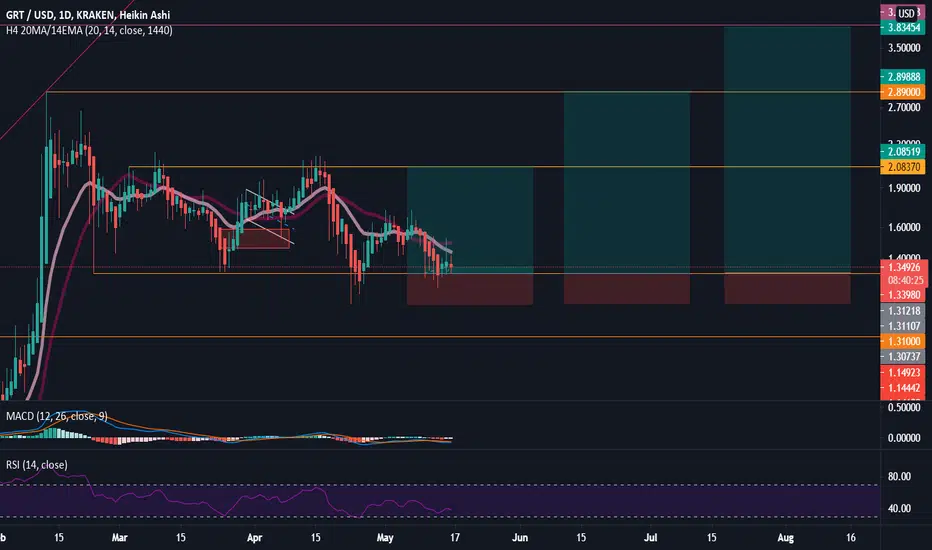
GRT/USDT. Low risk. Good Profit*DEFI
The Graph (GRT)
Rank 75
Max supply 10 Bn
Circulating 1.25 Bn ( 12.5% of 100%)
Goal 1 : 80% profit (return to resistance zone) - June-July 2021
Goal 2: 140% profit (exit from resistance zone and made a new ATH) - July-August 2021
Don't Forget subscribe, i Will be adding more coins - soon.
Profits to everyone!
GRT/USDT forecast by imRedaSouhail.The Graph is an indexing protocol for querying data for networks like Ethereum and IPFS, powering many applications in both DeFi and the broader Web3 ecosystem...The Graph team includes professionals from the Ethereum Foundation, OpenZeppelin, Decentraland, Orchid, MuleSoft leading up to the IPO and acquisition by Salesforce, Puppet, Redhat, and Barclays.
The Graph has built an open data layer on top of blockchains: Indexers can run their own Ethereum archive nodes to run Graph Node, or they can use node operators like Infura or Alchemy.
Any analytics company can build an application to query subgraph data that’s indexed by The Graph. Subgraphs are open APIs to be able to pull data from the blockchain in the most seamless and efficient way.
My Predections :
Th graph token can reach 2$ price easily in the next couple weeks and it might x3 or x5 in the next couple years.
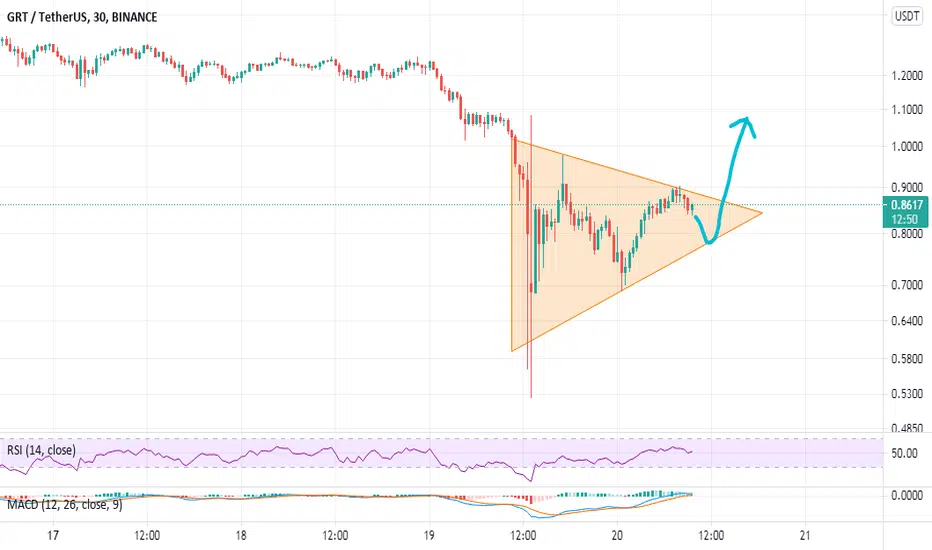
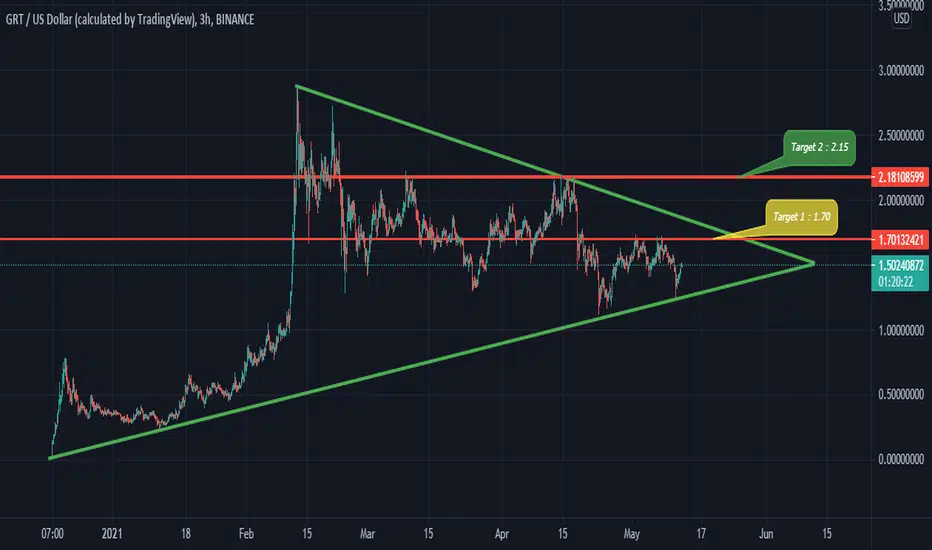
GRTUSDT Bullish viewGRTUSDT formed triple bottom and breaks the trendline supporting with rsi which forms higher highs. so i go for long position here. if you like my idea consider it otherwise please ignore it .
#mrspray
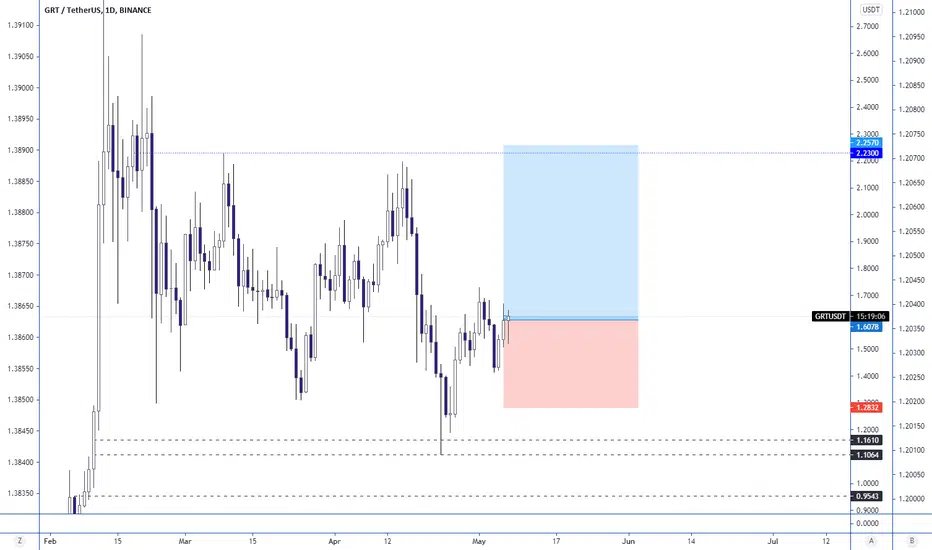
GRT: Defi PulseI am watching for Defi to make big moves this year... GRT is a project that I have been watching since the beginning and seems to be a promising project. With that said, here is an update on my trade set-up for this coin. So far on the daily I have had three entries- stop lose and take profit have not changed! Not Financial Advice... CHEERS!
GRT has a good patternIt has two beautiful pattern. If breaks first one, then second! if second breaks, it would have a good growth. I think it will be occur. Otherwise you can take a short position.

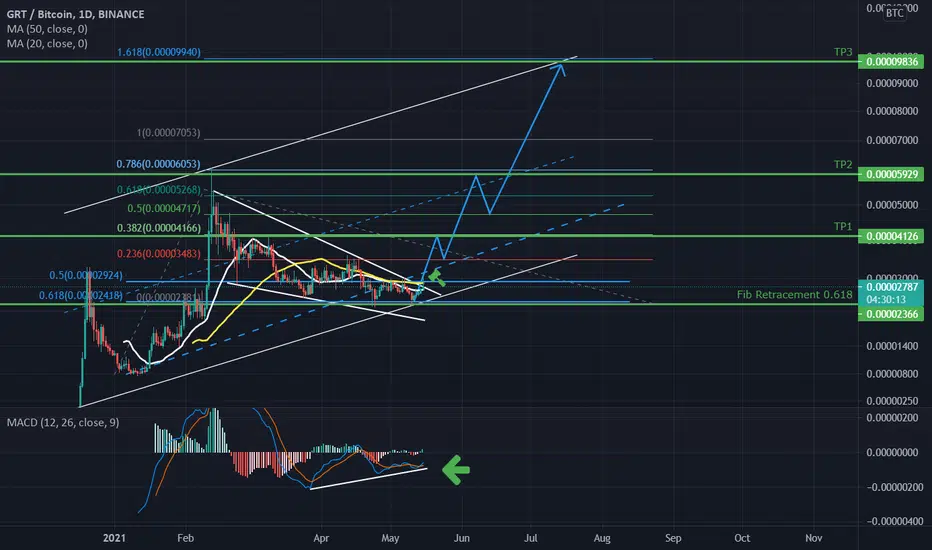
GRT/BTC-1DGiven the positive divergence in the MACD indicator and the positive reaction to the 0.618 Fibonacci area, if the downtrend line is broken and the price can stabilize above the Moving 20 Daily , we can expect growth up to the uptrend channel.
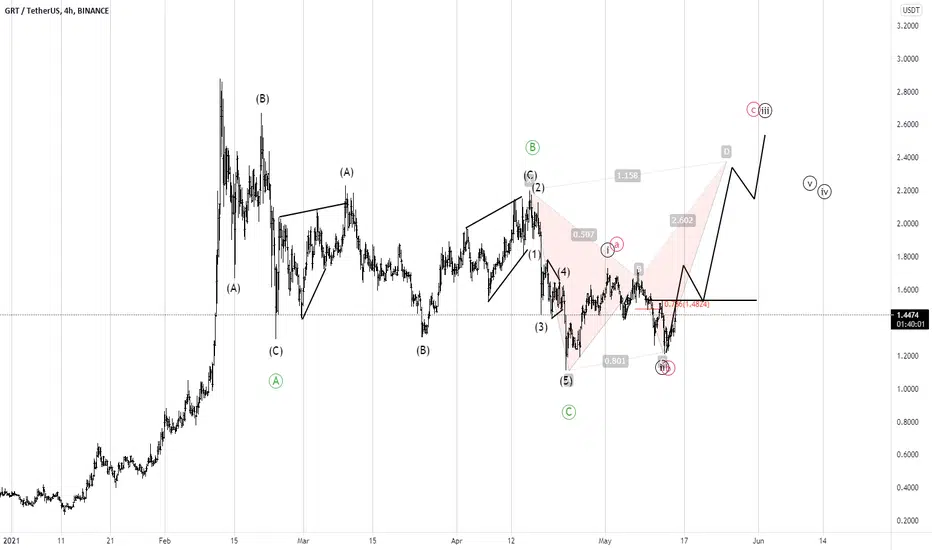
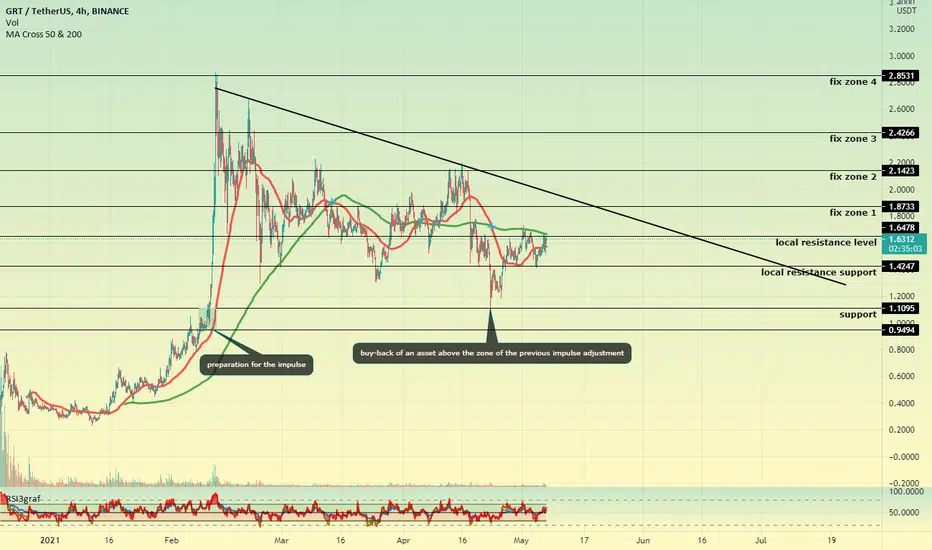
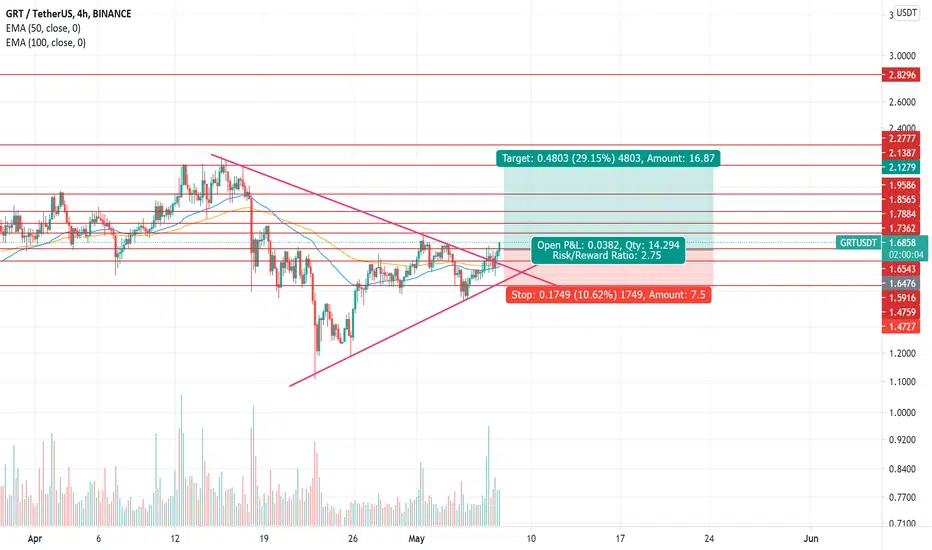
GRT/USDTGood day to all, analysis of the GRT coin and its prospects. At the moment, in the pair to USDT, the asset price is moving in a downtrend, a bullish signal is formed for the intersection of ma 50 and 200.It is worth noting that the asset was bought off above the last zone of the beginning of the momentum.
consider the bitcoin chart to understand the medium-term outlook.
all that I think about the further movement of the price I have noted on the chart!
Consider the risks when working with this asset, do not enter into a deal for a large part of the depot!🙌
If you liked this idea, put 👍, write what you think about this analytics in the comments, subscribe ✔, thank you for your attention.🔥😉
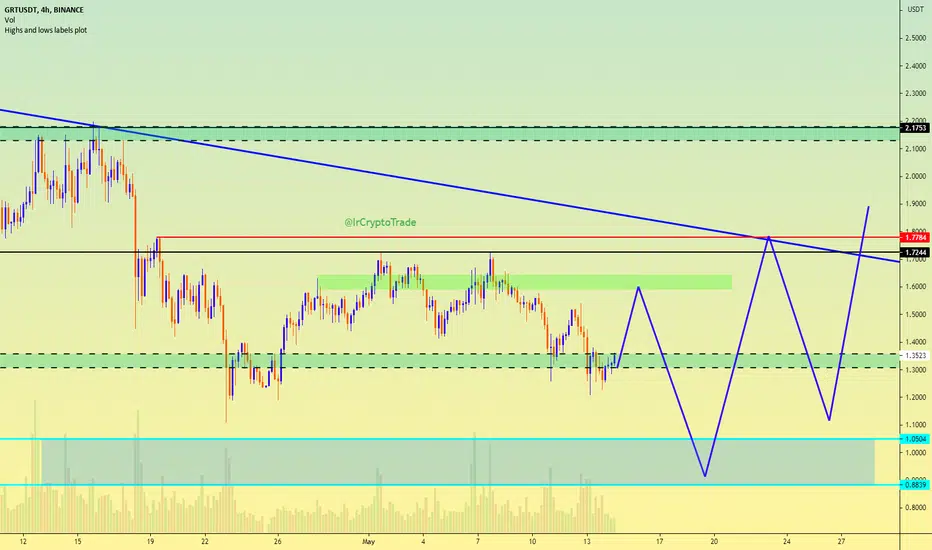
GRT AnalysisI think the main level to which we have to wait for the price reaction is lower (within the blue range) so I expect the price to fall to reach the low level with the TM pattern and then continue the uptrend to penetrate the upper main node.
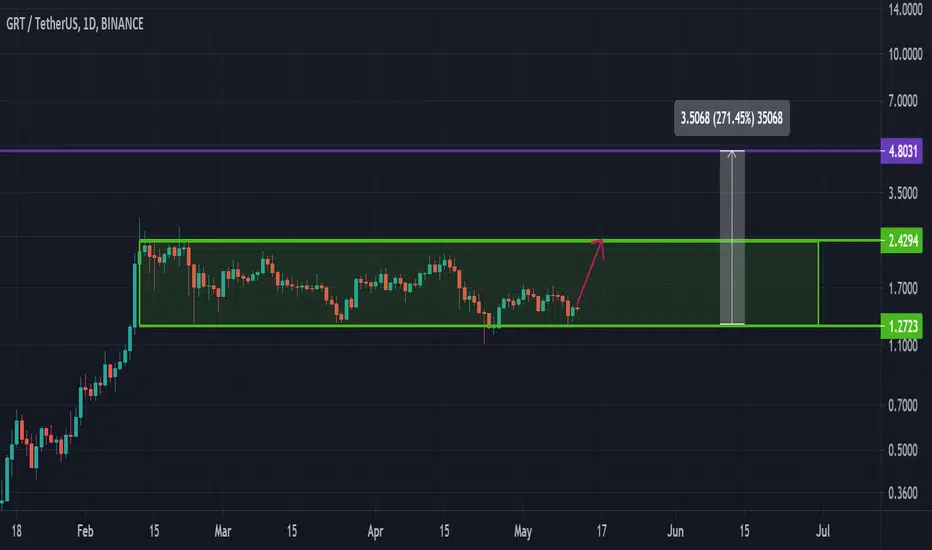
The Graph 📈 Nice Structure ✅The Graph is showing very nice structure after rejecting strong SUPPORT now we expect price to start strong bullish move 📈
We ready to jump in trend ...
Soon you will see The Graph at 2 USDT
Any question @FxShzd

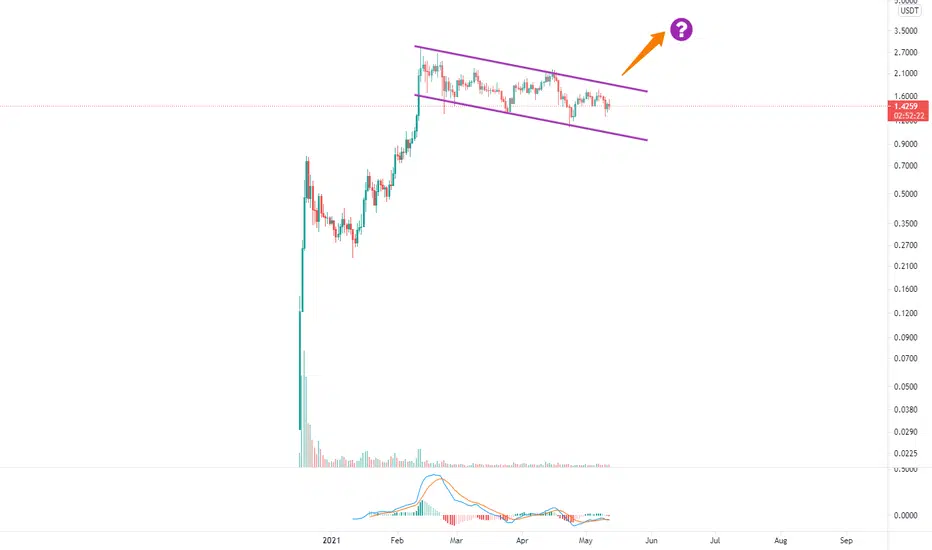
GRT > Could Hit Ath 3.40 120% from Here!I hope you are feeling generous and loving today to give me a like and leave a comment it will really support the creation of new free ideas for you.
Analysis on #GRT
Hello friends.
GRT has some value but I don't think it is getting the attraction it deserves and this could change when GRT breaks from this bull flag to ATH and hits 3.40 almost 120% from here.
Safe trading everyone
Check today analysis below⠀
>> “Time is your friend; impulse is your enemy.”
_____________________________________________________________________________⠀
-Disclaimer: This information is not a recommendation to BUY or SELL. It is to be used for educational purposes only⠀
-Please note this is just a PREDICTION and I have no reason to act on it and neither should you


Graphing the GraphI have a love-hate relationship with the Graph.
It’s been in a downwards channel since reaching its ATH in February! It looked like it would break out just when the last BTC dump happened on April 18 and has been recovering since.
Is this finally it? Is the Graph finally going to start moving upwards again?
It appears to have caught a trend line that’s moving the price action upwards and could finally push it over the long line of resistance.
I see it hitting 3.70 but if it makes a similar move as before then 11.73 is in play.
GRT has shown to dump very hard when BTC drops in price and does not recover nearly as quickly as other coins do so be warned.
You can wait for a strong confirmation and possibly a retest of the resistance line as support before entering a long position.
The potential upside is huge so missing a few percentage points is not the end of the world.
The BTC pair looks promising as well.
BINANCE:TRXUSDT
