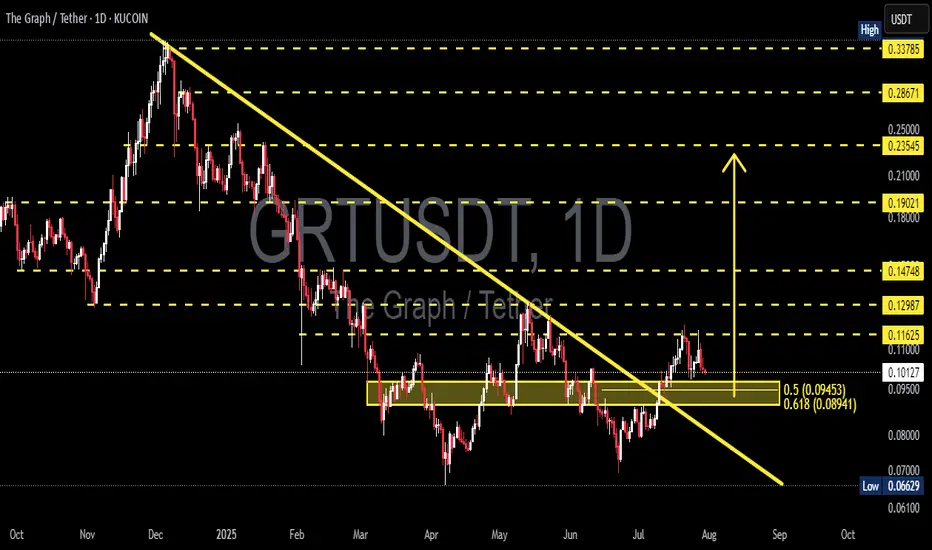
GRT/USDT at a Crossroads: Golden Pocket Retest or Breakdown?The GRT/USDT chart is currently at a critical technical juncture, presenting a high-probability setup for both breakout continuation or breakdown rejection. Here’s a breakdown of the key elements visible on the chart:
---
📐 1. Major Downtrend Breakout
GRT has been in a long-term downtrend since its peak in late 2024, with a well-respected descending trendline acting as resistance.
In mid-July 2025, the price broke above this trendline, signaling a potential trend reversal from bearish to bullish.
While volume was moderate, the breakout is technically valid.
---
📊 2. Golden Pocket Fibonacci Retest
Price is currently retesting the critical Fibonacci retracement zone:
0.5 = $0.09453
0.618 = $0.08941
This range is widely known as the “Golden Pocket”, a high-probability bounce zone during bullish continuation setups.
Price is currently sitting inside this zone, which makes this a potential low-risk entry area.
---
🧱 3. Key Historical Consolidation Zone
The area between $0.089 and $0.095 is not only the golden pocket but also aligns with a strong historical consolidation zone from April to June 2025.
This level acted as both support and resistance, making it a key technical and psychological level.
---
⚔️ Potential Price Scenarios
---
📈 Bullish Scenario (Upside Potential):
If price holds and bounces from the $0.089 – $0.095 support zone:
1. Initial resistance targets:
$0.10185 to $0.11000
2. Followed by breakout targets:
$0.11625
$0.12987
$0.14748
3. Medium-term bullish targets if trend continues:
$0.19021
$0.23545
📌 Bullish Confirmation Signs:
Bullish engulfing or strong reversal candle on the daily close.
Increased volume on the bounce.
RSI recovery from neutral (30–50) zone.
---
📉 Bearish Scenario (Downside Risk):
If price fails to hold above the $0.08941 Fibonacci level:
1. A breakdown below support may trigger further selling pressure.
2. Key downside targets:
$0.08000 (minor support)
$0.06629 (previous swing low)
📌 Bearish Confirmation Signs:
Daily close below $0.089 with strong bearish volume.
RSI drops below 30.
Strong rejection from resistance with bearish structure.
---
🧠 Pattern and Market Structure Insights
Breakout + Retest: Classic setup where price breaks a long-term trendline and returns to retest the breakout zone.
Fibonacci Confluence: The golden pocket aligns with previous price structure, reinforcing its strength.
Hidden Double Bottom (Potential): If price holds, this may also form a subtle double bottom structure — a bullish continuation signal.
---
📚 Conclusion & Trading Strategy
GRT/USDT is currently showing a technically strong setup, with a clean breakout followed by a meaningful retest at a key demand zone.
💡 If you're looking for a strategic long entry, this area offers low risk, high reward potential, provided you manage your stop-loss correctly.
---
🎯 Trade Idea & Risk Management
Potential Entry: $0.089 – $0.095
Conservative Stop Loss: Below $0.088
Initial Target Zone: $0.101 – $0.116
Mid-term Target: $0.19 – $0.23
#GRT #GRTUSDT #TheGraph #AltcoinAnalysis #CryptoBreakout #TechnicalAnalysis #CryptoTrading #FibonacciLevels #TrendlineBreak #GoldenPocket #BullishSetup #BearishBreakdown #CryptoEducation #Altcoins
Grtusdtsignal
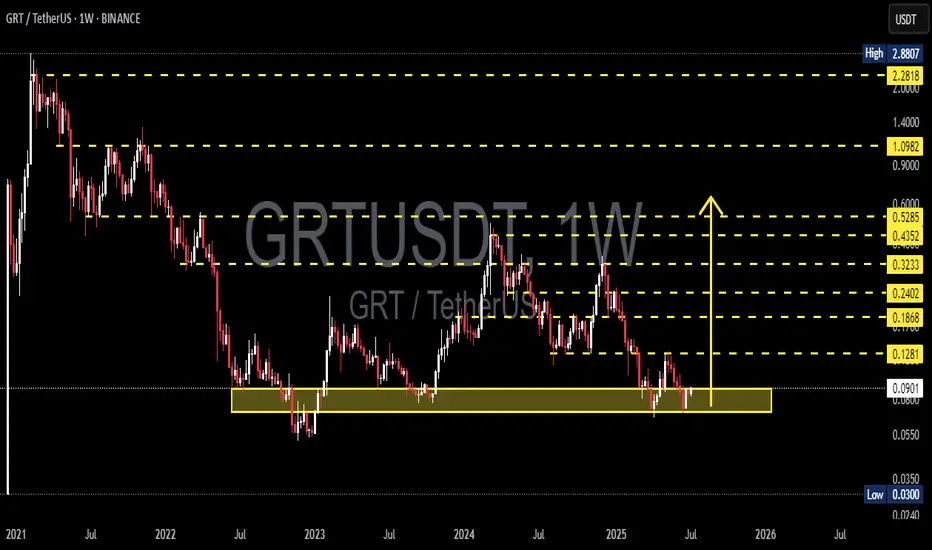
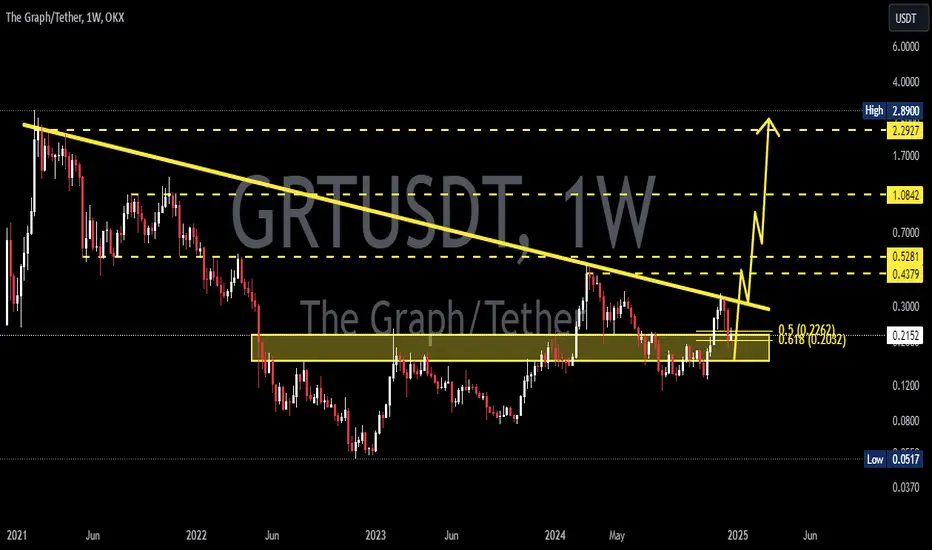
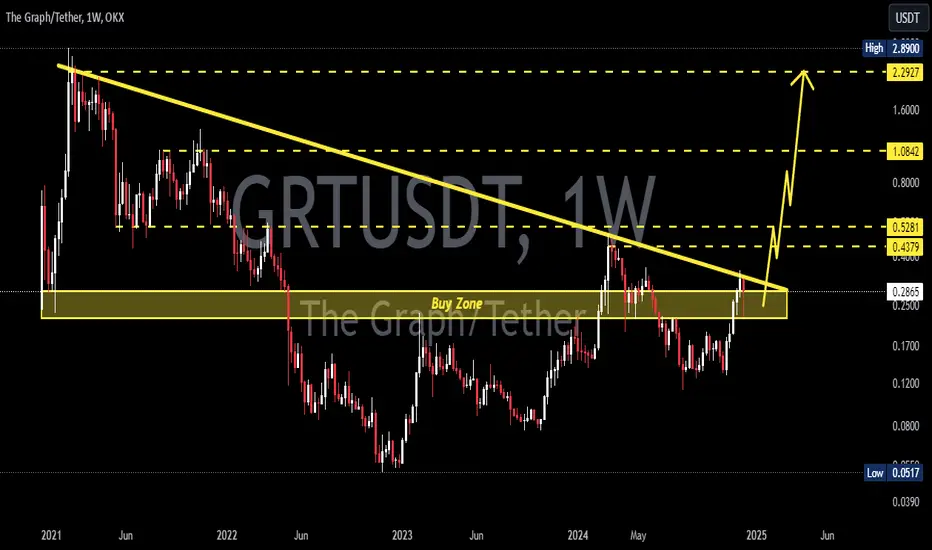
GRT/USDT at a Critical Point! Reversal Structure or Breakdown?📊 Full Technical Analysis – GRT/USDT (1W Timeframe)
🔎 Overview:
GRT is currently positioned at one of the most critical technical levels in its long-term structure. After a prolonged downtrend from the $2.88 all-time high, price is once again testing the historical demand zone between $0.07 – $0.09, which has repeatedly acted as a strong support level since mid-2022. This area represents a major accumulation zone, where smart money may be silently positioning.
🧠 Structure & Pattern Formation:
✅ Historical Demand Zone (Major Support Area):
The $0.07 – $0.09 range has been tested over 5 times in the last 2 years, showing strong demand.
This zone also acts as the potential base of a double bottom pattern, indicating a possible macro reversal.
🟡 Double Bottom Potential (Reversal Pattern):
Two nearly equal lows forming around this demand area hint at a classic double bottom formation.
Confirmation comes if price breaks and holds above $0.1281 resistance.
🔻 Declining Selling Pressure:
Sellers appear to be losing momentum, as seen in the declining weekly volume.
This could signal distribution is ending and accumulation is underway.
📈 Bullish Scenario:
If GRT holds this critical support and breaks above key resistance, a strong mid-term rally may follow:
1. Breakout Confirmation:
Valid if the weekly candle closes above $0.1281.
2. Upside Targets (Fibonacci + Historical Resistance):
🎯 $0.1868 → minor resistance / past consolidation zone.
🎯 $0.2402 → previous rejection area.
🎯 $0.3233 → key Fibonacci retracement level.
🎯 $0.4352 → strong horizontal resistance.
🎯 $0.5285 → mid-term bullish target.
3. Ideal Bullish Conditions:
Bullish divergence on the weekly RSI.
Increasing volume on breakout confirmation.
📉 Bearish Scenario:
If the support fails to hold, GRT could face further downside:
1. Breakdown Below $0.07 – $0.09 Zone:
⚠️ $0.0550 → minor support.
⚠️ $0.0300 → All-Time Low and psychological support.
2. Deeper Risk:
If panic selling occurs or broader market sentiment worsens, GRT may print new lows, continuing its long-term bearish trend.
🧭 Conclusion & Strategy:
> GRT is in a highly interesting accumulation phase from a technical perspective.
The risk-to-reward from this support zone is attractive, with signs of a potential reversal building. However, traders should wait for confirmation and always use proper risk management.
Entry Strategy:
Speculative entry: inside the $0.08–$0.09 zone (tight stop-loss below $0.07).
Confirmed entry: after breakout and weekly close above $0.1281 (targeting levels mentioned above).
#GRT #TheGraph #GRTUSDT #CryptoReversal #DoubleBottom #SupportZone #AltcoinSetup #BullishCrypto #BearishRisk #TechnicalAnalysis
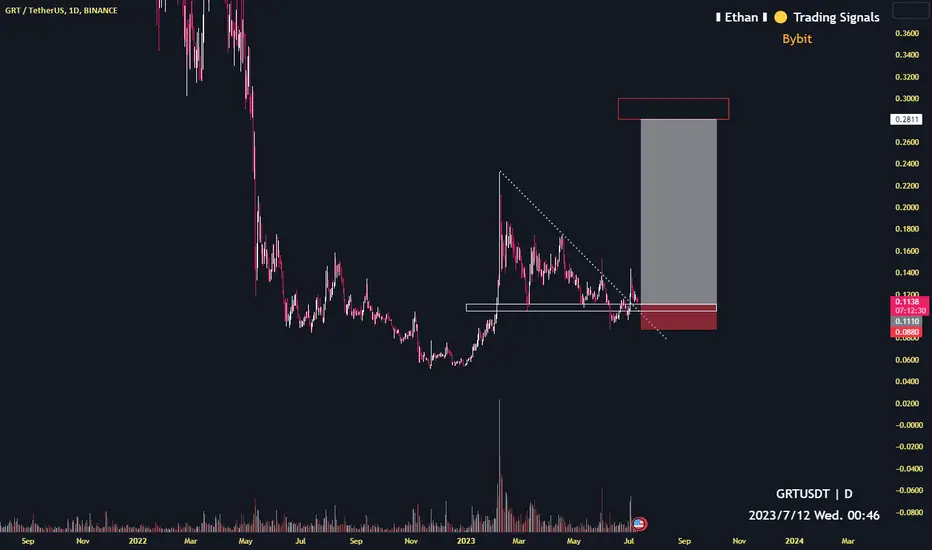
GRTUSDT 1W AnalysisGRT ~ 1W Analysis
#GRT Buy back gradually from here with a short term target of at least 20%+ from this support.
GRTUSDT 1WGRT ~ 1W Analysis
#GRT Buy gradually from here if you still have a Conviction on this Coin with a minimum target of 20%+.

GRTUSDT 1WGRT ~ 1W Analysis
#GRT If you still have Conviction on this coin, this is a very good support block for now. buy from here with a minimum target of 20%+
GRTUSDT 1WGRT Update ~ 1W
#GRT If you still have Conviction on this coin,. Buy gradually within this support block,. with a target of at least 20%+ from here
GRTUSDT UPDATE 1WGRT Update ~ 1W
#GRT rejected again from this resistance line,. If you still have Conviction on the coin,. Maybe this support block will be a very good buy zone. buy gradually with small trades,. with a minimum target of 20%+
GRTUSDT Is a Bullish Breakout in Play—But Will It Hold?Yello, Paradisers! Is #GRTUSDT primed for a bullish surge, or could we face a pullback? Let’s analyze the key levels and scenarios.
💎#GRT has confirmed bullish momentum with a breakout above a crucial resistance level, which has now been retested as support. As long as the price respects this support area, the bullish continuation remains highly probable, with the next major resistance target in sight.
💎If the support level fails, GRT risks a fakeout scenario, potentially dropping toward the $0.1895 demand zone. This level is pivotal for maintaining bullish momentum. A rebound from this area would be critical for reclaiming support at $0.225, which is necessary to sustain the upward trajectory.
💎On the other hand, a bullish invalidation would be confirmed if GRT breaks below its Higher Low (HL) structure and closes below it on the daily chart. Such a move would signal a bearish continuation, opening the door to deeper price declines.
Patience and discipline are your strongest allies, Paradisers. Wait for clear confirmations, and trade with a strategy—not emotion. Stay focused and make every move count!
MyCryptoParadise
iFeel the success🌴

GRTUSDTGRT ~ 4D
#GRT If you still have Conviction on this coin,. You can start placing Buy on this support block. Make purchases in stages with a short-term target of at least 20%++
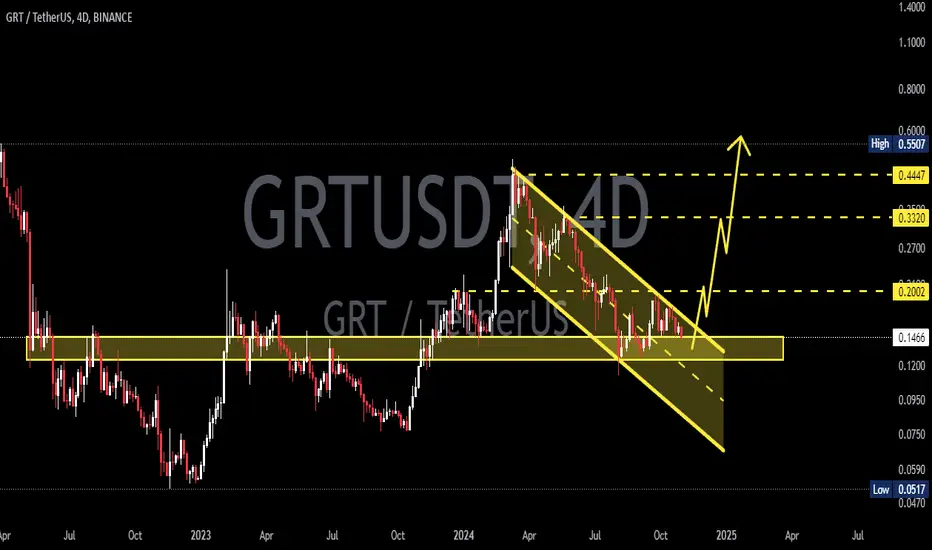
GRTUSDTGRT ~ 3D ✅
#GRT Closing the price above this descending pattern, will be a Bulls indicator for further price increases.
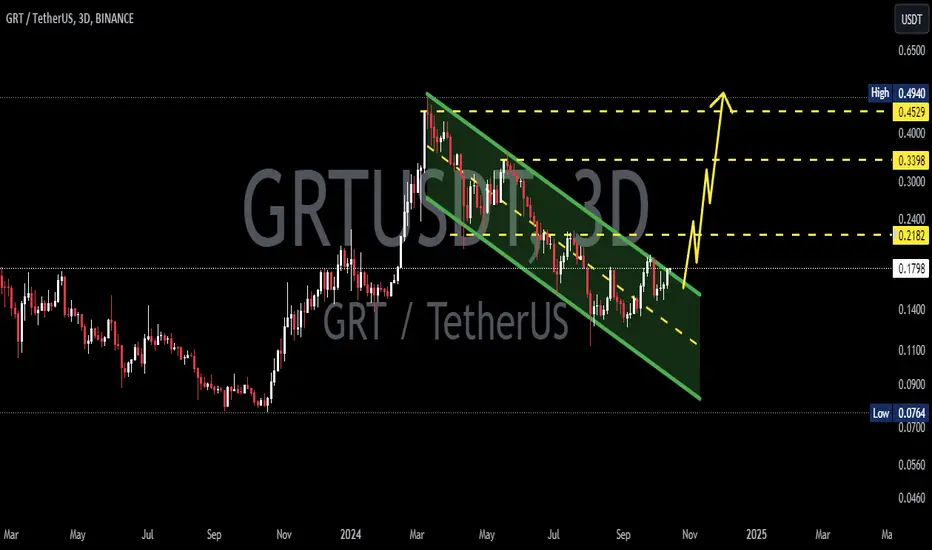
GRTUSDTGRT ~ 1W ✅
#GRT Make purchases gradually after breaking through the resistance line of this descending pattern.

GRT/USDT is need breakout the resistance to continue upward!💎 Paradisers, the recent market dynamics surrounding #GRT have been noteworthy.
💎 GRT is demonstrating significant bouncing from the support area around $0.22, coinciding with a golden cross on the MACD indicator, signaling bullish momentum for the price.
💎 Currently, the price is facing resistance at the $0.33 area, which aligns with both a horizontal resistance level and the resistance trendline of a descending channel.
💎 For GRT to continue its upward movement, it needs to successfully break out above the resistance level and the pattern. A breakout above $0.33 would not only indicate a bullish reversal but also pave the way for further upward movement, potentially backtesting the supply zone area.
💎 However, if GRT fails to break out above the resistance area and experiences a bearish rejection, it may retreat to the support area to gather new momentum for another attempt at breaking out.
💎 Upon revisiting the support area, there's potential for a bounce, but if GRT fails to bounce and breaks down below the support zone, the next likely destination is the demand area around $0.185. Here, a successful reclaiming of price above the support could lead to a significant upward movement.
💎 Conversely, if GRT fails to find support at the demand zone and breaks down below it, it would invalidate the bullish scenario, signaling further downward movement.
MyCryptoParadise
iFeel the success🌴

GRTUSDTBINANCE:GRTUSDT is attempting a retest of the 0.16242 area. Are we going to see a rejection of the zone for a continuation of the bullish move or are we going to see a further push to the lower side? Either way, #GRTUSDT will tell us its next move. Until then, fingers crossed
Updates on this will follow...
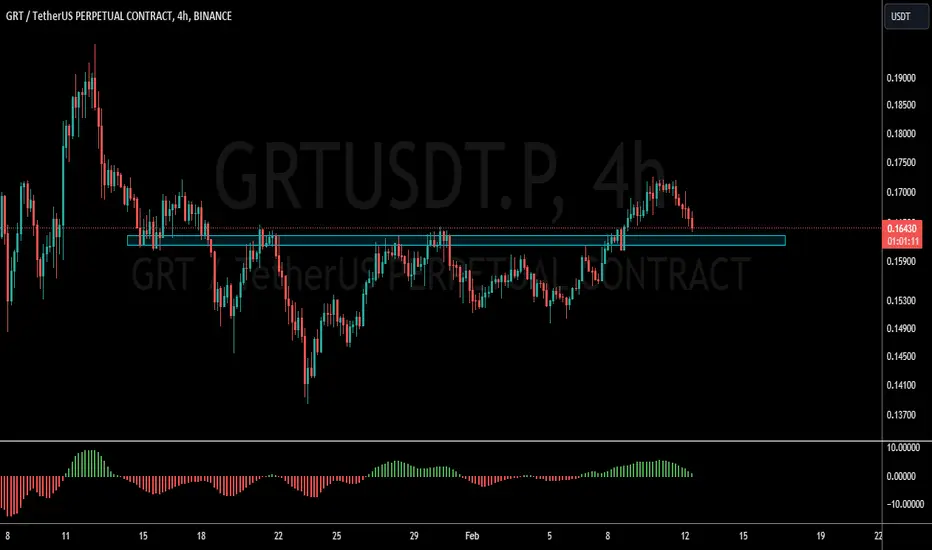
GRTUSDTBINANCE:GRTUSDT Price has been bullish for a while now. Broke the 0.1245 resistance and did a retest of the zone.
My position is bullish with Targets:
0.16624
0.23660
0.32000
A break below the zone might just trigger some bearish move

GRT target 0.251D time frame
-
GRT is breaking out the falling wedge structure, but this downtrend line is not standard due to many wicks. On higher time frame like 4h or 1D, GRT gain demand at 0.08 which is also the structural support, and face the resistance from downtrend line, if GRT can break it out with high volume, we can set target based on the wedge.
TP: 0.25~0.25
SL: 0.0745

GRT target 0.281D time frame
-
GRT retesting the triangle structure.
White zone is good entry around 0.105~0.111
TP: 0.28
SL: 0.088
*Notice risk that range to SL is 20%*
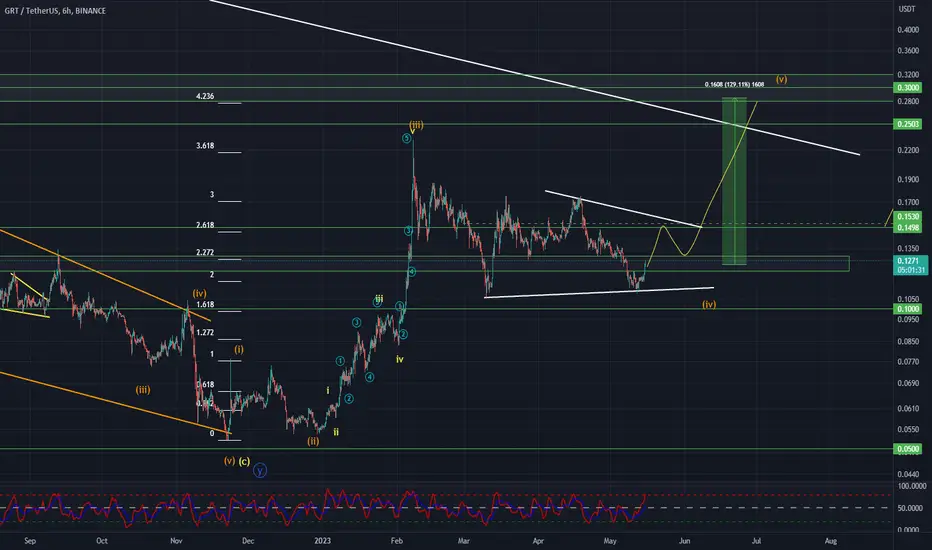
GRTUSDT Elliott Waves AnalysisHello friends.
Please support my work by clicking the LIKE button👍(If you liked). Also i will appreciate for ur activity. Thank you!
Everything on the chart. (update)
Still in pos, switched my main option on triangle in wave of (iv)
Entry: market and lower
Targets: 0.21 - 0.24 - 0.27
after first target reached move ur stop to breakeven
Stop: im w/o stop(depending of ur risk). ALWAYS follow ur RM .
risk is justified
Good luck everyone!
Follow me on TRADINGView, if you don't want to miss my next analysis or signals.
It's not financial advice.
Dont Forget, always make your own research before to trade my ideas!
Open to any questions and suggestions.
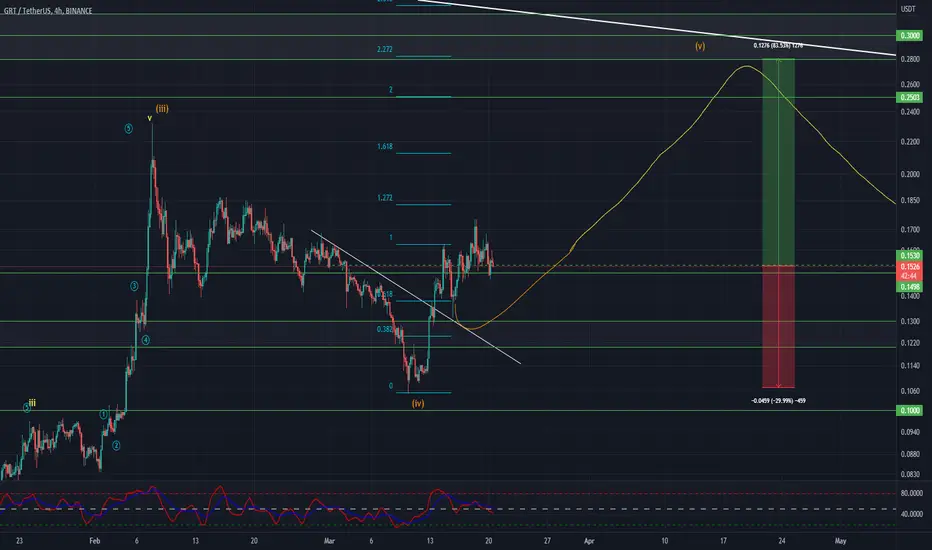
GRTUSDT Elliott Waves AnalysisHello friends.
Please support my work by clicking the LIKE button👍(If you liked). Also i will appreciate for ur activity. Thank you!
Everything on the chart.
Entry: market and lower
Targets: 0.21 - 0.24 - 0.27
after first target reached move ur stop to breakeven
Stop: ~0.107 (depending of ur risk). ALWAYS follow ur RM .
RR: 1 to 3
risk is justified
Good luck everyone!
Follow me on TRADINGView, if you don't want to miss my next analysis or signals.
It's not financial advice.
Dont Forget, always make your own research before to trade my ideas!
Open to any questions and suggestions
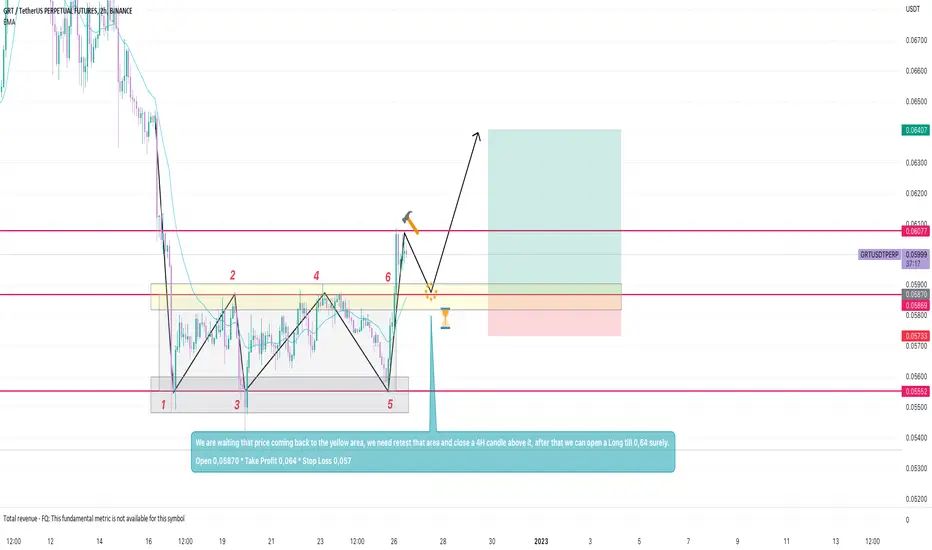
GRT/USDT. We are waiting that price coming back to the yellow area, we need retest that area and close a 4H candle above it, after that we can open a Long till 0,64 surely.
Open 0,05870 * Take Profit 0,064 * Stop Loss 0,057
GRTUSDT Analysis (perspective a couple of months)Hello friends.
Please support my work by clicking the LIKE button👍(If you liked). Also i will appreciate for ur activity. Thank you!
Everything on the chart.(update)
Nothing has changed from my last idea.
Entry: market and lower
Target: 0.52 - 0.65 - 0.85
Stop: (depending of ur risk). ALWAYS follow ur RM .
Risk/Reward: 1 to 5
risk is justified
Good luck everyone!
Follow me on TRADINGView, if you don't want to miss my next analysis or signals.
It's not financial advice.
Dont Forget, always make your own research before to trade my ideas!
Open to any questions and suggestions.
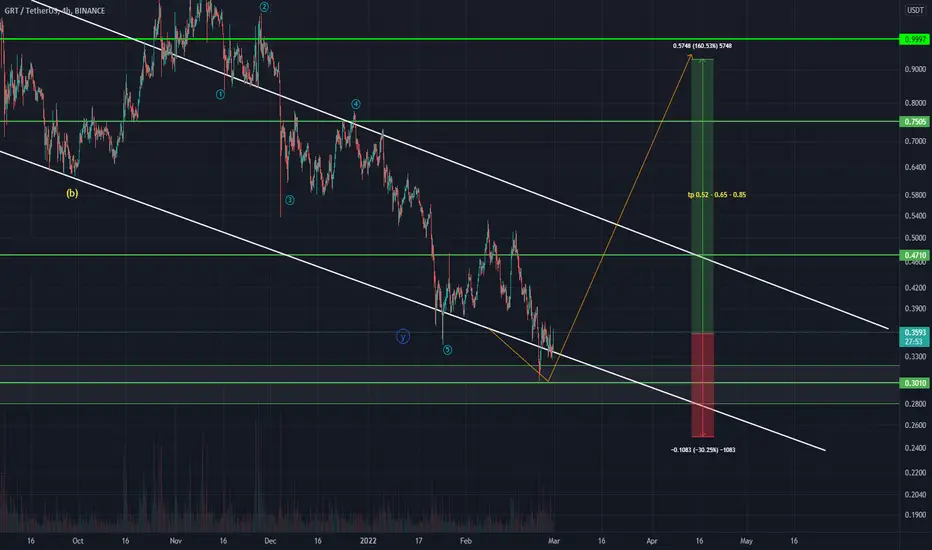
GRTUSDT Analysis (perspective a couple of months)Hello friends.
Please support my work by clicking the LIKE button👍(If you liked). Also i will appreciate for ur activity. Thank you!
Everything on the chart.
GRT will rise from the current price or through 0.3$.
Entry: market and lower
Target: 0.52 - 0.65 - 0.85
after first target reached move ur stop to breakeven
Stop: (depending of ur risk). ALWAYS follow ur RM .
risk is justified
Good luck everyone!
Follow me on TRADINGView, if you don't want to miss my next analysis or signals.
It's not financial advice.
Dont Forget, always make your own research before to trade my ideas!
Open to any questions and suggestions.
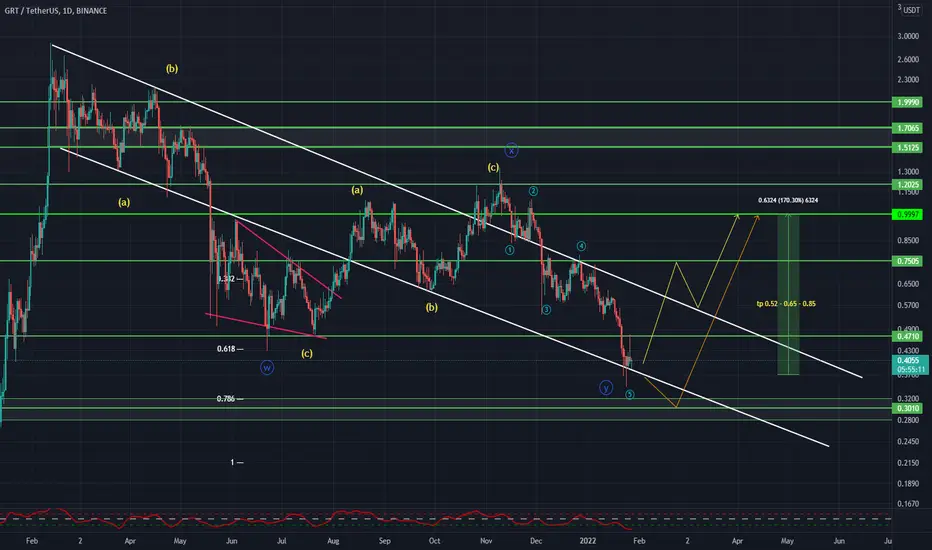
GRTUSDT GLOBAL VISION (+200% potential from here)Hello friends.
Please support my work by clicking the LIKE button👍(If you liked). Also i will appreciate for ur activity. Thank you!
Everything on the chart.
Nothing has changed from my last idea.
Perspective a couple of months.
Entry: market and lower
Target: 0.8 - 1.15 - 1.7
after first target reached move ur stop to breakeven
Stop: under 0.45 (depending of ur risk). ALWAYS follow ur RM .
Risk/Reward: 1 to 10
risk is justified
Good luck everyone!
Follow me on TRADINGView, if you don't want to miss my next analysis or signals.
It's not financial advice.
Dont Forget, always make your own research before to trade my ideas!
Open to any questions and suggestions.
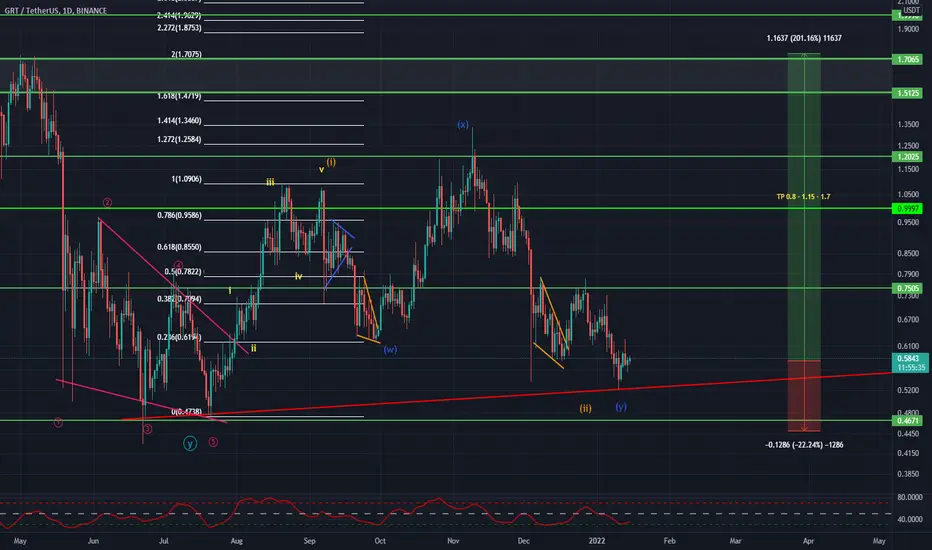
GRTUSDT Analysis (170% potential from here)Hello friends.
Please support my work by clicking the LIKE button(If you liked).Thank you!
Everything on the chart.
open pos: market and lower
target: 1.2 - 1.5 - 1.7
after first target reached move ur stop to breakeven
stop: under 0.45 (depending of ur risk). ALWAYS follow ur RM .
RR 1 to 6
risk is justified
Good luck everyone!
Follow me on TRADINGView, if you don't want to miss my next analysis or signals.
It's not financial advice.
Dont Forget, always make your own research before to trade my ideas!
