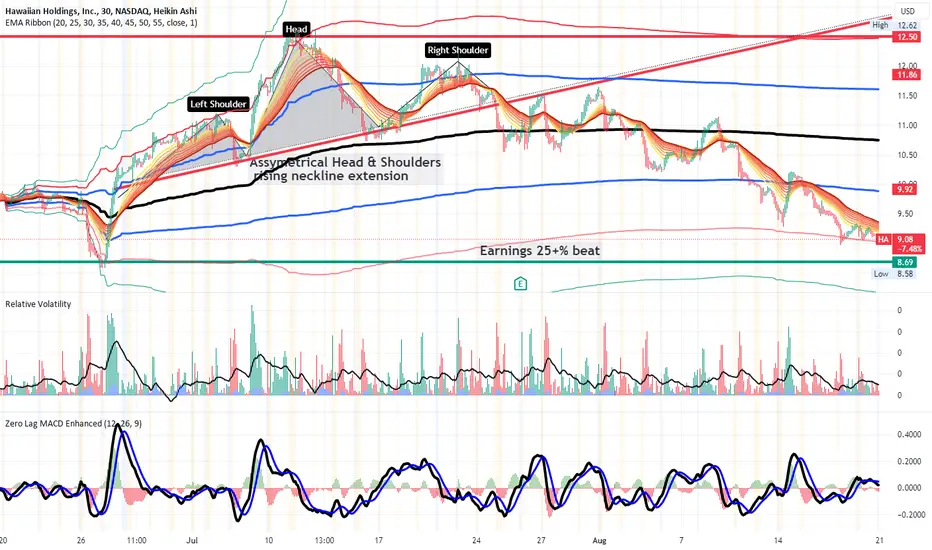
Hawaiian Airlines HA Reversal LongHA is on a 30 minute- chart. A Head and Shoulder pattern is drawn. It is assymetrical with
an ascending neckline extension. An anchored VWAP is added. Price is currently in the
deeply oversold zone near to the -2 standard aWVAP line. I see buyers and money flow
coming in at this level. The stop loss is 9. The first target is at 10.7 and so about 15% upside
in the area of the mean VWAP. The second target is the confluence of the July 10 pivot ,
the ascending neckline of the pattern and 2 deviations above aVWAP ( the thinnest red
line) at the area 12.5. This is about 35% upside. I will take this swing long trade and
investigate a suitable call option as well.
HA
Indicators that can identify trends: MS-Signal indicatorHello?
Traders, welcome.
If you "Follow", you can always get new information quickly.
Please also click "Boost".
Have a good day.
-------------------------------------
(LINKUSDT chart)
The composition of the chart consists of price and volume.
Therefore, chart analysis can be interpreted differently depending on how you interpret price and volume.
First of all, if you look at the price part, you can see that the trend and various indicators were created based on price candles and moving averages.
Therefore, it will be difficult to interpret the chart as the concept of the arrangement of the candles and the price moving average is not established.
The array of price candles, that is, the high and low points formed by connecting the candles, draws each trend line to check which direction the current price movement is moving.
However, it is necessary to be careful because it is difficult to find the highs and lows of a low time frame chart, so it is possible to draw an incorrect trend line.
A false trend line means that you drew a trend line, but did nothing with it.
The more false trend lines you have, the less information you can get from chart analysis, and the trading strategy created with such reduced information loses its usefulness, so you need a solid basis even when drawing a trend line.
With a firm basis on how to draw a trend line, we will have time to explain in detail later on how to draw it.
The MS-Signal indicator shown in this chart is an indicator that can confirm the trend by using the formula of the MACD indicator.
Therefore, it is necessary to become familiar with the interpretation method using MS-Signal indicators before practicing drawing trend lines.
The MS-Signal indicator utilizes the formula of the MACD indicator. If you look at the formula of the MACD indicator, you can see that it was created using a moving average.
Therefore, if you understand the concept of moving averages, I think you will have no difficulty in using the MACD indicator.
MS-Signal indicator consists of M-Signal indicator and S-Signal indicator.
Therefore, an arrangement of M-Signal indicator > S-Signal indicator means that it is in an uptrend.
During this uptrend, if the price candle holds the price above the MS-Signal indicator, it means that the uptrend is likely.
We have also explained indicators that use volume to mark support and resistance points.
That index is the OBV index included in the HA-MS index.
The OBV indicator is an indicator that shows the change in trading volume due to price fluctuations, and the key point of the OBV indicator is 0.
Interpretation of trading volume can be difficult to understand, so we will take time to explain in detail when the explanation of the price chart part is being finalized.
In this chart, the 'Vol & Trend' sub-indicator includes indicators that utilize trading volume.
What I want to explain this time is about the MS-Signal indicator explained above.
Since the MS-Signal indicator is published in the trading view formula, you can look it up if you want to know the formula. (HA-MS indicator)
MS-Signal indicators are composed of M-Signal indicators and S-Signal indicators.
Among these two indicators, the key indicator is the M-Signal indicator.
Therefore, it is designed to display M-Signal indicators of 1M, 1W, and 1D charts separately.
Utilizing these indicators, it plays a role in showing the overall trend of the price chart immediately even if it is below the 1D chart.
(4h chart)
The 4h chart above is a chart set to display only the M-Signal indicators of the 1D, 1W, and 1M charts.
If the M-Signal indicators form a regular arrangement (1D > 1W > 1M), you can see that there is an upward trend from a long-term perspective, just by looking at the 4h chart.
These marks can reduce the time it takes to analyze a chart because it can shorten the viewing time when viewing multiple charts.
It also reduces the chance of getting caught in a whipsaw by price fluctuations.
Chart analysis is just analysis, you need a trading strategy to trade.
Chart analysis should focus on finding support and resistance, as it is possible to find support and resistance points by analyzing the shape of the chart in order to create a trading strategy.
As mentioned above, all you need for chart analysis is the shape of the candlestick and the concept of the moving average line.
Therefore, if this concept is in place, all the indicators shown in this chart are unnecessary.
However, chart analysis can take a long time, and it is recommended to use indicators that are basically reliable even in order to reduce psychological agitation caused by whipsaw-like volatility.
Descriptions of the MS-Signal indicator have been published several times.
Therefore, after candlesticks and moving averages, the indicator that must be familiar to the eye is the MS-Signal indicator.
This is because I think there is no better indicator than the MS-Signal indicator to find out the trend of the chart.
-------------------------------------------------- -------------------------------------------
** All descriptions are for reference only and do not guarantee profit or loss in investment.
** Even if you know other people's know-how, it takes a considerable period of time to make it your own.
** This is a chart created with my know-how.
---------------------------------

How to use HA-Low and HA-High indicatorsHello?
Traders, welcome.
If you "Follow", you can always get new information quickly.
Please also click "Boost".
Have a good day.
-------------------------------------
(BTCUSD chart)
The HA-Low and HA-High indicators are paired indicators.
When supported by the HA-Low indicator, it corresponds to the time to buy, and when it rises to the vicinity of the HA-High indicator, it corresponds to the time to sell.
This is a basic principle of indicator design.
The HA-Low and HA-High indicators are indicators created for trading, so you can trade based on whether you are supported or resisted by these indicators.
In addition to the basic design mentioned above, support in each indicator, HA-Low and HA-High, corresponds to the time to buy, and resistance corresponds to the time to sell.
The basic design method is less psychologically burdensome, so it is easier than conducting transactions.
When you try to buy because it shows support in the HA-High indicator, it is likely to be a point near the recent high, so you actually have a psychological burden.
Therefore, for mechanical trading, it is best to choose a method of buying when supported near the HA-Low indicator and selling when it rises near the HA-High indicator as the basic design method.
Both HA-Low and HA-High indicators exist on each time frame chart.
Therefore, you can proceed with trading by looking at the time frame chart corresponding to the investment period according to your investment style.
The length of the horizontal line on the HA-Low and HA-High indicators will tell you if the current trend is up or down.
If the horizontal line of the HA-Low indicator is longer than the horizontal line of the HA-High indicator (HA-Low > HA-High), then the trend is likely to be up.
In the opposite case (HA-Low < HA-High ), it is likely to be in a downtrend.
Therefore, if you look at the 1M chart, you can interpret it as an overall downtrend.
On the other hand, if you look at the 1W chart, you can interpret it as an all-out upward trend.
Since it is judged to be in an upward trend on the 1W chart, what matters now is whether the HA-High indicator on the 1M chart falls and the length of the horizontal line becomes shorter than the HA-Low indicator.
Therefore, from a long-term perspective, the time to buy in earnest is when the HA-High indicator on the 1M chart declines and shows support at the point where it was created.
Looking at the relationship between the HA-Low and HA-High indicators on the 1D chart, it can be interpreted that there is a downward trend because the horizontal line of the falling HA-High indicator is longer than the horizontal line of the HA-Low indicator (HA-Low < HA-High). there is.
Therefore, in order to turn into an uptrend, the HA-High indicator on the 1D chart must be moved and created.
If not, even if it rises above 30215.26, the current HA-High indicator point on the 1D chart, the phenomenon of moving the HA-High indicator by shaking it up and down will eventually appear.
This is a necessary move to sustain the uptrend, as it is inevitable.
This concludes the method of trading using the HA-Low and HA-High indicators that I have been talking about for several months.
Regardless of which indicator is used, the most important thing is how long the movement has been confirmed, so the reliability of the indicator can be obtained.
Therefore, no matter which indicator is used to create a trading strategy, a long period of confirmation work must be done to suit the key interpretation method of that indicator.
-------------------------------------------------- -------------------------------------------
** All descriptions are for reference only and do not guarantee profit or loss in investment.
** Even if you know other people's know-how, it takes a considerable period of time to make it your own.
** This is a chart created with my know-how.
---------------------------------

How to interpret charts from indicators (trading strategy)Hello?
Traders, welcome.
If you "Follow", you can always get new information quickly.
Please also click "Boost".
Have a good day.
-------------------------------------
Please understand that the 'Vol & Trend' and 'Strength' sub-indicators are a synthesis of existing indicators, and cannot be disclosed because they have been judged to be unsuitable for publishing as public scripts.
----------------------------------------
It is not easy to see and interpret all the indicators displayed on the chart.
Therefore, it should be viewed and interpreted as the most critical interpretation method.
The first thing to look at is the position of the MS-Signal (M-Signal on the 1D chart), HA-Low, HA-High, M-Signal indicators on the 1W and 1M charts.
The most important of these is the location of the MS-Signal (M-Signal on the 1D chart) indicator and price.
The price is currently located below the MS-Signal indicator, indicating a downtrend.
To add one more thing to this, you can also check the relationship with the M-Signal indicator on the 1W and 1M charts.
Since the price is located below the M-Signal indicator on the 1W chart and 1M chart, it can be interpreted as a downtrend from a mid- to long-term perspective.
Therefore, you can see that the chart as a whole is starting to enter a downtrend.
In order to trade in this situation, you need to check the location of the HA-Low and HA-High indicators.
Currently, the HA-Low indicator is rising and is about to be created.
Therefore, if today's candlestick closes around now, we would expect the HA-Low indicator to form at 21552.44.
Therefore, it becomes important whether it can rise above 21552.44.
Since the M-Signal indicator on the 1W chart is passing around 21552.44, whether it can rise above 21552.44 has become an important question.
If the HA-Low indicator is created at 21552.44 and fails to rise above 21552.44, there is a possibility of renewing the previous low, so you need to think about countermeasures.
If support is received at the 21552.44 point, it is likely to touch the vicinity of the MS-signal (M-Signal on the 1D chart) indicator.
At this time, if you succeed in breaking through the MS-signal (M-Signal on the 1D chart) indicator, the possibility of rising to the vicinity of the HA-High indicator increases.
When the candle is formed today, the body of Heikin Ashi is showing a bullish sign.
Therefore, even if the price fails to rise, if the price remains above the Heikin Ashi body, it can be interpreted that there is a high probability of a rise around 21552.44.
At this time, you need to check whether it is supported or resisted at the point 21552.44.
As such, indicators on price charts represent trends and support and resistance roles, making it the most intuitive way to anticipate future movements.
To support this, 'Vol & Trend' and 'Strength' auxiliary indicators are utilized.
This auxiliary indicator strengthens the interpretation of the price chart indicators by providing additional evidence when the movements of the price chart indicators are judged ambiguous.
The 'Vol & Trend' sub-indicator is an indicator related to trading volume.
Therefore, you can check the buy strength and sell strength according to the movement of trading volume.
You can also check whether the volume is trending up or down.
The 'Strength' sub-indicator consists of the Stoch, StochRSI, RSI and CCI indicators.
The most important of these are the StochRSI indicator and the RSI indicator.
The RSI indicator is an indicator that is related to the HA-Low and HA-High indicators.
Therefore, it is not directly interpretable.
However, it is paired with the Stoch indicator and used as a basis for determining an upward trend or a downward trend.
It is currently looking to switch from a downtrend to an uptrend.
The StochRSI indicator is used to predict periods of volatility.
In addition, it is used as a basis for determining whether the trend will change to an uptrend or a downtrend in the future due to the change in the wave.
The current downtrend has turned to an uptrend, and it appears to be coming out of the oversold zone.
The CCI indicator is used as a basis for judging whether there is an upward trend or a downward trend.
However, it shows a trend that is more than short-term.
All of these indicators are scored as uptrend, stationary, and downtrend to make an overall judgment.
'Vol & Trend' indicator
Stationary : 1
Downtrend: 1
'Strength' indicator
Uptrend: 1
Matching: 2
Downtrend: 1
It is a situation where the basis for judgment of the sub-indicators is not needed, as all indicators that are near the current price chart are located below the price.
If it starts to show stationary or sideways movements near the price chart, then with the help of the indicators, you will be able to use it as a basis for judgment.
Someone said it's a chart with all the indicators, yes, that's right.
However, it is not always possible to see all indicators.
You only need to report it when necessary and use it as a basis for judgment.
We do not think of additional interpretation methods for each indicator other than the interpretation methods described above.
You should pay attention to this.
By combining support and resistance points here, you can create a trading strategy.
No matter how you analyze the chart, analysis ends its role with analysis.
To trade, you need to create a trading strategy based on chart analysis and correlation with support and resistance points so you can start trading.
However, when it comes to most chart analysis, there is a tendency to ignore trading strategies.
If you ignore your trading strategy, you will most likely not be able to find the right way to respond if the movement comes out in the opposite direction you thought.
Therefore, both chart analysis and trading strategy are important, but you need to do chart analysis to create a trading strategy.
If you forget about this and invest all your time and effort into chart analysis, you will end up with a higher chance of failing trades when you run out of time to craft your trading strategy right.
Therefore, chart analysis should be completed in the quickest way to give you plenty of time to create your trading strategy.
To do so, it is urgently necessary to make efforts to predict movements beyond the current one, rather than looking at the charts based on past movements and past patterns.
-----------------------------------------------------------------
** All descriptions are for reference only and do not guarantee profit or loss in investment.
** Even if you know other people's know-how, it takes a considerable period of time to make it your own.
** This is a chart created with my know-how.
---------------------------------

Why you should only think about charts when looking at chartsHello?
Traders, welcome.
If you "Follow", you can always get new information quickly.
Please also click "Boost".
Have a nice day.
-------------------------------------
When looking at the investment market, the first thing to do is to analyze the chart, and I wanted to say that the most important thing is how to create a trading strategy that suits your investment style with that chart.
-------------------------------------------------
Most people try to predict the movement of the investment market by looking at the announcement of various economic indicators and the contents of global issues (war, corona, etc.).
A big issue must be something that can cause great volatility in the investment market, but it is also clear that when such an issue accumulates, it can no longer create volatility.
So, you should be careful that trying to predict the movement of the investment market with such issues can make a wrong prediction.
Sudden big issues For example, in the case of a global shock due to an issue such as the 9/11 terrorist attack, it may cause great volatility without time to respond.
Other than these issues, most of the chart's price movement will react first.
In order to see this pre-reflection in advance, you need to look at the chart without reflecting factors that can change your psychological state, such as the announcement of various economic indicators or global issues.
I don't think this kind of work is a big deal, but it is a very important factor that occupies a fairly important part of investing.
We need to think a lot about how to figure out the trend only with the movement of the chart, away from the announcement of various economic indicators and thoughts about global issues.
As it rises above the indicator called Low, which was created on June 19, 2022, we can see that it is splitting the flow of the chart in half.
A change in the -100 indicator has always completed a low.
Although it is currently showing a different look than before, it will form a low as long as the -100 indicator is created.
The +100 indicator is an indicator that starts generating when a high is formed.
Therefore, a rise above the +100 indicator means that the uptrend to break the high is likely.
Therefore, in order to show a full-fledged uptrend from the current price position, it must rise above 38K.
The high point has been holding for a long time now.
However, the low point has not yet formed a clear point due to the change of the -100 indicator.
However, as the -100 point is moved near the current price range, the possibility of forming a low is very high.
This shows that we are facing a new trend.
Keeping the price above 17941.69 is most important from a short-term perspective to create this new trend.
The next most important thing is to keep the price above 20552.75.
Then, it completes the appearance of a trough (a phenomenon in which the price drops more before making a bigger rise) before showing an uptrend.
The StochRSI indicator is showing a fairly rapid decline.
We will verify what we said above by looking at where the Stoch RSI indicator finds support and resistance when it turns upside down.
This change in support and resistance points can tell you which direction the movement of the current chart is about to head.
You may think my explanation is inconclusive, but the conclusion has already been drawn.
We live in a flood of information.
It is quite difficult to infer an objective conclusion by synthesizing such a large amount of information.
Therefore, it is necessary to objectify all information using objectified tools and indicators.
Many celebrities' chart analysis methods and trading methods are introduced on the Internet or in books.
In order to make the contents of these people my own, it can only be acquired through numerous transactions and numerous experiences.
Over time, trends change and all patterns change and evolve.
In order to read the chart in line with these changes, I think it is better to use a simpler and faster way to analyze.
This is because you can keep up with the ever-changing trends.
It is more important to make your own mental state stable due to volatility by investing more time in the trading strategy than the time used for analysis.
What do you guys think?
-------------------------------------------------- -------------------------------------------
** All descriptions are for reference only and do not guarantee profit or loss in investment.
** If you share this chart, you can use the indicators normally.
** The MRHAB-T indicator includes indicators that indicate points of support and resistance.
** Check the formulas for the MS-Signal, HA-Low, and HA-High indicators at ().
** SR_R_C indicators are displayed as StochRSI (line), RSI (columns), and CCI (bgcolor).
** The CCI indicator is displayed in the overbought section (CCI > +100) and oversold section (CCI < -100).
(Short-term Stop Loss can be said to be a point where profit or loss can be preserved or additional entry can be made by split trading. This is a short-term investment perspective.)
---------------------------------
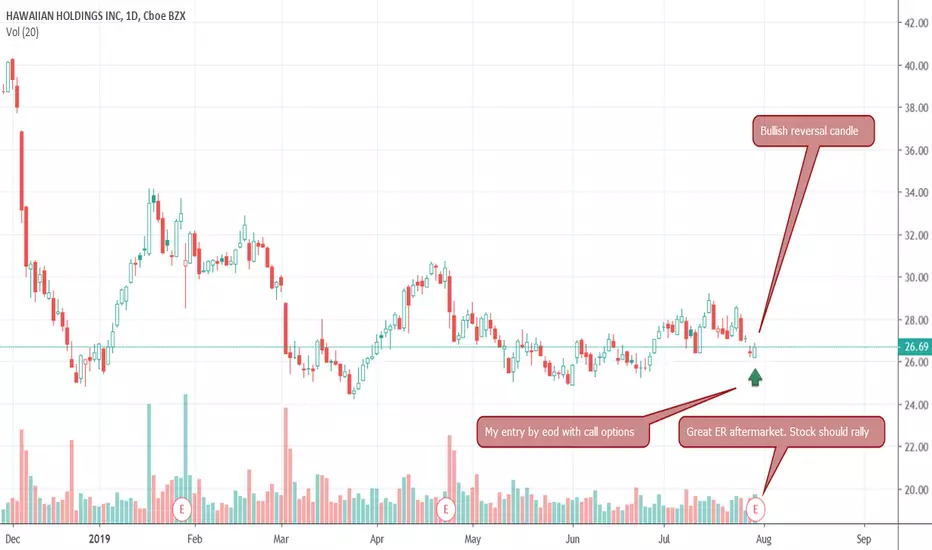
$ha $ha $haRunning earnings play after-hours 10/22, playing gap fill.
Picked spot 29.99, stop 29.31.
Also copped some 12/20 36$ calls for .25 each.

Keep the read simpleKeeping it simple with less noise will help you determine a general trend of pricetime and where it's headed. By using different candles, indicators and Gann angle relationships, you might be able to see a clearer picture outside your bias and belief of what a stock is going to do.
Did this help. Let me know. I love feedback...
M~

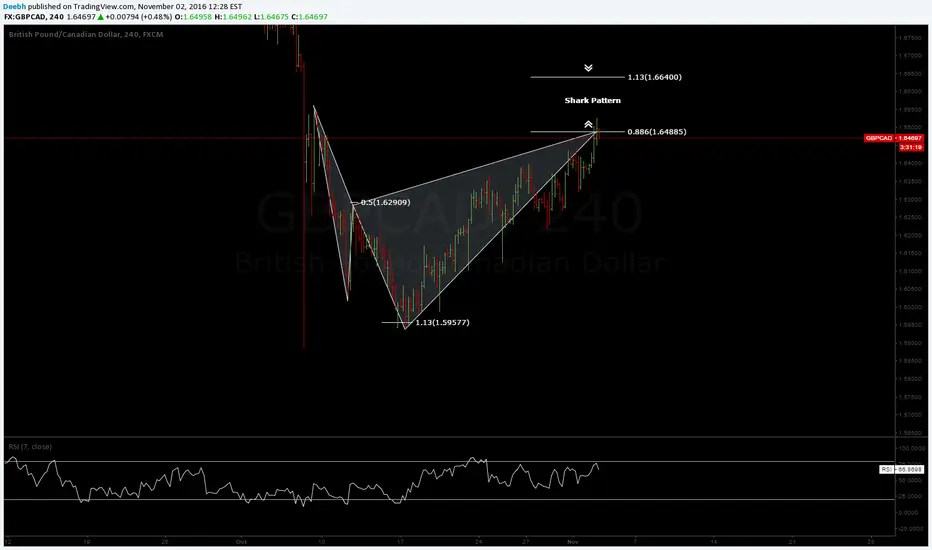
HA -Big upward channel formation breakdown from $45.43 to $31.13HA seems broken down long term upward channel. Moneyflow also really pulled down. We think if it breaks $45.53 it can decline as low as $31.13
HA
Date First Found- June 20, 2017
Pattern/Why- Big upward channel formation
Entry Target Criteria- Break of $45.43
Exit Target Criteria- $31.13
Stop Loss Criteria- $52.13

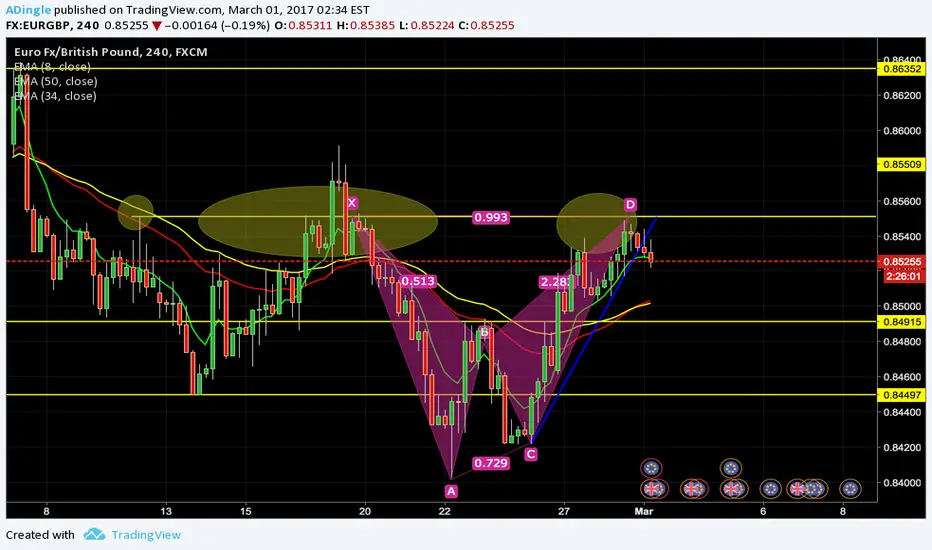
EG round 2!After a retrace back to resistance, we are left with a bearish bat and a very similar setup to my idea last week. Yellow lines are TP points. Good luck!
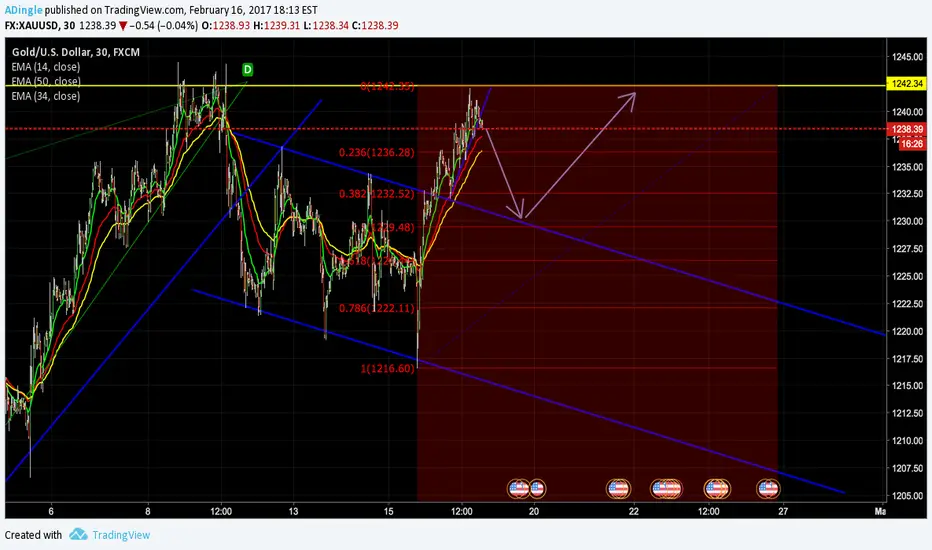
XAUUSD SHORT!!Broke out of the triangle to the downside, looking for a re test of the previous channel, TP for me personally is 1230-1230.50. Stop loss is a break and confirmation above resistance. I have a few positions from 1238-1240
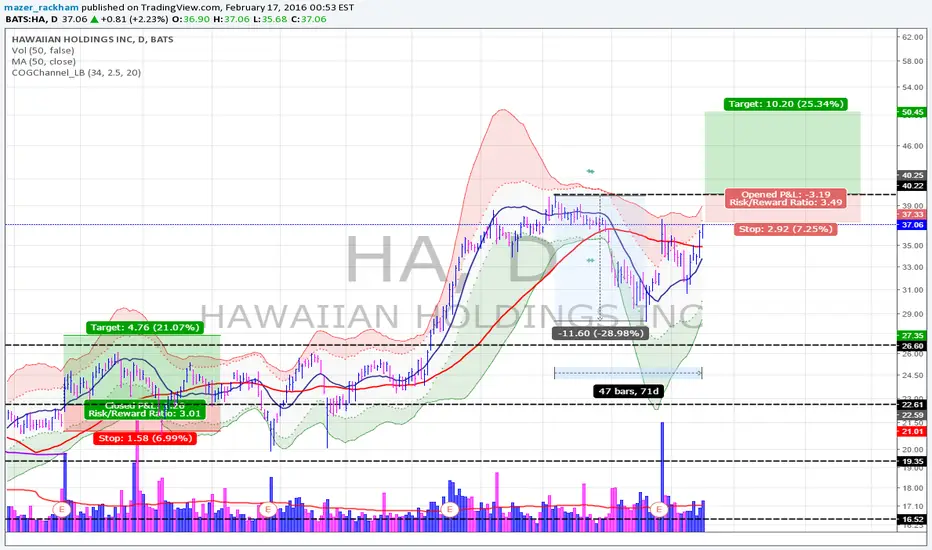
HA still have wings or will oil ground it? - buy point 40.23cup w/ handle base
Buy point 40.23
Composite Rating 95
MARKET DIRECTION AND INDUSTRY GROUP FOR HA
General Market
Market in correction
Industry Group
Industry Group Rank (1 to 197) 78
FUNDAMENTAL PERFORMANCE FOR HA
Current Earnings
EPS Due Date 04/21/2016
EPS Rating 97
EPS % Chg (Last Qtr) 113%
Last 3 Qtrs Avg EPS Growth 83%
# Qtrs of EPS Acceleration 1
EPS Est % Chg (Current Qtr) 97%
Estimate Revisions
Last Quarter % Earnings Surprise 1.2%
Annual Earnings
3 Yr EPS Growth Rate 71%
Consecutive Yrs of Annual EPS Growth 2
EPS Est % Chg for Current Year 51%
Sales, Margin, ROE
SMR Rating B
Sales % Chg (Last Qtr) 0%
3 Yr Sales Growth Rate 6%
Annual Pre-Tax Margin 13.2%
Annual ROE 46.5%
Debt/Equity Ratio 156%
TECHNICAL PERFORMANCE FOR HA
Price And Volume
Price $37.06
RS Rating 98
% Off 52 Week High -8%
Price vs. 50-Day Moving Average 6%
50-Day Average Volume 1.3 Mil
Supply And Demand
Market Capitalization $2 B
Accumulation/Distribution Rating B+
Up/Down Volume 1
% Change In Funds Owning Stock 10%
Qtrs Of Increasing Fund Ownership 5