Haedal Protocol: Trading Young Charts Short-Term (~125% Profits)Remember the "young charts"?
"Not enough data."
We now trade the young charts as well but always keep it short-term. Our aim is a maximum of 130-120%.
Here I show higher targets but normally that's the range. We go for 10% the first target, more or less, to 120-150% the last target.
And of course, short-term for us means one month (30 days). For some people and trading styles this is a very long time and I understand.
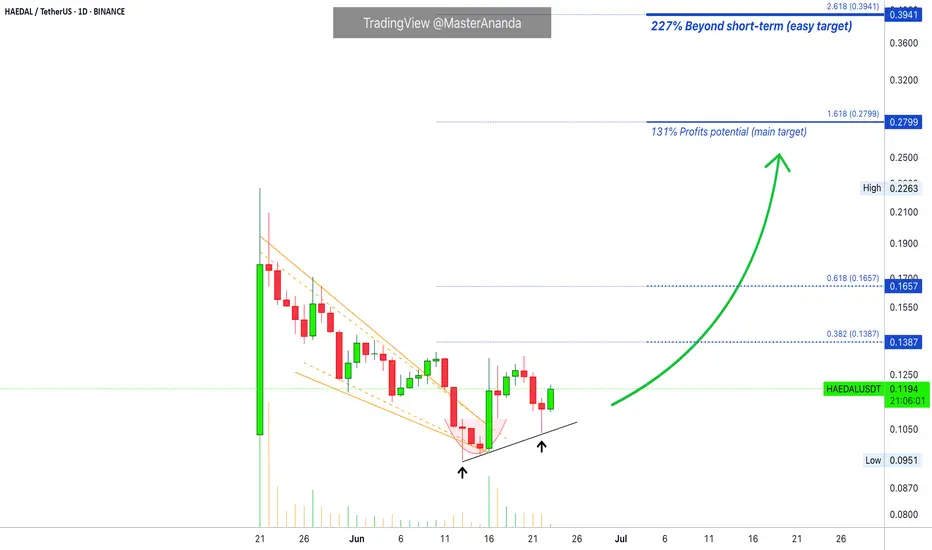
Technical analysis HAEDALUSDT
» We have the falling wedge pattern. Automatically when the action breaks out of this pattern we have also a broken downtrend and downtrend line.
» Here we have a rounded bottom, a higher low and a bullish hammer candlestick.
» 16-June produced the highest volume and this day marks the end of the downtrend and bullish breakout from the falling wedge.
All these are bullish signal. We are aiming up while aiming higher. Higher high, higher heights, new all-time high and beyond in the coming weeks and months.
Namaste.
Haedalprotocol
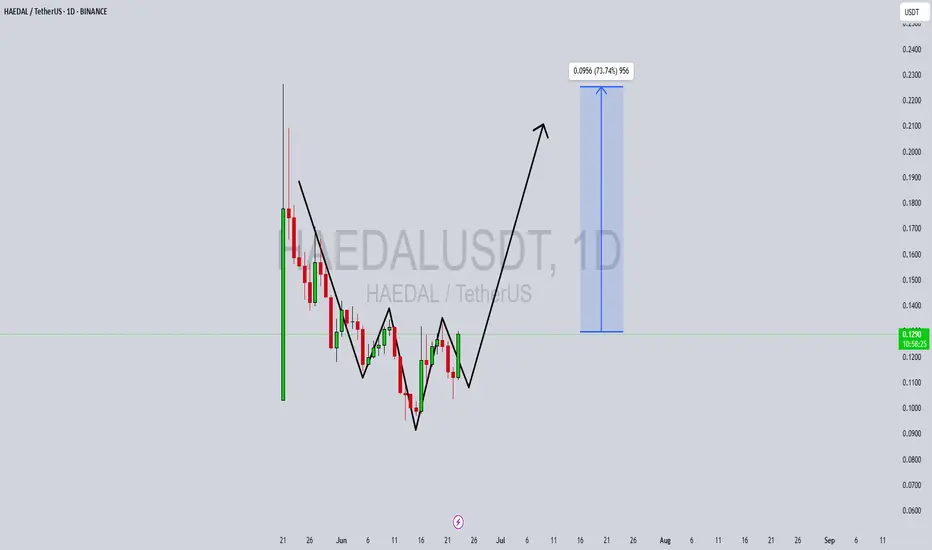
HAEDALUSDT Forming Inverse Head And ShoulderHAEDALUSDT is currently forming an inverse head and shoulders pattern on the chart, a classic bullish reversal structure that signals the potential end of a downtrend. This pattern is often considered highly reliable when confirmed by a breakout above the neckline, especially when accompanied by strong trading volume. In the case of HAEDALUSDT, volume has been steadily increasing, suggesting accumulating interest from investors and a possible breakout on the horizon.
Technical analysis indicates that if HAEDALUSDT successfully breaks above the neckline, it could initiate a strong upward move, potentially yielding gains in the range of 60% to 70%+. The symmetry of the pattern, with well-formed shoulders and a clear head, further enhances the reliability of the bullish setup. Such technical formations tend to attract both swing traders and breakout traders who anticipate momentum-driven moves.
Adding to its appeal, the project behind HAEDALUSDT has started gaining traction among investors, which is reflected in recent price stability and a surge in buying pressure. This could mark the beginning of a broader trend reversal, especially if market sentiment across the crypto space continues to recover. Coins forming strong bottoming patterns like this often outperform in bullish cycles.
If you're looking for an early entry into a potential breakout with high reward-to-risk potential, HAEDALUSDT is certainly a chart to keep on your radar. Continued volume support and a confirmed breakout could quickly propel it toward upper resistance zones, making it a favorable candidate for short- to mid-term gains.
✅ Show your support by hitting the like button and
✅ Leaving a comment below! (What is You opinion about this Coin)
Your feedback and engagement keep me inspired to share more insightful market analysis with you!