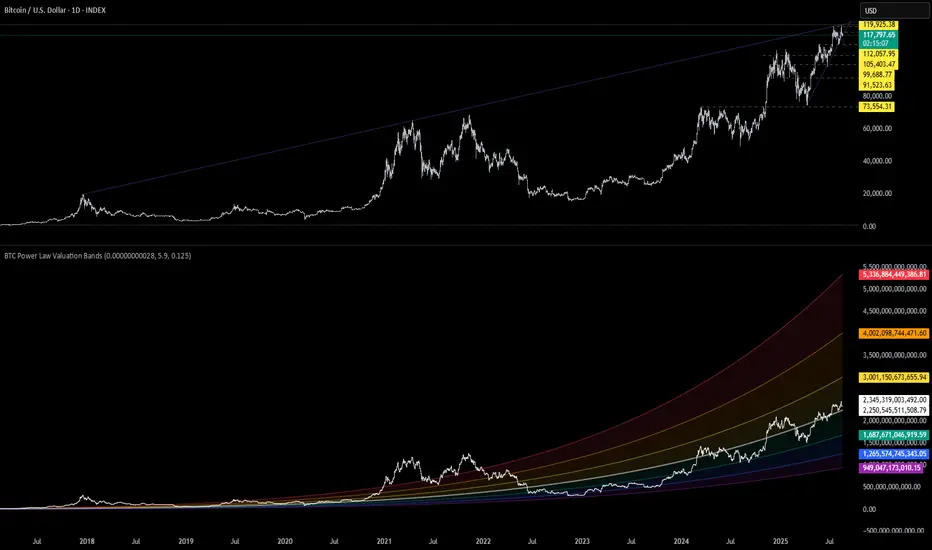
Bitcoin’s Power Law Curve — Fairly Valued With Room to RunThis chart applies a Power Law Rainbow Model to Bitcoin using a long-term logarithmic regression fitted to BTC's historical price action. Power laws are mathematical relationships often found in nature, science, and network systems — and Bitcoin is no exception.
Rather than relying on arbitrary trendlines, this model fits a curve based on the equation:
Price = a × t^b
Where:
t is the number of days since inception
a and b are constants optimized to Bitcoin's growth
Bands represent log-scaled standard deviation zones from the curve
🌈 Interpreting the Chart
The center white curve reflects Bitcoin's "fair value" according to its adoption-based trajectory.
Colored bands represent ±1σ, ±2σ, ±3σ from the model, creating a "valuation rainbow."
Historically, Bitcoin's cycle bottoms have touched the lower bands (blue/purple), while euphoria tops align with the upper bands (orange/red).
✅ Current Outlook
BTC is trading just under the fair value curve , suggesting it's fairly valued or slightly undervalued from a long-term perspective.
This position has historically preceded major upside moves, especially in post-halving environments.
From a Smart Money Concepts angle, we're in a potential accumulation or markup phase , with institutional and informed capital likely already positioning.
🧠 Why Power Laws Work for BTC
Bitcoin adoption follows network effects — more users = more value — which naturally follows a power law.
Unlike linear trends, power law curves scale with time , making them ideal for modeling exponential assets.
They offer a more objective long-term valuation framework , avoiding emotional cycle chasing.
⚠️ Disclaimer
This is not financial advice . The model reflects historical behavior and is a tool to support long-term perspective — not short-term prediction. Always do your own research and risk management.
Halvingcycle
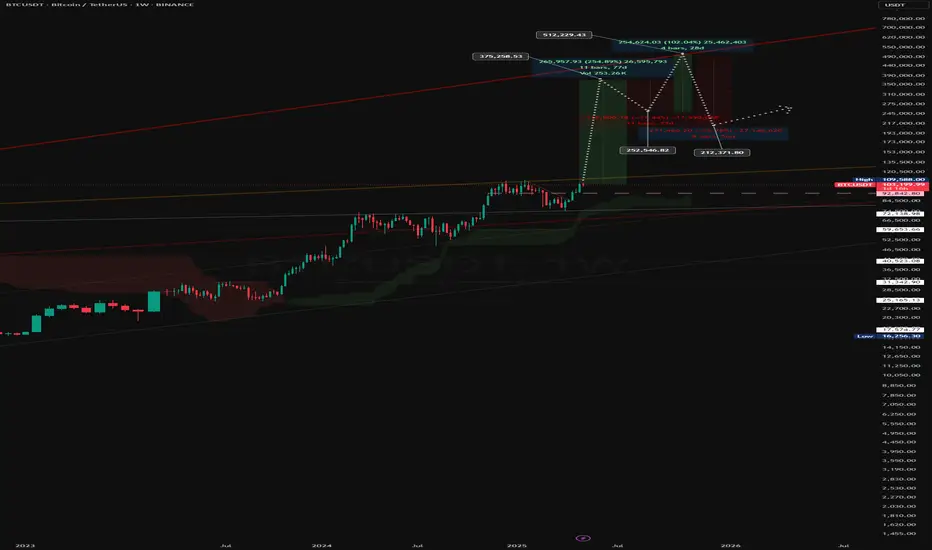
BTCUSDT: The ‘Parabolic Channel’ Play – $250 K to $500 K … then?⚙️ Chart Specs
Ticker / Pair: BTCUSDT
Time-Frame: 1W (log scale)
Indicators: Ichimoku Cloud (default), 7-year logarithmic channel, long-term trend-lines & Fib extensions
Date of publish: 17 May 2025
1️⃣ Macro Context
Bitcoin just printed a decisive weekly close above the mid-line of its 2017-2025 log channel while the Ichimoku Cloud has flipped full-bull (span A > span B). Post-2024 halving supply shock + macro liquidity rotation = strong tail-wind.
2️⃣ Projected Path
Phase Target zone % from breakout Key confluence
Break & sprint $255-270 K ~+140 % Vacuum above former ATH; minimal supply
Euphoria stretch $375 K ~+250 % Channel ceiling + 2.0 Fib
Blow-off wick $500-520 K ~+380 % 2.618 Fib extension + typical overshoot
Dashed white arrows on the chart sketch the base-case impulse and an optional “melt-up” extension.
3️⃣ Post-parabola Retrace
Historical cycles point to a -50 ~ -60 % draw-down once the upper red rail is tagged. I’m watching:
$255-250 K → first liquidity pocket / mid-channel
$215-210 K → 0.5 Fib retrace of the entire move
Either zone could reset weekly momentum while preserving the uptrend.
4️⃣ Invalidation Levels
Weekly close < $92 K → breakout failure → bias flips neutral, potential slide to red mid-line ~$75 K.
Close below channel base $60 K → macro thesis void, shift to bear bias.
5️⃣ Illustrative Trade Plan (not financial advice)
Leg Entry TP(s) Stop
Impulse swing Weekly close > $120 K $255 K / $375 K Weekly close < $92 K
Blow-off punt Break > $375 K on volume Trail toward $500 K 2-week trailing low
Retrace reload Bullish SFP at $255-210 K Ride next cycle Close < $200 K
📝 Take-aways
Base target sits in the $250 K region; exuberant extension eyes $500 K.
Expect aggressive mean reversion once the upper rail is hit.
Clear invalidations help keep emotions in check amid extreme volatility.
⚠️ This is an educational study,
Ash | 4 reasons why we’re still bullish on BTCHi traders! 👋 This is Ash, let’s dive straight into today’s analysis! 📊🚀
📌 Wave analysis and our near-term view on Bitcoin
We believe we are nearing the end of Wave 1 of Intermediate Wave (3) (in yellow). A dip could be on the horizon in the near future - potentially toward $60k.
~$60k = Strong Buy 🚛🚛🚛
📌 4 reasons why we’re still bullish on BTC (even at $100k)!
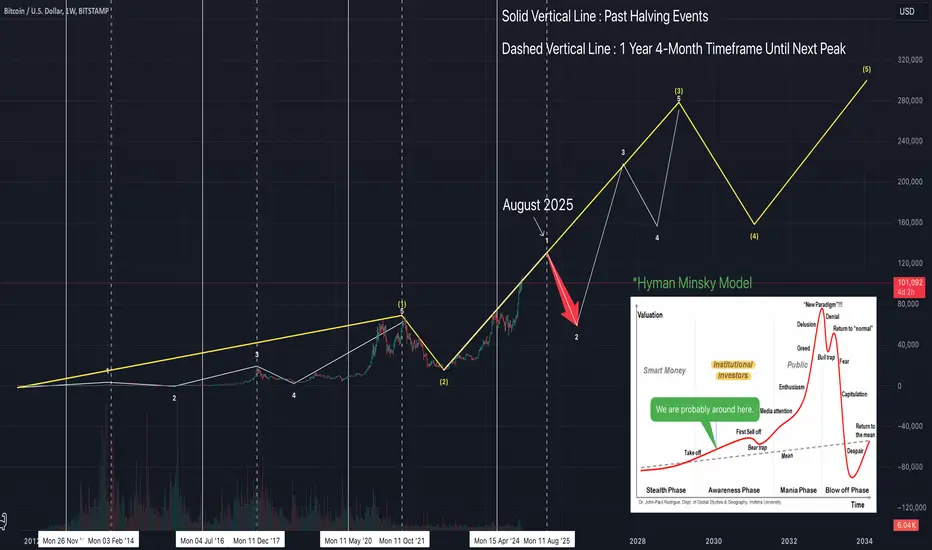
1. Elliott Wave Analysis
We believe we are only on Wave 1 of the 3rd Intermediate Wave. This time could be different~! 😅
2. Halving Cycle Analysis
Historically, the upward trend lasted about 1 year 4 months after each Halving event. Since the last Halving was on April 19, 2024, this timeframe points to ~ August 2025. So, we’re still about 8 months away from a correction! 😌
3. Institutional Buying and Government Recognition
Major institutions are buying, and many governments (including the incoming Trump administration) are beginning to embrace BTC as a form of reserve asset. Bullish! 📈
4. Hyman Minsky Model
All financial systems progress through stages of increasing leverage and speculation (aka, a bubble). But… we don’t think we are there yet. Institutions have only just started buying, with limited participation from retail (i.e., public). BTC has plenty more room to run! 🚀
With this said, always remember to DYOR and protect your capital.
(Note: DYOR = Do Your Own Research)
📌 Alternative “sub” Scenario: Highly Unlikely
The following scenario is highly unlikely, but “if” BCT is nearing the end of Wave (1) (in yellow), the ensuing correction (Wave (2)) could be quite severe - potentially to ~ $40k or even lower..
For those looking to buy at the current level: be aware that, despite a very low probability, a drop to $40k is possible. Please ask yourself whether you can stomach this fall before going long.
If you found this analysis helpful, don’t forget to hit that boost button and follow me! 🚀🙌
See you soon with more updates! 🔥
Bitcoin Dominance Halving Cycles and Alt SeasonsThis chart shows that in the 2 recent halving cycles Bitcoin Dominance had a massive pullback 240 days after the halving. We are now approaching the next 240 day cycle after the most recent halving earlier this year.
240 Days after Halving = December 17 2024.

The Bitcoin comfort zone - 90K within range? @tradingparrot Based on logarithmic model and 4-year halving cycle model we don't need a blow off top in the current cycle to get to 90K.
We can just literally stay in the bitcoin comfort zone logarithmic channel and chill until we get there.
Not financial advice but I kind of resonate with this idea.
I'll be publish a video on youtube tonight with all the detail of this analysis.
I'm tagging this as bullish in the context of the daily chart and with a time frame of months to a full year to allow the model to play out.
