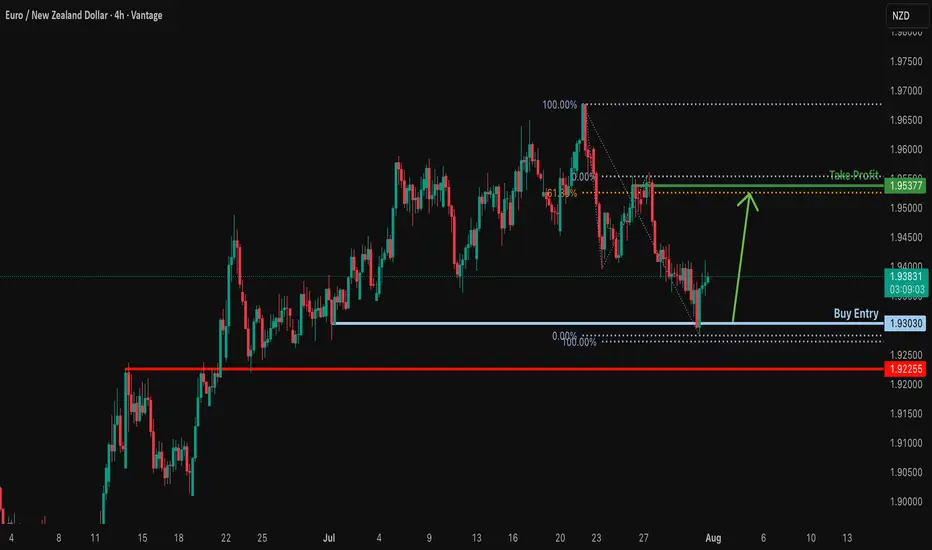
Bullish bounce off pullback support?EUR/NZD has bounced off the support level, which is a pullback support and could rise from this level to our take profit.
Entry: 1.93030
Why we like it:
There is a pullback support.
Stop loss: 1.92255
Why we like it:
There is an overlap support
Take profit: 1.95377
Why we like it:
There is a swing high resistance that lines up with the 61.8% Fibonacci retracement.
Enjoying your TradingView experience? Review us!
Please be advised that the information presented on TradingView is provided to Vantage (‘Vantage Global Limited’, ‘we’) by a third-party provider (‘Everest Fortune Group’). Please be reminded that you are solely responsible for the trading decisions on your account. There is a very high degree of risk involved in trading. Any information and/or content is intended entirely for research, educational and informational purposes only and does not constitute investment or consultation advice or investment strategy. The information is not tailored to the investment needs of any specific person and therefore does not involve a consideration of any of the investment objectives, financial situation or needs of any viewer that may receive it. Kindly also note that past performance is not a reliable indicator of future results. Actual results may differ materially from those anticipated in forward-looking or past performance statements. We assume no liability as to the accuracy or completeness of any of the information and/or content provided herein and the Company cannot be held responsible for any omission, mistake nor for any loss or damage including without limitation to any loss of profit which may arise from reliance on any information supplied by Everest Fortune Group.
Harmonic Patterns
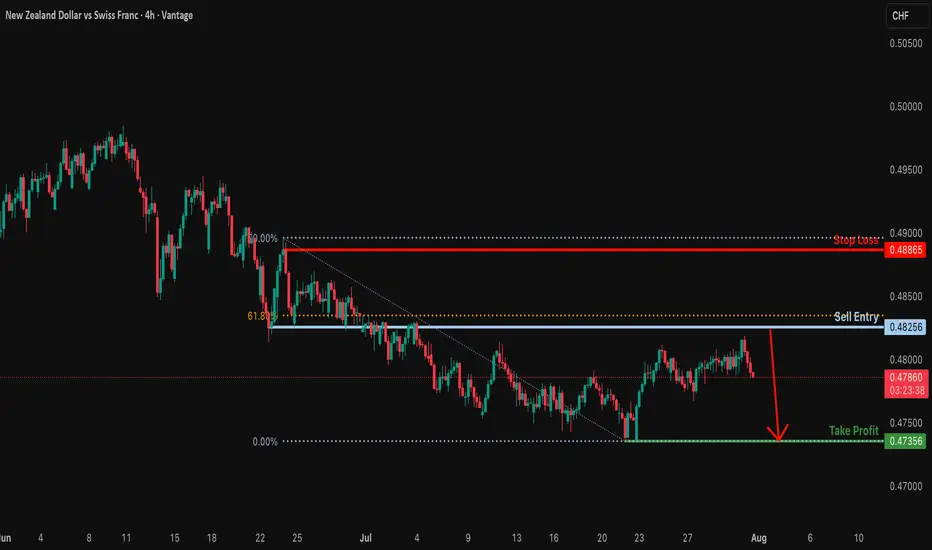
Bearish drop?The NZD/CHF is rising towards the resistance level, which is a pullback resistance that is slightly below the 61.8% Fibonacci retracement. It could drop from this level to our take-profit.
Entry: 0.48256
Why we like it:
There is a pullback resistance that is slightly below the 61.8% Fibonacci retracement.
Stop loss: 0.48865
Why we like it:
There is a pullback resistance.
Take profit: 0.47356
Why we like it:
There is a swing low support.
Enjoying your TradingView experience? Review us!
Please be advised that the information presented on TradingView is provided to Vantage (‘Vantage Global Limited’, ‘we’) by a third-party provider (‘Everest Fortune Group’). Please be reminded that you are solely responsible for the trading decisions on your account. There is a very high degree of risk involved in trading. Any information and/or content is intended entirely for research, educational and informational purposes only and does not constitute investment or consultation advice or investment strategy. The information is not tailored to the investment needs of any specific person and therefore does not involve a consideration of any of the investment objectives, financial situation or needs of any viewer that may receive it. Kindly also note that past performance is not a reliable indicator of future results. Actual results may differ materially from those anticipated in forward-looking or past performance statements. We assume no liability as to the accuracy or completeness of any of the information and/or content provided herein and the Company cannot be held responsible for any omission, mistake nor for any loss or damage including without limitation to any loss of profit which may arise from reliance on any information supplied by Everest Fortune Group.
#NIFTY August 1st view#NIFTY August 1 st View : NSE:NIFTY Currently doing wave 3, and around buying zone, lets add up Nifty future and Nse Stocks for fresh high from Aprils low

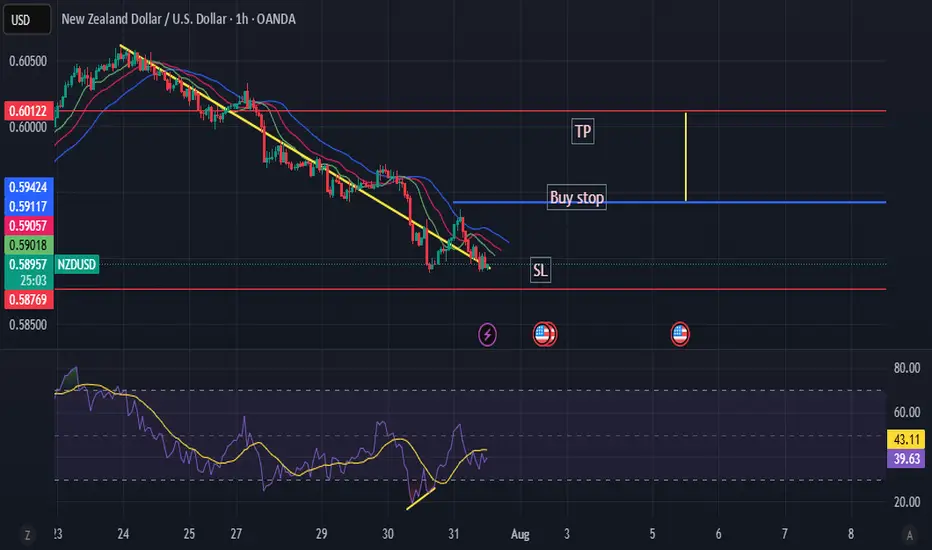
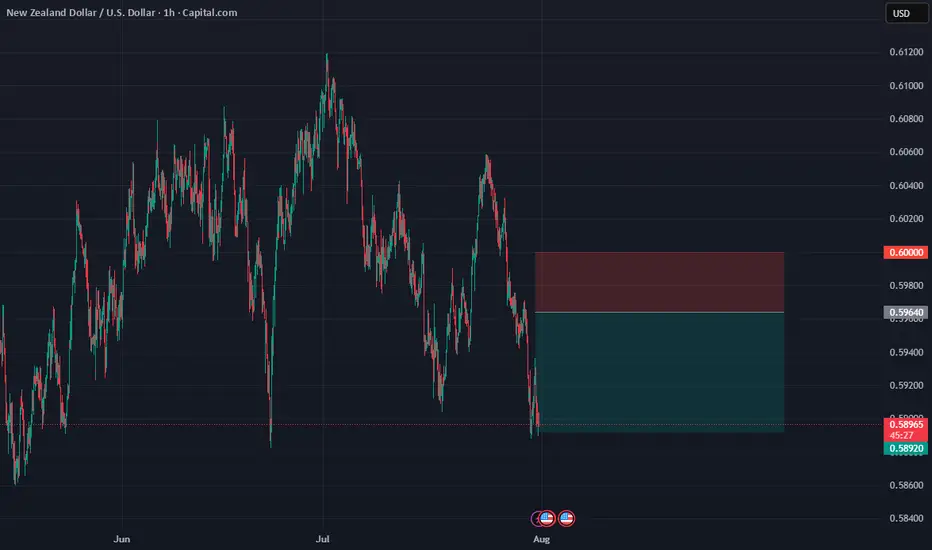
NZDUSD in bearish trend NZDUSD in bearish trend with bullish RSI diversion and 91% long bias, entry with a Buy stop above the last Lower High RR 1:1
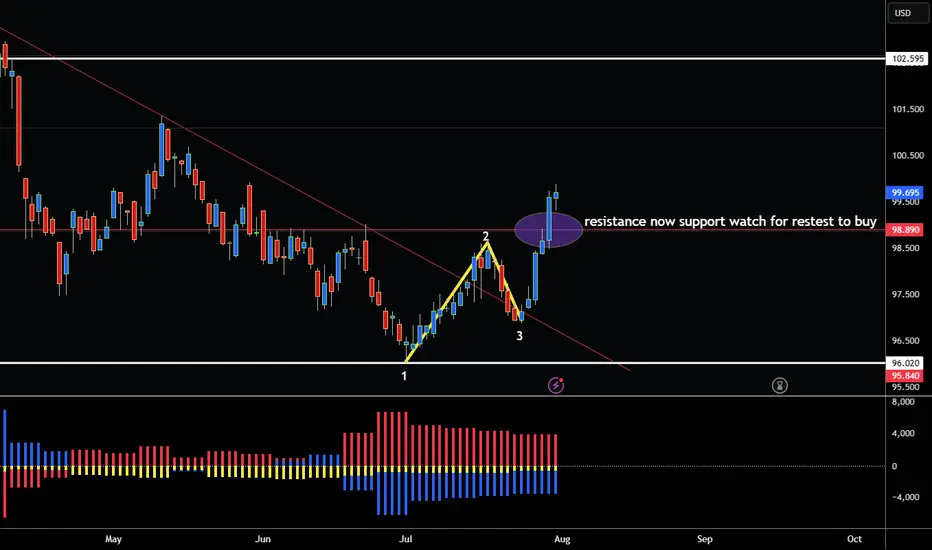
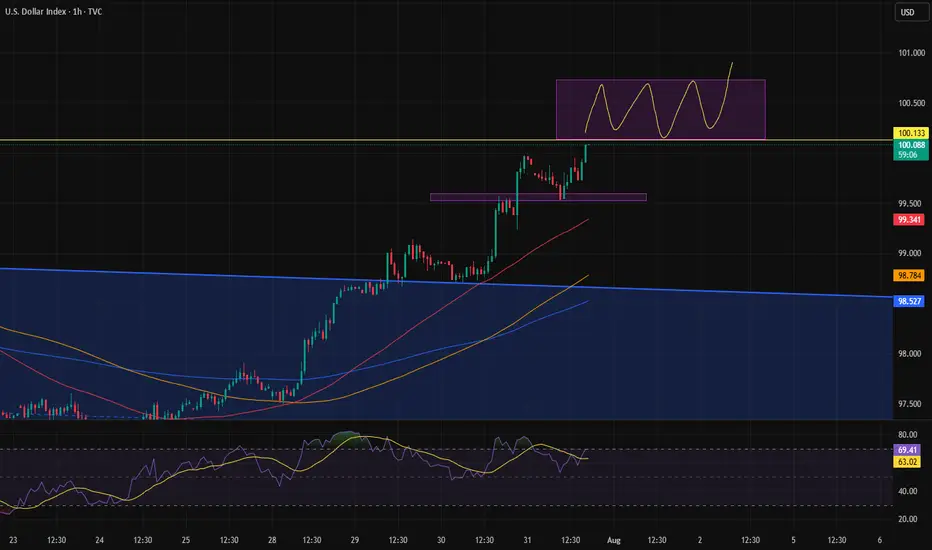
US DOLLAR BREAKS ABOVE RESISTANCE 98.99 BOTTOM CONFIRMED! Hey Traders so today looking at the US Dollar and as of today there is now a 123 bottom on the charts that has been confirmed by breaking above the 2 point.
Sees like fundamentally the US Dollar has now become bullish so with this breakout now confirmed does this mean we are in the beginning of Bull Market for the USD?
Well no one knows for sure but without any interest rate cuts and lots of tarriffs coming through it seems to be that way. Only time will tell of course if this becomes a new uptrend in USD so now we have a breakout whats next?
The way you trade the 123 bottom is wait for the market to break above the 2 point. Then alot of times there will be a retest of that zone at 98.89
Watch for the retest then consider selling Euro, Pound, Cad, Australian, Gold, Commodities etc...
Against the USD.
If you however you are bearish USD I would wait until market has daily close under 3 point that way you know for sure market has turned.
I will now start to include COT Report in my Analysis so we can see institutional positioning.
Currently Large Specs are Short the USD.
Good Luck & Always use Risk Management!
(Just in we are wrong in our analysis most experts recommend never to risk more than 2% of your account equity on any given trade.)
Hope This Helps Your Trading 😃
Clifford
ENTRY NZDUSDDisclaimer:
This is merely a chart-based analytical trading idea and is not considered investment advice. Please manage your risks carefully and conduct your own research before making any trading decisions.
Bitcoin Go 135kBitcoin has not yet reached the channel ceiling and should bounce back after the resistance.
Bitcoin
Tp1:128000
To2:130000
Tp3:133000
Tp4:135000

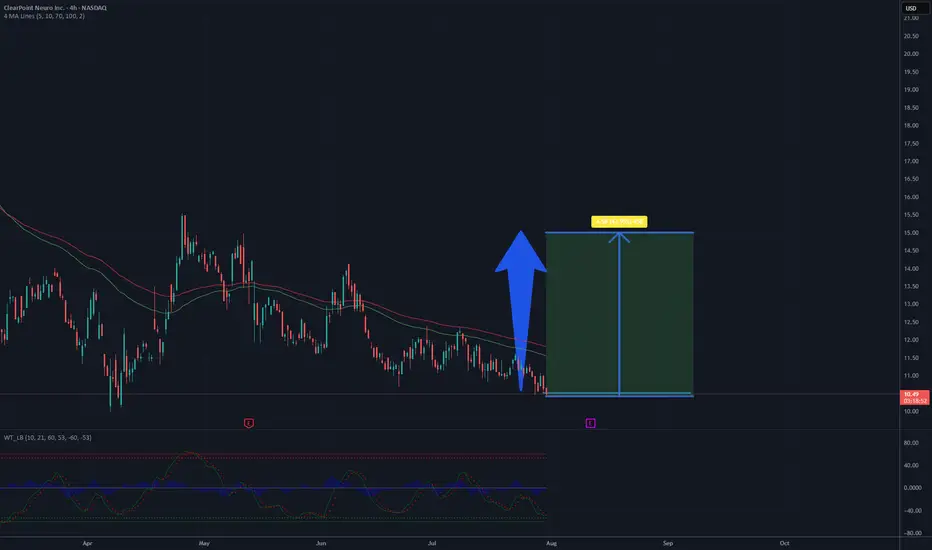
Is a time for CLPT? Around 50% profit - 15 USD targetThe chart depicts a 4-hour candlestick pattern for ClearPoint Neuro Inc. (CLPT) on NASDAQ, covering late 2024 to mid-2025. The stock has recently declined from a peak near 10.7 USD, with the price currently around 10.07 USD as of July 31, 2025. The moving averages (red and green lines) show a bearish crossover, indicating short-term downward momentum, but the price is close to a support level around 10 USD. The oscillator at the bottom suggests oversold conditions with a slight upward bounce, hinting at potential reversal. If buying volume increases and the support holds, a recovery to 15 USD appears feasible in the coming weeks, supported by historical resistance levels near that mark.
The continued expansion of clinical sites globally and the commercialization of the ClearPoint PRISM Neuro Laser Therapy System may broaden the company’s market reach, potentially boosting sales and partnerships in the neurosurgery and gene therapy sectors.
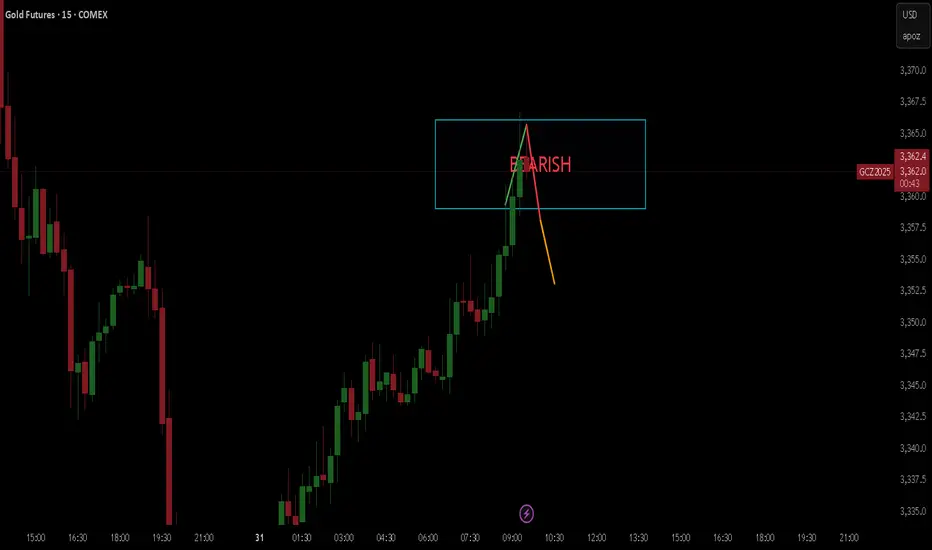
GOLD BEARISHHello,
I hope you are well.
I have an excellent opportunity for you on gold.
I see a 90% chance that gold will start to fall, so get your strategies and money management ready!
Range above 100.It seems like the dollar is trying to push back above the 100 level after a long time, and it's likely forming a range up there to establish stability in that zone.
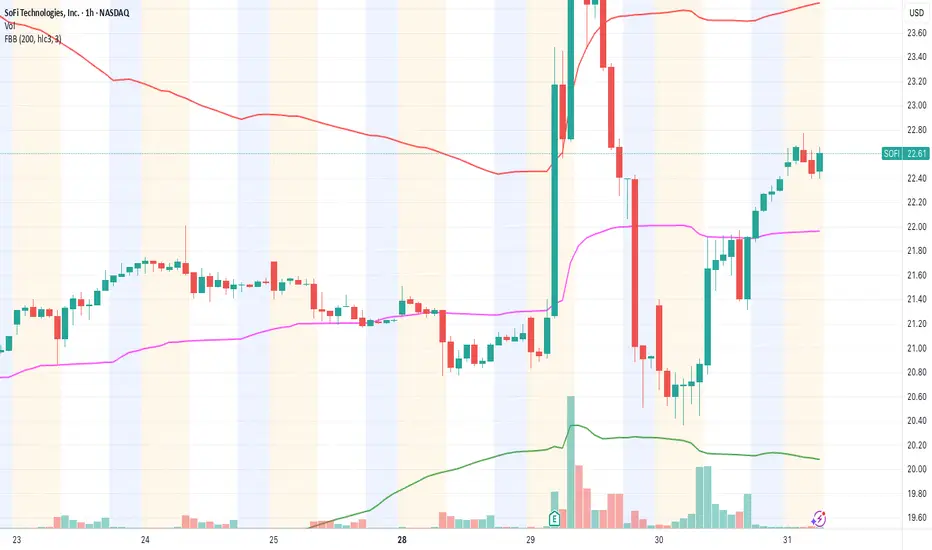
SOFI meets 25 out of 28 technical & fundamental criteria – SwingEntered at $22.55 after full validation through our 28-criteria system.
✅ Strong earnings (positive revenue growth & stable forward guidance)
✅ Dilution concerns cleared (no new share offering)
✅ Breakout confirmed above VWAP with clean pullback
✅ Accelerated momentum and rising premarket volume
✅ Healthy RSI (no overbought in 4h or daily chart)
✅ No major resistance until the $24.90–$25.20 zone
📍Key Levels:
🎯 Entry: $22.55
🛑 Stop Loss: $21.80
🎯 Target: $25.00
⏳ Expected duration: 1–2 days (swing)
🔁 Risk/Reward: 2.5:1
Fibonacci insight:
Price respected the 38.2% level during the pullback. The 161.8% extension points right to the $25 zone.
📊 Context:
Fintech sector is gaining strength, and SOFI is leading with strong fundamentals and bullish momentum.
If we open above $22.50 with strong volume, I expect a bullish continuation.
I'm tracking every trade as part of a new system currently under test.
If you want to follow this signal to the end, feel free to follow along. ✌️
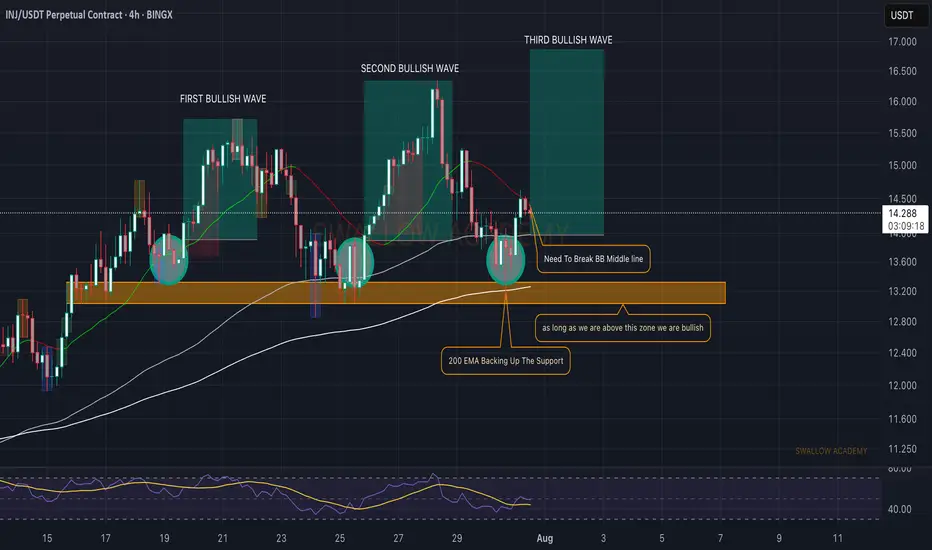
Injective (INJ): Getting Ready To Bounce | BullishINJ seems to be going for another upside movement here after a recent retest of the local support zone, where the price is now trying to break that middle line of Bollinger Bands, which is like a final stage for our upside movement here.
So that's what we are looking for: a break of the middle line of the Bollinger Bands and then a steep movement to upper zones.
Swallow Academy
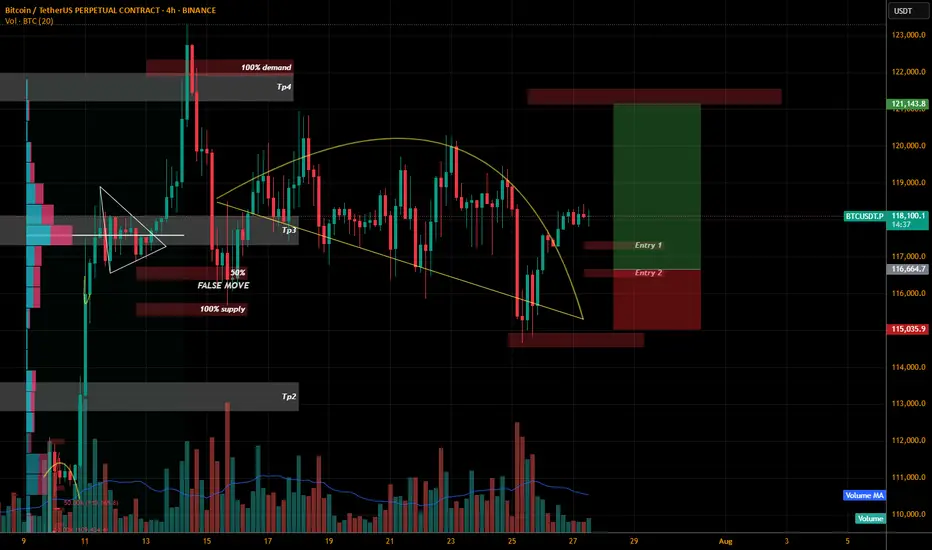
BTCUSDT.P LONGThe price is squeezed and its Sunday we might get a big move Positive Lets hope for the best and plan our trading.
I have marked 2 entries I think the more we wait the more we get.
So entry 2 in my opinion will be more beneficial to trail this trade. Anyhow if we see any bullish momentum on these level we are IN guys.
WHY? why i planned this trade as we can see the we are on sunday and price squeezed and we are already in bull run and we can see the price break the curve resistance so i hope the price will retest the level and if we see bullish candle patterns than only we will execute it.
If you like my previous ideas and analysis please don't forget to follow me. We all need encouragement. The more followers the more encouragement.
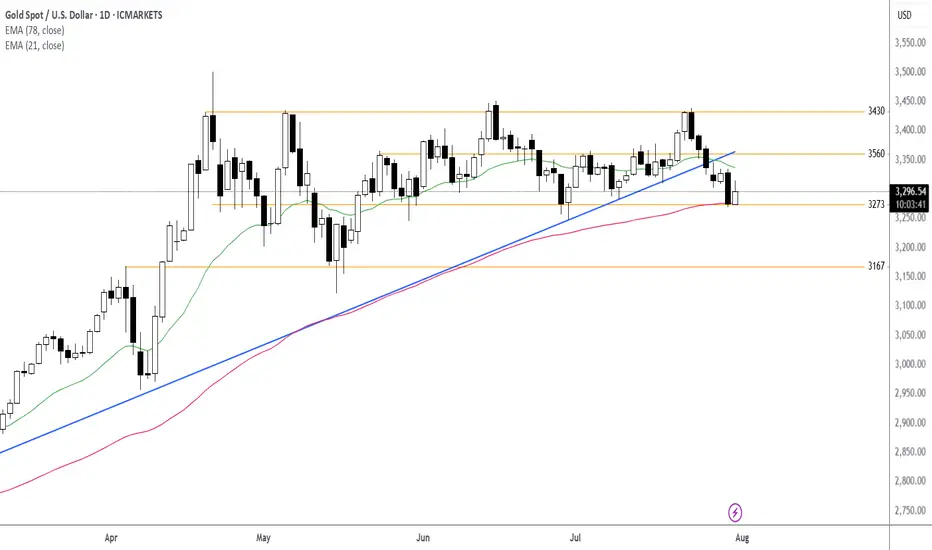
Gold trading analysis!Macro approach:
- Gold retreated this week, reversing early gains to trade near four-week lows amid renewed US dollar strength and caution ahead of the Fed's policy decision.
- The retreat was mainly pressured by stronger-than-expected US economic data and a tentative revival in risk appetite, offsetting pockets of safe-haven demand.
- Key drivers included robust US GDP growth for 2Q, a bounce in consumer confidence, and the Fed's steady rates with a more hawkish tone, suggesting cuts may be further out.
- Meanwhile, recent US-EU and US-China trade deals eased some global uncertainty, damping gold's appeal as a hedge.
- Market participants also eyed the labor market's continued cooling, but resilient consumer spending further buoyed the dollar.
- Gold may remain volatile, with potential upside if upcoming US PCE inflation and NFP reports disappoint expectations. Any escalation in trade tensions or signals of Fed policy easing could renew support for gold prices.
Technical approach:
- XAUUSD fluctuated within the range of 3285-3560, which is below the broken ascending trendline. The price between the two EMAs awaits an apparent breakout to determine the next trend.
- If XAUUSD breaks below the support at 3273, confluence with EMA78, the price may plunge to retest the following support at 3167.
- On the contrary, remaining above the support at 3273 may lead XAUUSD to retest the resistance at around 3560.
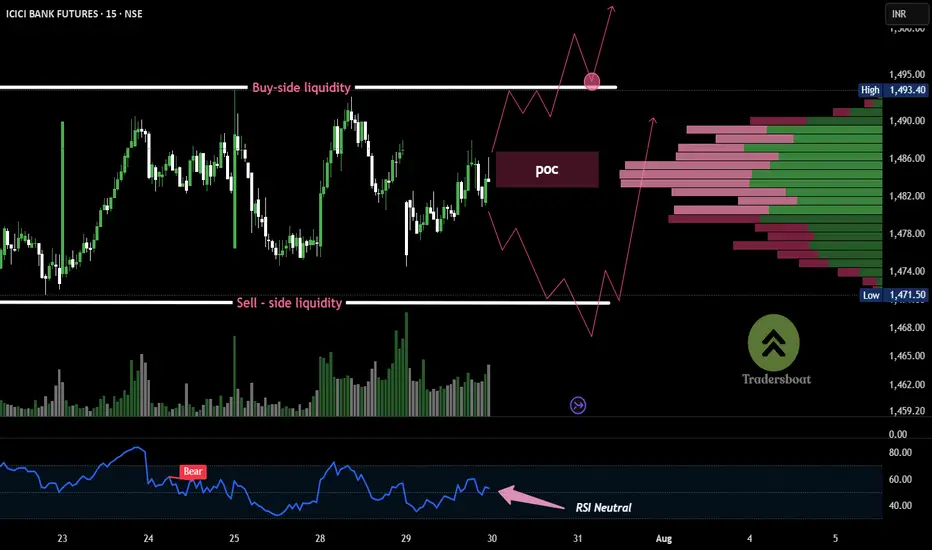
ICICI BANK -15MIN Volume bulge at ₹1485 = decision pointICICI Bank Futures is consolidating in a tight range between ₹1462 and ₹1493, building both buy-side and sell-side liquidity. This structure typically precedes a strong breakout.
The volume profile shows a concentration around ₹1484–₹1486, indicating it as a decision zone. RSI remains weak below 50, suggesting short-term bearish control, but a breakout in either direction could trigger momentum.
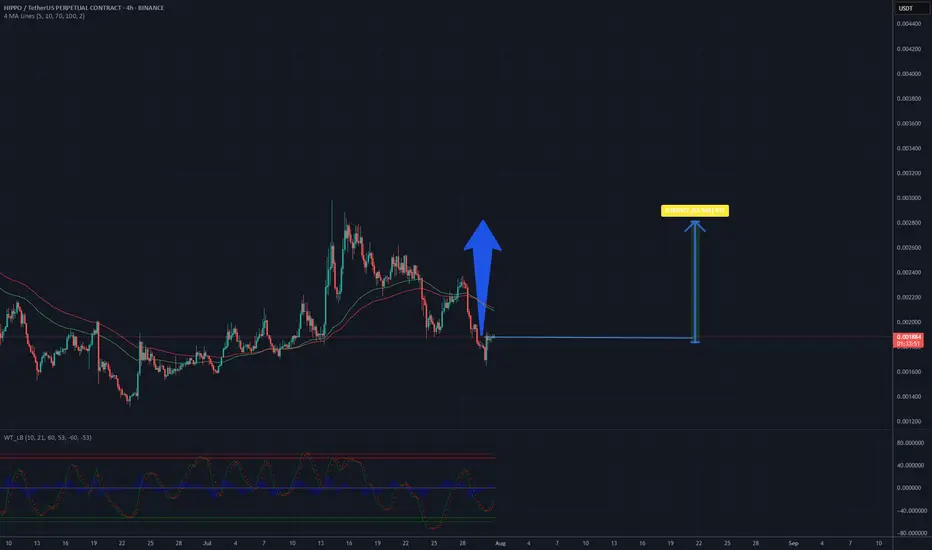
Is a time for HIPPOUSDT? Potential 50% - 0.0028 USD CRYPTOThe chart displays a 4-hour candlestick pattern for the HIPPO/USDT perpetual contract on Binance, showing price movements from late June to mid-September 2025. The price has recently experienced a downward trend after reaching a peak, with a noticeable drop from around 0.0028 to the current level of approximately 0.00186. The moving averages (red and green lines) indicate a potential bearish crossover, suggesting continued downward pressure in the short term. However, the price is approaching a support level near 0.0017, where historical buying interest might emerge. The oscillator at the bottom shows mixed signals, with a slight uptick that could hint at a potential reversal if momentum builds. Based on this analysis, a price recovery to 0.0028 seems plausible if the support holds and buying volume increases in the coming sessions.
Potential TP: 0.0028 USD
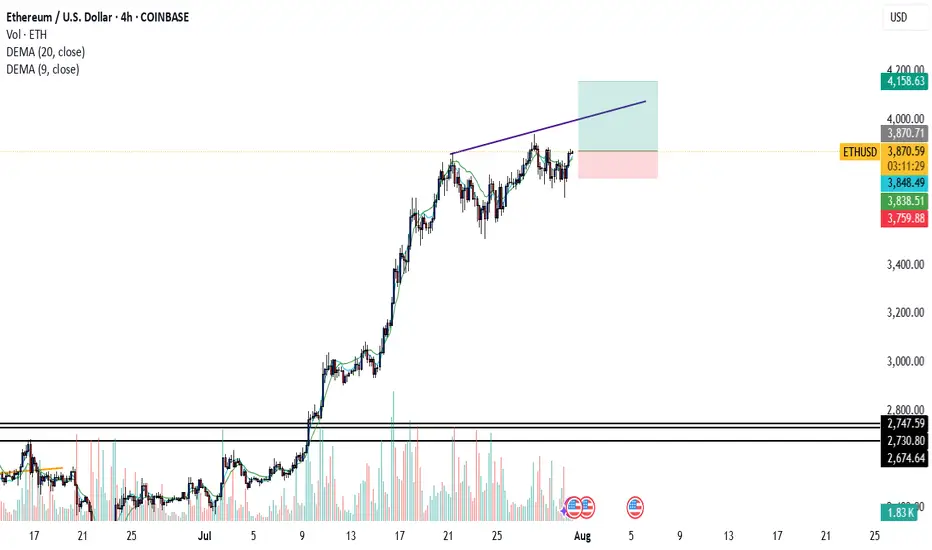
ETH bullish Tke your trade, etherium is showing so good resistence and a bullish confluences , next stop the 4000 dollars key zone ,
Aussie H4 | Bearish reversal off pullback resistanceBased on the H4 chart analysis, we can see that the price is reacting off the sell entry, which acts as a pullback resistance that aligns with the 23.6% Fibonacci retracement and could drop lower from this level.
Sell entry is at 0.6467, which is a pullback resistance that lines up with the 23.6% Fibonacci retracement.
Stop loss is at 0.6525, which is a pullback resistance that aligns with the 50% Fibonacci retracement.
Take profit is at 0.6389, which is a swing low support that aligns with the 138.2% Fibonacci extension.
High Risk Investment Warning
Trading Forex/CFDs on margin carries a high level of risk and may not be suitable for all investors. Leverage can work against you.
Stratos Markets Limited (tradu.com ):
CFDs are complex instruments and come with a high risk of losing money rapidly due to leverage. 65% of retail investor accounts lose money when trading CFDs with this provider. You should consider whether you understand how CFDs work and whether you can afford to take the high risk of losing your money.
Stratos Europe Ltd (tradu.com ):
CFDs are complex instruments and come with a high risk of losing money rapidly due to leverage. 66% of retail investor accounts lose money when trading CFDs with this provider. You should consider whether you understand how CFDs work and whether you can afford to take the high risk of losing your money.
Stratos Global LLC (tradu.com ):
Losses can exceed deposits.
Please be advised that the information presented on TradingView is provided to Tradu (‘Company’, ‘we’) by a third-party provider (‘TFA Global Pte Ltd’). Please be reminded that you are solely responsible for the trading decisions on your account. There is a very high degree of risk involved in trading. Any information and/or content is intended entirely for research, educational and informational purposes only and does not constitute investment or consultation advice or investment strategy. The information is not tailored to the investment needs of any specific person and therefore does not involve a consideration of any of the investment objectives, financial situation or needs of any viewer that may receive it. Kindly also note that past performance is not a reliable indicator of future results. Actual results may differ materially from those anticipated in forward-looking or past performance statements. We assume no liability as to the accuracy or completeness of any of the information and/or content provided herein and the Company cannot be held responsible for any omission, mistake nor for any loss or damage including without limitation to any loss of profit which may arise from reliance on any information supplied by TFA Global Pte Ltd.
The speaker(s) is neither an employee, agent nor representative of Tradu and is therefore acting independently. The opinions given are their own, constitute general market commentary, and do not constitute the opinion or advice of Tradu or any form of personal or investment advice. Tradu neither endorses nor guarantees offerings of third-party speakers, nor is Tradu responsible for the content, veracity or opinions of third-party speakers, presenters or participants.

USDCHF H4 | Bearish reversalBased on the H4 chart analysis, we can see that the price has rejected off the sell entry and could drop from this level towards the take profit.
Sell entry is at 0.8153. which is a pullback resistance that lines up with the 161.8% Fibonacci extension.
Stop loss is at 0.8243, which is a swing high resistance.
Take profit is at 0.8067, which is an overlap support that lines up with the 38.2% Fibonacci retracement.
High Risk Investment Warning
Trading Forex/CFDs on margin carries a high level of risk and may not be suitable for all investors. Leverage can work against you.
Stratos Markets Limited (tradu.com ):
CFDs are complex instruments and come with a high risk of losing money rapidly due to leverage. 65% of retail investor accounts lose money when trading CFDs with this provider. You should consider whether you understand how CFDs work and whether you can afford to take the high risk of losing your money.
Stratos Europe Ltd (tradu.com ):
CFDs are complex instruments and come with a high risk of losing money rapidly due to leverage. 66% of retail investor accounts lose money when trading CFDs with this provider. You should consider whether you understand how CFDs work and whether you can afford to take the high risk of losing your money.
Stratos Global LLC (tradu.com ):
Losses can exceed deposits.
Please be advised that the information presented on TradingView is provided to Tradu (‘Company’, ‘we’) by a third-party provider (‘TFA Global Pte Ltd’). Please be reminded that you are solely responsible for the trading decisions on your account. There is a very high degree of risk involved in trading. Any information and/or content is intended entirely for research, educational and informational purposes only and does not constitute investment or consultation advice or investment strategy. The information is not tailored to the investment needs of any specific person and therefore does not involve a consideration of any of the investment objectives, financial situation or needs of any viewer that may receive it. Kindly also note that past performance is not a reliable indicator of future results. Actual results may differ materially from those anticipated in forward-looking or past performance statements. We assume no liability as to the accuracy or completeness of any of the information and/or content provided herein and the Company cannot be held responsible for any omission, mistake nor for any loss or damage including without limitation to any loss of profit which may arise from reliance on any information supplied by TFA Global Pte Ltd.
The speaker(s) is neither an employee, agent nor representative of Tradu and is therefore acting independently. The opinions given are their own, constitute general market commentary, and do not constitute the opinion or advice of Tradu or any form of personal or investment advice. Tradu neither endorses nor guarantees offerings of third-party speakers, nor is Tradu responsible for the content, veracity or opinions of third-party speakers, presenters or participants.

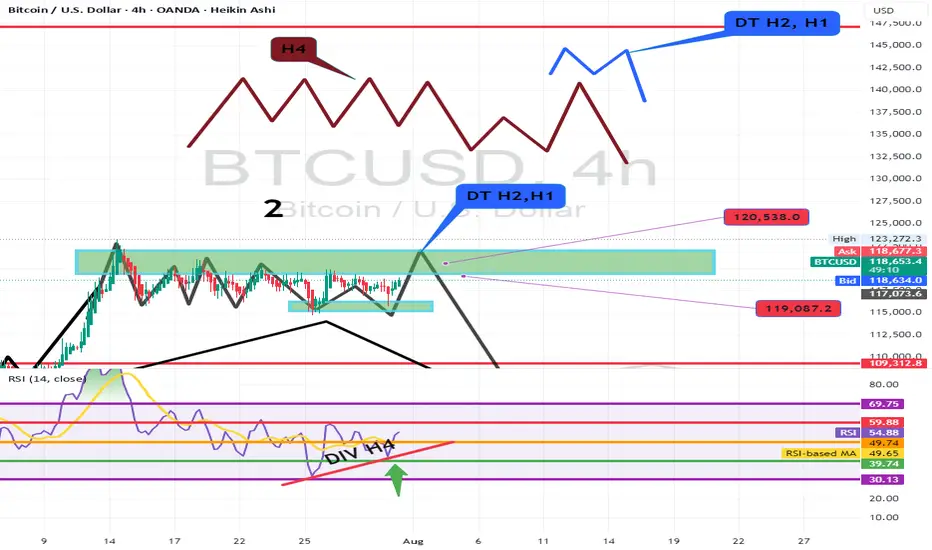
BTC USDHI GUYS.
update on daily path, weekly path to incoming serious sells.
on the right we see h4 buys to clear upper area. then i expect sells soon with h2,h1 double top price action incoming
Esports chartEsports chart key levels of support / resistance and targets on the medium time frame if resistance becomes support

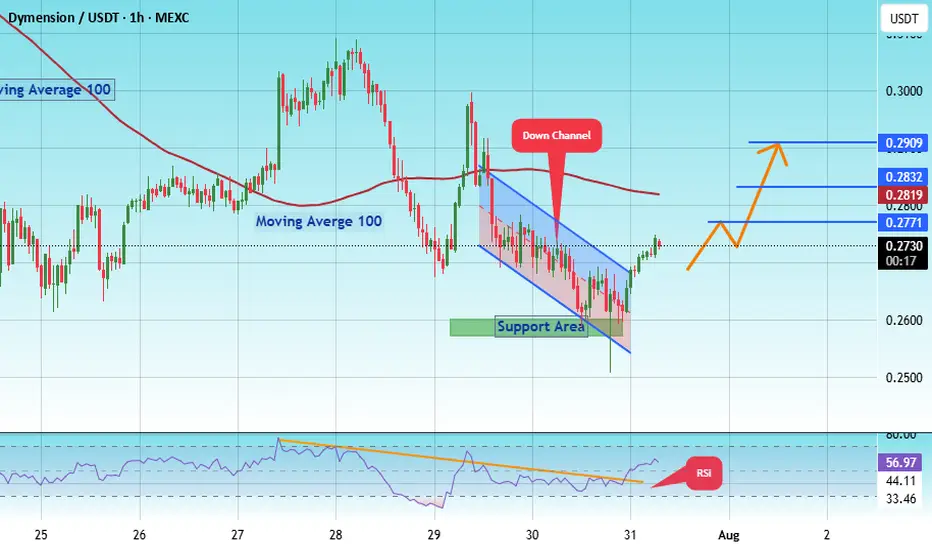
#DYM/USDT Dymension's Falling Wedge#DYM
The price is moving within an ascending channel on the 1-hour frame, adhering well to it, and is on track to break it strongly upwards and retest it.
We have support from the lower boundary of the ascending channel, at 0.2550.
We have a downtrend on the RSI indicator that is about to break and retest, supporting the upside.
There is a major support area in green at 0.2583, which represents a strong basis for the upside.
Don't forget a simple thing: ease and capital.
When you reach the first target, save some money and then change your stop-loss order to an entry order.
For inquiries, please leave a comment.
We have a trend to hold above the 100 Moving Average.
Entry price: 0.2730.
First target: 0.2771.
Second target: 0.2832.
Third target: 0.2909.
Don't forget a simple thing: ease and capital.
When you reach your first target, save some money and then change your stop-loss order to an entry order.
For inquiries, please leave a comment.
Thank you.
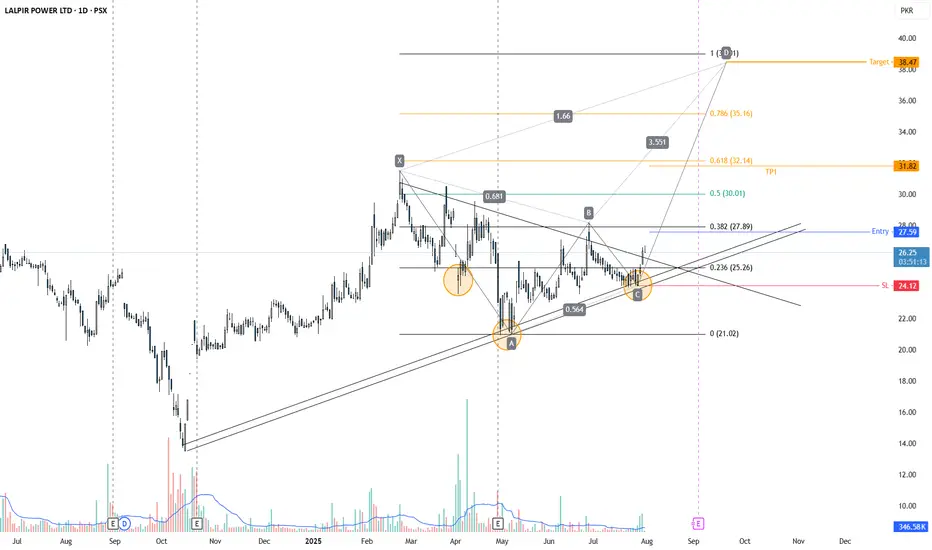
LPL is back again, after a long timeLPL is back again, after a long time.
It has broken its trendline Resistance, forming an inverted Head and Shoulder pattern; moreover, it is also forming a Harmonic pattern.
A sharp move towards the C point may be expected.