Soul for souls Our BTC target was on spot and exceeded our expectations
Alts will follow and now everything looks set and more clear could be the real alt season,
Anyhow my target for soulusdt and I was being conservative I do expect it to go higher but that down to preference
Enjoy
Harmonic Patterns

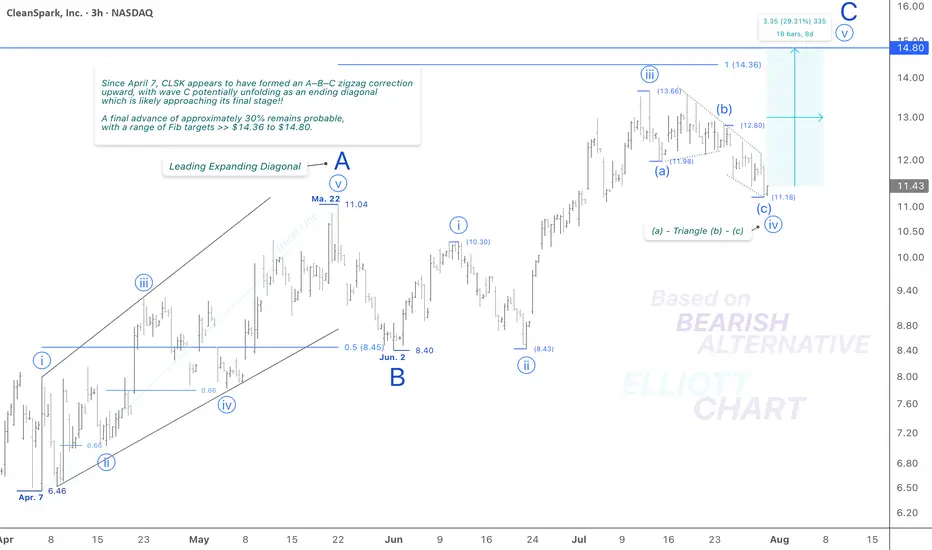
CLSK / 3hToday’s unexpected 2.6% decline, along with the continued development of an ending diagonal in the final leg of the correction, supports a reversion to the previously considered structure: an formation for wave iv (circled). This revised interpretation aligns more closely with the current price action and wave behavior.
I continue to view Minor wave C as an impulsive sequence as well, which now appears to be entering its final stage—an anticipated advance in wave v (circled), with a projected Fib target in the 14.36–14.80 range.
Wave Analysis >> While the current outlook on NASDAQ:CLSK remains consistent with previous analysis, the 3-h frame above shows that Minor wave C—completing the corrective advance of wave (B)—appears to be unfolding in an impulsive sequence, likely entering its final stages.
Within this structure, Minute wave iv (circled) has taken the form of an correction. A final push higher in Minute wave v (circled) is now anticipated, which would complete the ongoing wave C and, in turn, mark the conclusion of the countertrend advance in Intermediate degree wave (B).
Trend Analysis >> Upon completion of Minor wave C, a broader trend reversal to the downside is anticipated, marking the beginning of the final decline in Intermediate wave (C). This bearish phase may develop over the coming months and could persist through the end of the year.
#CryptoStocks #CLSK #BTCMining #Bitcoin #BTC
NASDAQ:CLSK MARKETSCOM:BITCOIN CRYPTOCAP:BTC BITSTAMP:BTCUSD
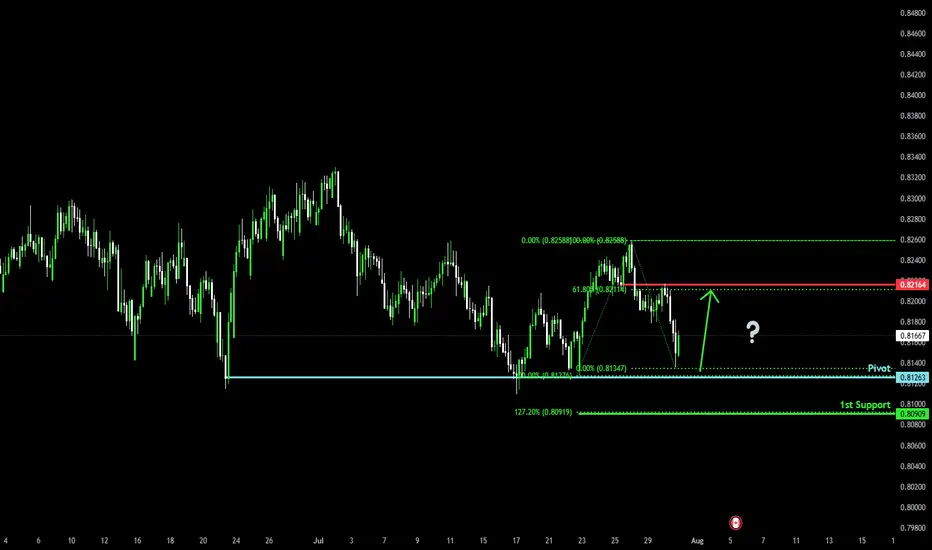
Bullish reversal?NZD/CAD is falling towards the pivot an could bounce to the 1st resistance.
Pivot: 0.81263
1st Support: 0.80909
1st Resistance: 0.82164
Risk Warning:
Trading Forex and CFDs carries a high level of risk to your capital and you should only trade with money you can afford to lose. Trading Forex and CFDs may not be suitable for all investors, so please ensure that you fully understand the risks involved and seek independent advice if necessary.
Disclaimer:
The above opinions given constitute general market commentary, and do not constitute the opinion or advice of IC Markets or any form of personal or investment advice.
Any opinions, news, research, analyses, prices, other information, or links to third-party sites contained on this website are provided on an "as-is" basis, are intended only to be informative, is not an advice nor a recommendation, nor research, or a record of our trading prices, or an offer of, or solicitation for a transaction in any financial instrument and thus should not be treated as such. The information provided does not involve any specific investment objectives, financial situation and needs of any specific person who may receive it. Please be aware, that past performance is not a reliable indicator of future performance and/or results. Past Performance or Forward-looking scenarios based upon the reasonable beliefs of the third-party provider are not a guarantee of future performance. Actual results may differ materially from those anticipated in forward-looking or past performance statements. IC Markets makes no representation or warranty and assumes no liability as to the accuracy or completeness of the information provided, nor any loss arising from any investment based on a recommendation, forecast or any information supplied by any third-party.
Bullish bounce?NZD/CHF is reacting off the pivot, which is a pullback support and could rise to the 1st resistance.
Pivot: 0.47867
1st Support: 0.47391
1st Resistance: 0.48695
Risk Warning:
Trading Forex and CFDs carries a high level of risk to your capital and you should only trade with money you can afford to lose. Trading Forex and CFDs may not be suitable for all investors, so please ensure that you fully understand the risks involved and seek independent advice if necessary.
Disclaimer:
The above opinions given constitute general market commentary, and do not constitute the opinion or advice of IC Markets or any form of personal or investment advice.
Any opinions, news, research, analyses, prices, other information, or links to third-party sites contained on this website are provided on an "as-is" basis, are intended only to be informative, is not an advice nor a recommendation, nor research, or a record of our trading prices, or an offer of, or solicitation for a transaction in any financial instrument and thus should not be treated as such. The information provided does not involve any specific investment objectives, financial situation and needs of any specific person who may receive it. Please be aware, that past performance is not a reliable indicator of future performance and/or results. Past Performance or Forward-looking scenarios based upon the reasonable beliefs of the third-party provider are not a guarantee of future performance. Actual results may differ materially from those anticipated in forward-looking or past performance statements. IC Markets makes no representation or warranty and assumes no liability as to the accuracy or completeness of the information provided, nor any loss arising from any investment based on a recommendation, forecast or any information supplied by any third-party.

OMNIUSDT.P SHORTThe price is consolidating in a pennant and I think it should break out before breaking down to show a false breakout and trap us.
If price firstly breakdown than I'm not going to trade. mostly pennant breaks are sudden sometimes and big candles we should stay away.
The setup has been marked and still if we get bearish candles even till 5.5 level we can get in this trade. I always try my best to find the safest entry zone.
Rest keep supporting me. Follow me.
Thanks

BUY GBPNZDGBPNZD is currently forming a bearish flag pattern. This trade idea is based on the assumption that price will retest the resistance trend line once more before plummeting

ENAthe daily closed inside THE CLS RANGE
This means that the price will likely revert, into the OB as shown in the chart (which is my entry)
Im confident in targeting the full range as the liquidity is stored there + ENA tapped the daily OB today which is generally bullish.
And
As we all know, market chases liquidity.
Goodluck
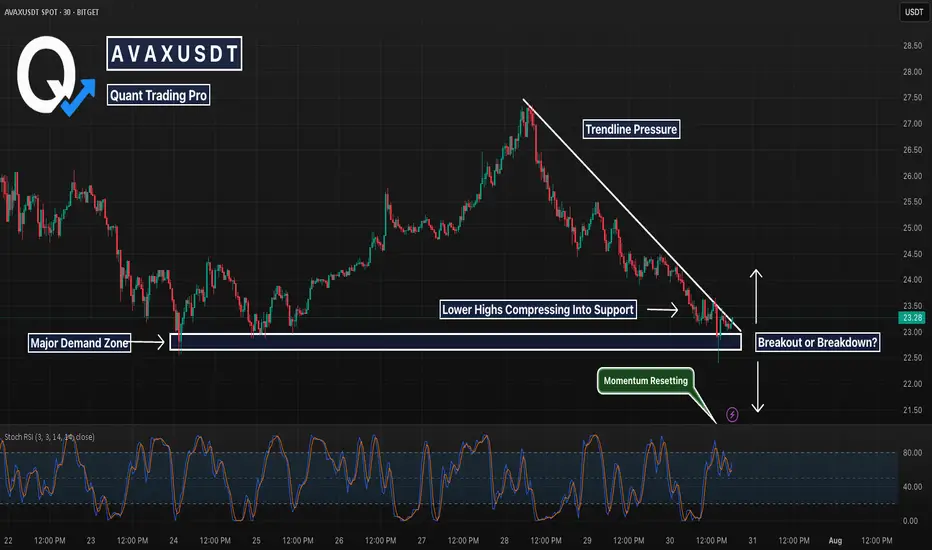
AVAX 30m – Compression Into Support, Breakout or Breakdown Next?AVAX has been grinding down inside a descending triangle, pressing into a major support zone that’s already seen multiple reactions.
📉 Price action is currently wedged between:
Strong horizontal demand (white box)
Well-defined trendline resistance (descending white line)
Today’s wick below support was aggressively bought up — but until we get a clean break from this squeeze, momentum remains neutral at best.
🔍 What We’re Watching:
Support holding = possible spring and breakout setup
Rejection from trendline = bearish continuation structure
Stoch RSI reset = momentum is primed for a move in either direction
This is a textbook example of compression → expansion. Break + retest setups will be key

Total 2 --- Long For ALTshi
as i said in BTC.D and USDT.d analyse this charts has correction potential , if thats occure and market makers looks to ALTs . total 2 make a good high and show green ALTs market for some weeks.
it's my peronal idea for this chart , please do not make and inveting and trading on my analyse.
tnx for follow me
Mehdi Khamisi Zadeh
Eurusd
---
### 💥 The Hidden Secret of Pro Traders:
Most traders jump straight into low timeframes like M15 or H1, chasing signals...
But the market's real moves? They start on the **higher timeframes** like weekly or Daily. 🤯
👉 **Golden Formula:**
- 🧭 **Higher Timeframe = Direction**
(Is the market trending up, down, or just ranging?)
- ⏱️ **Lower Timeframe = Precise Entry**
(When to get in? Where to place stops?)
Trading without the higher timeframe is like driving without a map. Sure, you're moving—but do you know *where you're going*?
---
### 📌 Quick Breakdown:
- Start on **2D or Daily** charts to define:
- Strong support/resistance zones
- Overall market structure
- Clear chart patterns
Then drop into **lower timeframes** (like H1 or M15):
This is where sniper entries and clean risk/reward setups live.
Pro Tip:
> "Your trading plan starts at the top... and finds its perfect shot at the bottom."
Be the sniper, not the spray-and-pray trader.
---
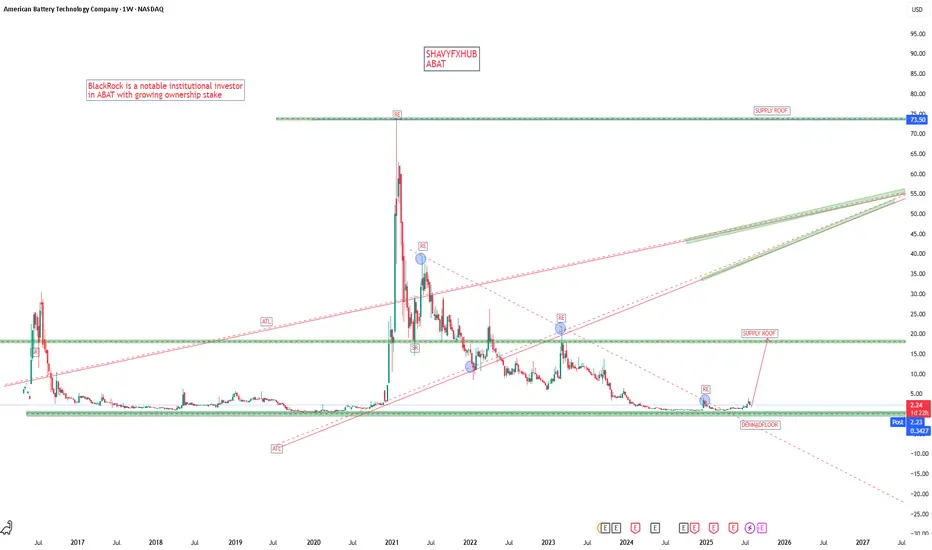
ABATThe American Battery Technology Company (ABAT) is a U.S.-based battery materials and recycling company focused on domestic production of critical battery minerals, including lithium. It has received significant federal support and attention in recent years tied to strategic initiatives to boost domestic mining and manufacturing of battery materials.
BlackRock has bought shares in American Battery Technology Company (ABAT). As of March 31, 2025, BlackRock held approximately 791,296 shares, on June 30, 2025, BlackRock made a significant move by acquiring an additional approximately 3.9 million shares, indicating an expansion of its stake in ABAT.
Key recent developments about ABAT include:
ABAT received a $900 million Letter of Interest from the U.S. Export-Import Bank (EXIM Bank) to finance its Tonopah Flats Lithium Project in Nevada, which involves building a lithium mine and a lithium hydroxide refinery with a capacity of 30,000 tonnes per year. This financing aligns with the U.S. government’s initiatives to strengthen domestic critical mineral supply chains and reduce dependence on China.
The Tonopah Flats project is considered one of the largest known lithium deposits in the U.S., and ABAT has demonstrated its ability to produce battery-grade lithium hydroxide at pilot scale from the lithium-rich claystone resource there.
ABAT has also secured a $150 million grant from the U.S. Department of Energy to build a second commercial-scale lithium-ion battery recycling facility, further supporting the domestic supply chain for battery metals critical to electrification and sustainability efforts. This facility will create hundreds of jobs and promote environmentally sustainable battery materials manufacturing.
The federal support for ABAT ties into broader government strategies such as the “Make More in America” initiative and the March 2025 Executive Order on increasing American mineral production.
The company’s CEO, Ryan Melsert, has expressed that these government endorsements validate ABAT’s mission to commercialize technologies for both primary mining and secondary lithium-ion battery recycling.
In summary, the American Battery Technology Company (ABAT) is a key player in the U.S. domestic battery materials sector, leveraging federal funding and policy initiatives to develop a large-scale lithium mine and refinery in Nevada, as well as expand battery recycling facilities to help secure and localize the battery materials supply chain.
#abat #stocks
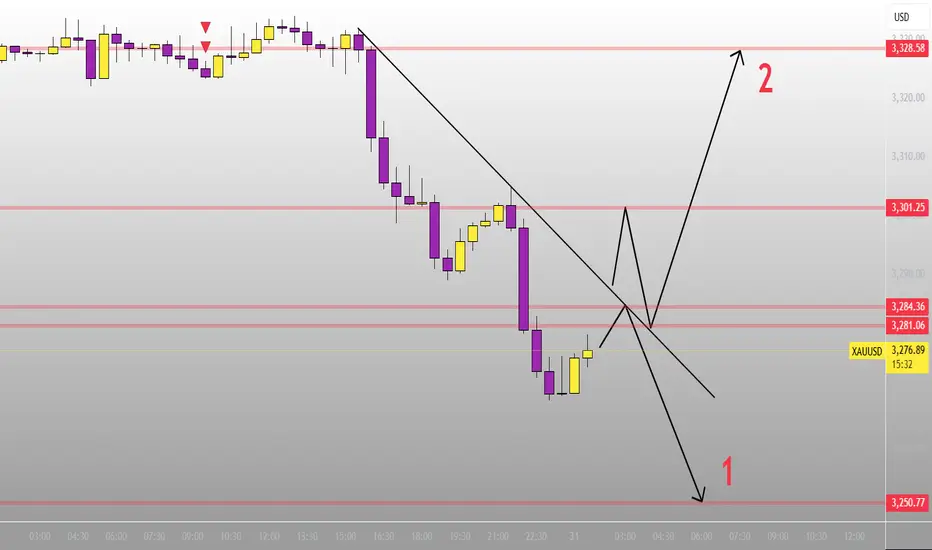
XAUUSD
XAUUSD Updated in 30M :
After the big drop in gold, two scenarios can be predicted for this precious metal.
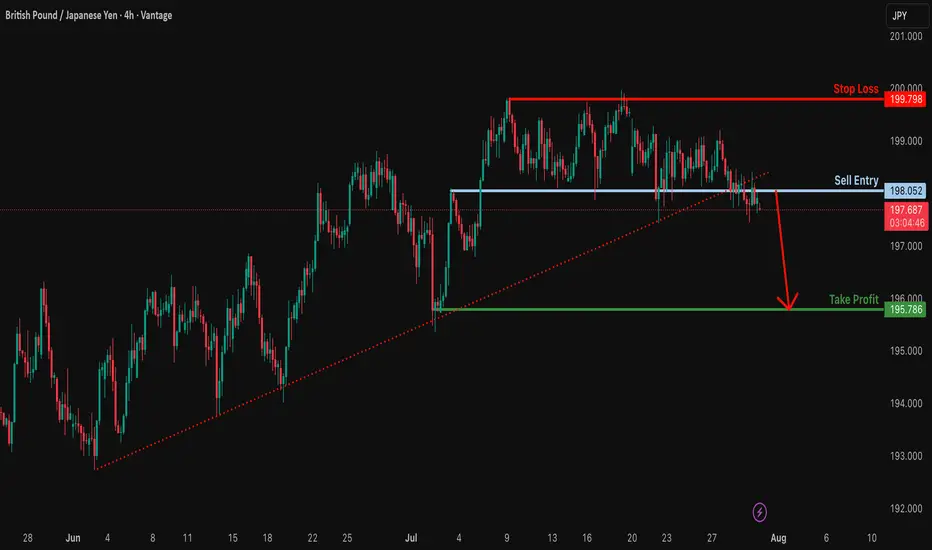
Potential bearish drop?GBP/JPY is reacting off the resitance level which is anoverlap resistance and could drop from this level to our takeprofit.
Entry: 198.05
Why we like it:
There is anoverlap support.
Stop loss: 199.79
Why we like it:
There is a multi swing high resistance.
Take profit: 195.78
Why we like it:
There is a swing low support.
Enjoying your TradingView experience? Review us!
Please be advised that the information presented on TradingView is provided to Vantage (‘Vantage Global Limited’, ‘we’) by a third-party provider (‘Everest Fortune Group’). Please be reminded that you are solely responsible for the trading decisions on your account. There is a very high degree of risk involved in trading. Any information and/or content is intended entirely for research, educational and informational purposes only and does not constitute investment or consultation advice or investment strategy. The information is not tailored to the investment needs of any specific person and therefore does not involve a consideration of any of the investment objectives, financial situation or needs of any viewer that may receive it. Kindly also note that past performance is not a reliable indicator of future results. Actual results may differ materially from those anticipated in forward-looking or past performance statements. We assume no liability as to the accuracy or completeness of any of the information and/or content provided herein and the Company cannot be held responsible for any omission, mistake nor for any loss or damage including without limitation to any loss of profit which may arise from reliance on any information supplied by Everest Fortune Group.
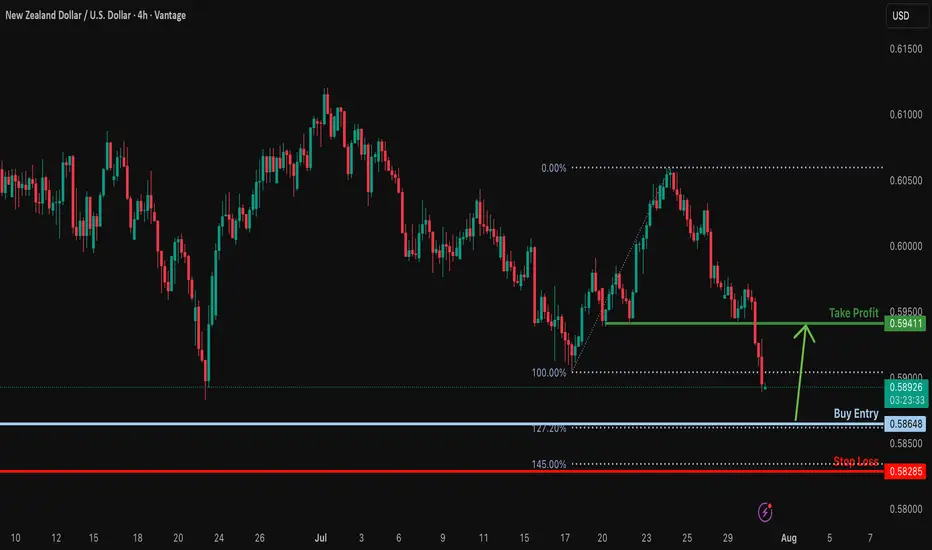
Bullish reversal?NZD/USD is falling towards the support level, which is a swing low support that lines up with the 127.2% Fibonacci extension. Could NZD/USD bounce from this level to our take profit?
Entry: 0.5864
Why we like it:
There is a swing low support that lines up with the 127.2% Fibonacci extension.
Stop loss: 0.5828
Why we like it:
There is a pullback support that lines up with the 145% Fibonacci extension.
Takeprofit: 0.5941
Why we like it:
There is a pullback resistance level.
Enjoying your TradingView experience? Review us!
Please be advised that the information presented on TradingView is provided to Vantage (‘Vantage Global Limited’, ‘we’) by a third-party provider (‘Everest Fortune Group’). Please be reminded that you are solely responsible for the trading decisions on your account. There is a very high degree of risk involved in trading. Any information and/or content is intended entirely for research, educational and informational purposes only and does not constitute investment or consultation advice or investment strategy. The information is not tailored to the investment needs of any specific person and therefore does not involve a consideration of any of the investment objectives, financial situation or needs of any viewer that may receive it. Kindly also note that past performance is not a reliable indicator of future results. Actual results may differ materially from those anticipated in forward-looking or past performance statements. We assume no liability as to the accuracy or completeness of any of the information and/or content provided herein and the Company cannot be held responsible for any omission, mistake nor for any loss or damage including without limitation to any loss of profit which may arise from reliance on any information supplied by Everest Fortune Group.
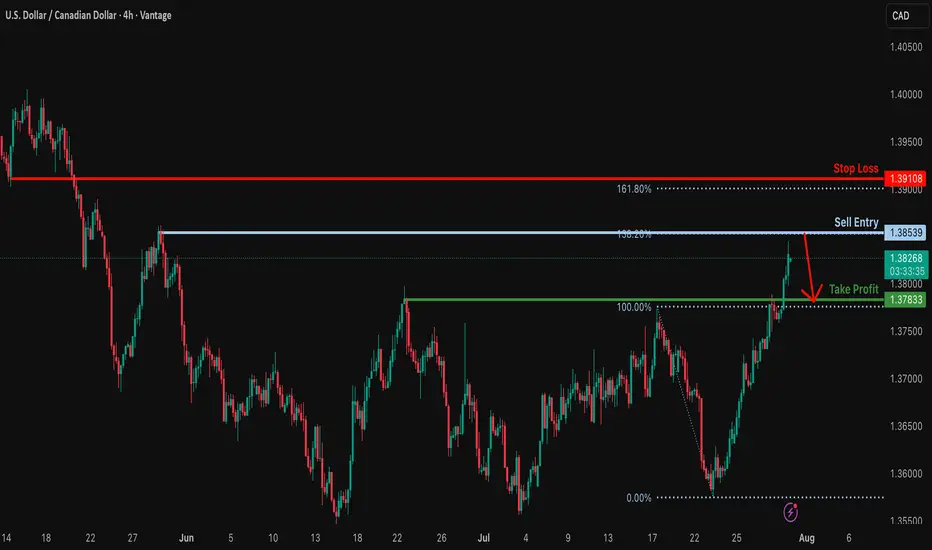
Could the Loonie reverse from here?The price is rising towards the resistance level, which is a swing high resistance that aligns with the 138.2% Fibonacci extension and could potentially reverse from this level to our take-profit.
Entry: 1.3853
Why we like it:
There is a swing high resistance that lines up with the 138.2% Fibonacci extension.
Stop loss: 1.3910
Why we like it:
There is a pullback resistance that is slightly above the 161.8% Fibonacci extension.
Take profit: 1.3783
Why we like it:
There is a pullback support.
Enjoying your TradingView experience? Review us!
Please be advised that the information presented on TradingView is provided to Vantage (‘Vantage Global Limited’, ‘we’) by a third-party provider (‘Everest Fortune Group’). Please be reminded that you are solely responsible for the trading decisions on your account. There is a very high degree of risk involved in trading. Any information and/or content is intended entirely for research, educational and informational purposes only and does not constitute investment or consultation advice or investment strategy. The information is not tailored to the investment needs of any specific person and therefore does not involve a consideration of any of the investment objectives, financial situation or needs of any viewer that may receive it. Kindly also note that past performance is not a reliable indicator of future results. Actual results may differ materially from those anticipated in forward-looking or past performance statements. We assume no liability as to the accuracy or completeness of any of the information and/or content provided herein and the Company cannot be held responsible for any omission, mistake nor for any loss or damage including without limitation to any loss of profit which may arise from reliance on any information supplied by Everest Fortune Group.
ETHUSD - Bearish But patternThe price completed the bearish bat harmonic pattern.
The level is additionally confirmed by another Fibo measurement and the price is at levels where usually returned.
Yet, the surging USD is a bearish factor.

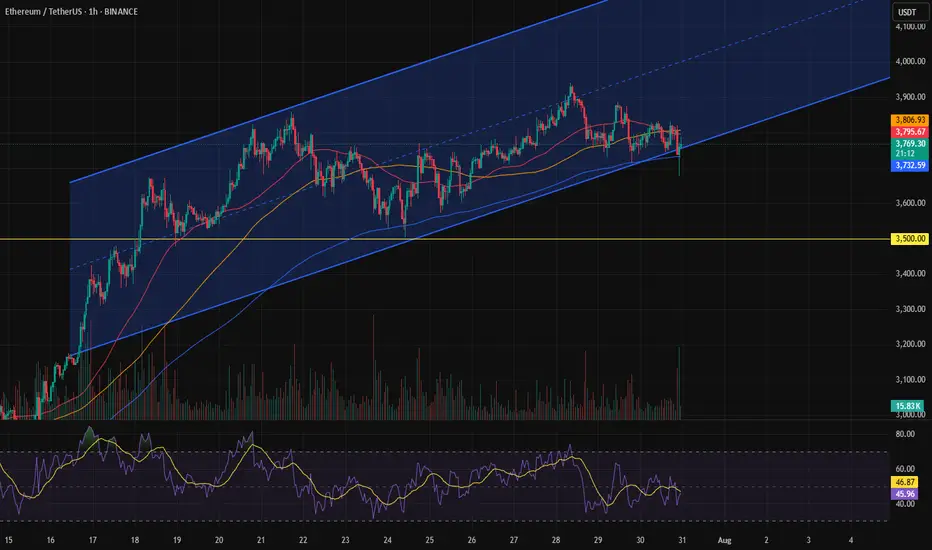
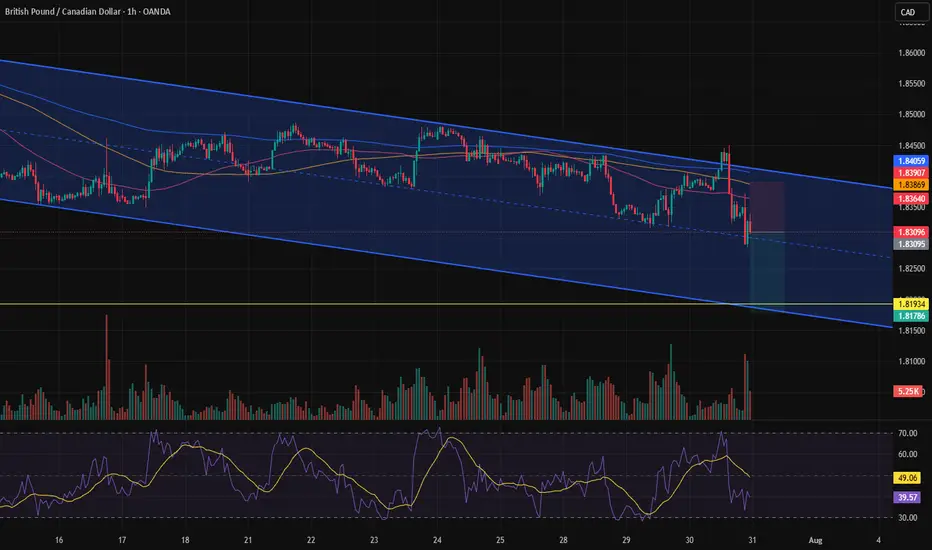
A move toward the bottom of the channel.After reaching the midline of the channel, a strong green shadow (wick) appeared and the price was rejected, but after that, there were no more green candles. It seems that the price is now inclined to move toward the bottom of the channel.
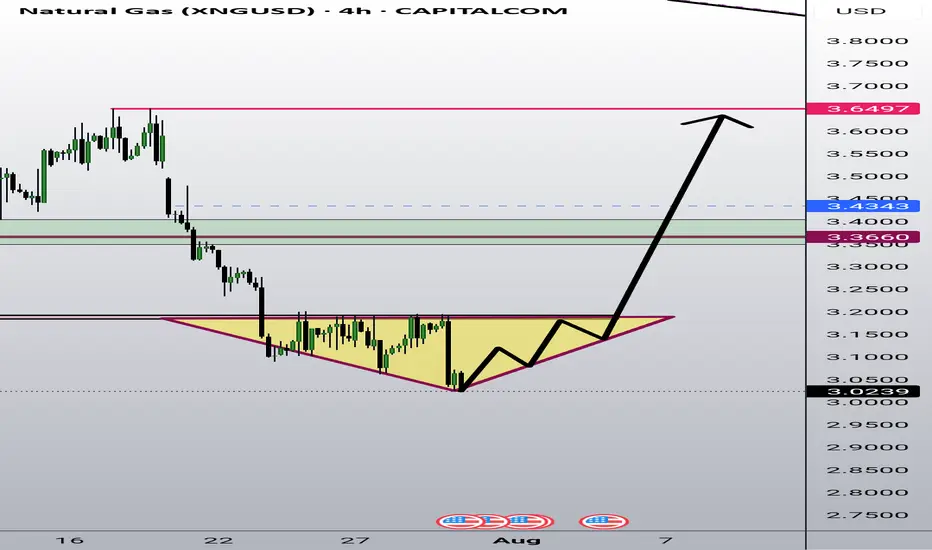
Bullish Diamond pattern (Reversal) is forming in Natural GasNatural Gas is show Classical bullish Diamond pattern character supported by oversold Rsi & triple bottom in weekly
Any good positive data will trigger sharp reversal in Natural Gas
Reversal will be brutual
Seller be cautious trail your stoploss
CVNA EARNINGS TRADE IDEA — July 30 (AMC)
## 🚗 CVNA EARNINGS TRADE IDEA — July 30 (AMC)
**Carvana (CVNA)**
📊 **Bullish Confidence**: 85%
📈 **Earnings Play Setup**
💣 Big Volatility + Strong History = Explosive Potential
---
### ⚙️ FUNDAMENTALS SNAPSHOT
✅ **Revenue Growth**: +38.3% YoY
🔁 **8/8 EPS Beats** (114.5% avg surprise)
🟡 **Profit Margin**: 2.7% (Thin but improving)
⚠️ **Debt-to-Equity**: 344.78 (High leverage risk)
💬 **Sector Rotation**: Growth favors high-beta names
💡 **Beta**: 3.60 → Big post-earnings swings likely
---
### 📊 OPTIONS FLOW HEATMAP
🔥 Heavy Call Volume @ \$360–\$370
🟢 Bullish OI Stack
📉 Put/Call Skew: CALL DOMINANT
💥 IV Elevated = Lotto ticket pricing
---
### 📈 TECHNICALS
💵 Price: \$336.50
🧱 Resistance: \$343.68
📉 RSI: 44.5 (Neutral – Room to Run)
📊 200D MA: \$252.21 → Long-term bullish positioning
---
### 🔥 TRADE IDEA:
**CVNA 08/01 \$360 CALL**
🎯 **Entry**: \$11.25
🚀 **Target**: \$33.75 (200% ROI)
🛑 **Stop**: \$5.60
📊 **Size**: 1 contract
⏰ **Entry Timing**: Pre-Earnings Close (AMC play)
---
### 📉 RISK / REWARD
* 🟥 Max Loss: \$11.25
* 🟩 Profit Target: \$33.75
* ⚖️ RR Ratio: 1:3
* 💼 Portfolio Risk: 2–3%
---
### 🧠 STRATEGY INSIGHTS
✅ Historical beat rate = STRONG
✅ Bullish options skew = CONFIRMED
⚠️ High debt = risk, but momentum > fear
📌 Tip: If IV crushes post-earnings, exit fast. This is a *structured speculative play* — not a hold-and-hope.
---
📢 "Speculation is fine. Structure it."
💬 Tag a trader who *YOLOs with stop losses* 👇
\#CVNA #EarningsPlay #OptionsTrading #TradingView #HighBeta #LottoPlay #RiskManaged #CallOptions #BullishSetup #IVCrushProof #EcommerceStocks #EarningsSeason
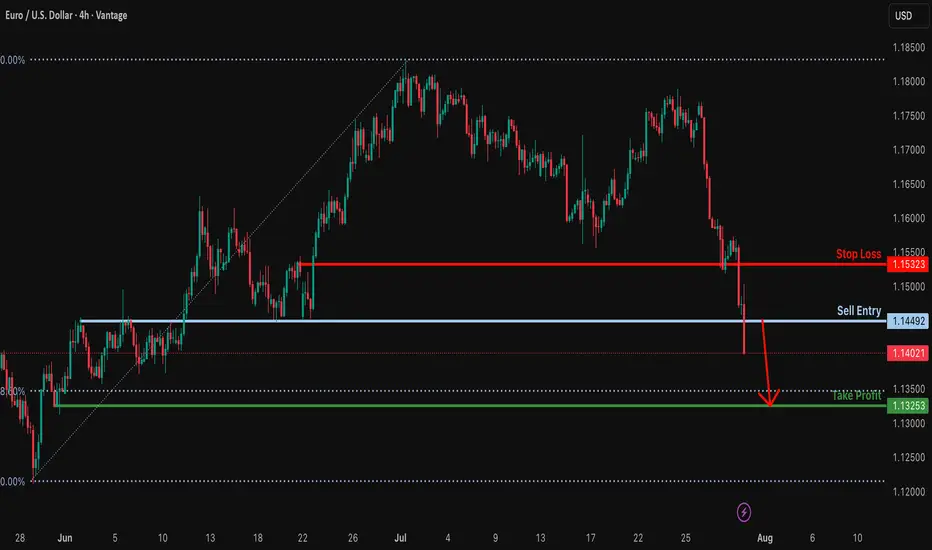
Bearish drop?EUR/USD has broken out of the support level, which is an overlap support. A potential pullback to the sell entry followed by a reversal could lead the price to drop from this level to our take-profit.
Entry: 1.1449
Why we like it:
There is an overlap resitance level.
Stop loss: 1.1532
Why we like it:
There is a pullback resitance level.
Take profit: 1.1325
Why we like it:
There is a swing low support that is slghtly below the 78.6% Fibonacci retracement.
Enjoying your TradingView experience? Review us!
Please be advised that the information presented on TradingView is provided to Vantage (‘Vantage Global Limited’, ‘we’) by a third-party provider (‘Everest Fortune Group’). Please be reminded that you are solely responsible for the trading decisions on your account. There is a very high degree of risk involved in trading. Any information and/or content is intended entirely for research, educational and informational purposes only and does not constitute investment or consultation advice or investment strategy. The information is not tailored to the investment needs of any specific person and therefore does not involve a consideration of any of the investment objectives, financial situation or needs of any viewer that may receive it. Kindly also note that past performance is not a reliable indicator of future results. Actual results may differ materially from those anticipated in forward-looking or past performance statements. We assume no liability as to the accuracy or completeness of any of the information and/or content provided herein and the Company cannot be held responsible for any omission, mistake nor for any loss or damage including without limitation to any loss of profit which may arise from reliance on any information supplied by Everest Fortune Group.
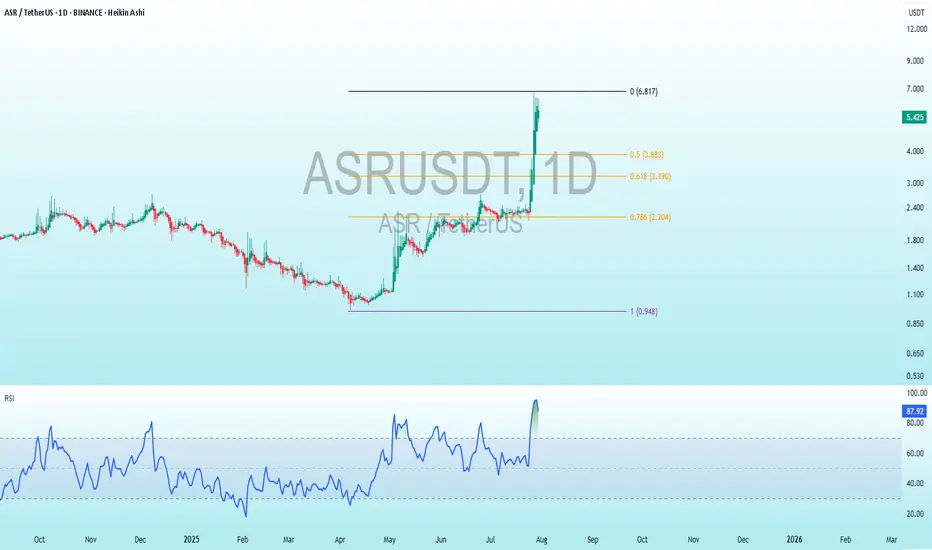
ASR Bearish DivergenceBINANCE:ASRUSDT
Trade Setup:
Target 1: 3.883 (0.5 Fibonnaci Golden Zone).
Target 2: 3.190 (0.618 Fibonnaci Golden Zone).
Target 3: 2.204 (0.786 Fibonnaci Golden Zone).
Target 4: 0.948 (1 Fibonnaci).
Stop Loss: 6.817 (0 Fibonnaci).
RSI Analysis: The RSI is showing a bullish divergence, suggesting potential bullish momentum. The current RSI is around 88.00, approaching overbuy territory, so caution is advised.
Ethereum at \$3,500 — or not?As we can see, Ethereum was moving within a channel, but toward the end, it could only reach the midline of the channel before getting rejected.
This could be a signal for a drop toward the \$3,500 area.
Otherwise, it might be a fake move, followed by a return into the channel and a move back toward the channel’s midline.