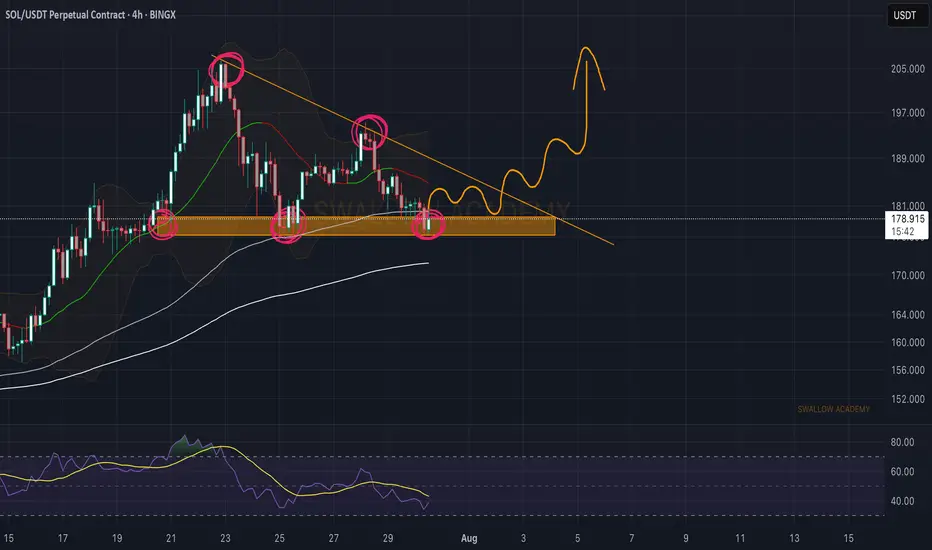
Solana (SOL): Triangle Pattern | Waiting For Bullish BreakoutSolana failed to break down from the local neckline zone (or support zone, for those who want to call it that). What we got instead is buyside dominance, where buyers took back the area and are now pushing the price back toward the upper side of that triangle pattern, so that's where our current target is sitting, as long as we break that line.
Swallow Academy
Harmonic Patterns
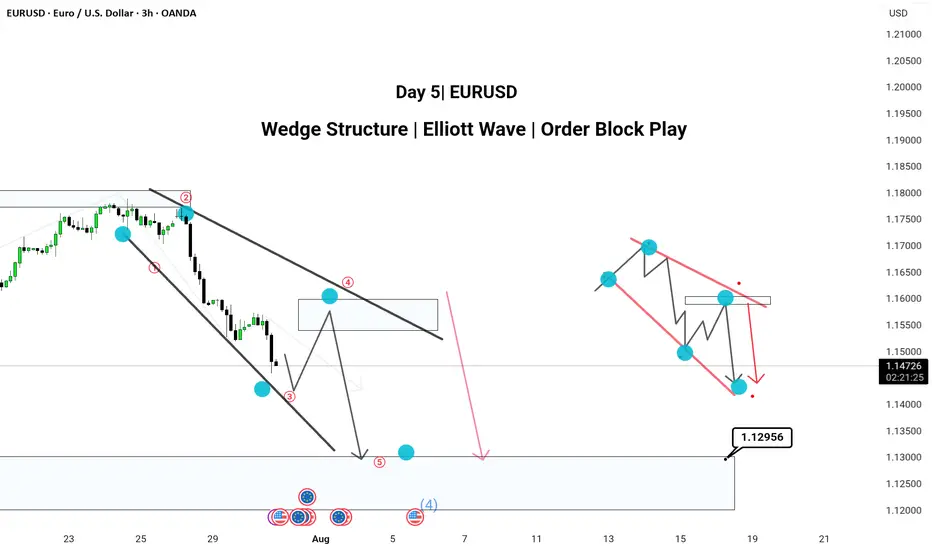
Pattern: Wedge Structure | Elliott Wave | Order Block PlayHere’s a powerful and professional description you can use when publishing this chart on TradingView:
---
🔻 Day 4 | EUR/USD Analysis 🔻
Chart Type: 3H Timeframe
---
📌 Chart Breakdown:
EUR/USD is respecting a textbook XABCD wedge pattern with clean Elliott Wave structure forming inside.
We’ve marked 5 key waves (1–5) completing within a falling wedge, aligning with a 50–60% retracement (Golden Zone) between point A and D.
🧠 Most traders miss the Golden Zone, but it’s often the clearest sign of upcoming trend continuation. Here, that continuation is bearish.
---
✅ 3H Confluence Factors:
Wedge forming within a larger downtrend
Multiple Break of Structures (BOS) confirming bearish momentum
Price targeting 1.12956 zone (mapped order block)
Elliott Wave fractals confirmed within structure
Hidden supply zone respected at Wave 4
---
📉 Expecting:
Retracement to supply → drop toward demand zone near 1.12956
---
📎 Strategy Insight:
SMC + Elliott Wave + Multi-timeframe path tool mapping gives us high confluence to expect continuation into the demand area.
💬 Comment below your views —
Do you also trade Wedges with Elliott Wave confirmation?
#EURUSD #WedgePattern #ElliottWave #SmartMoneyConcepts #OrderBlock #TechnicalAnalysis #TradingView #ForexIndia
---
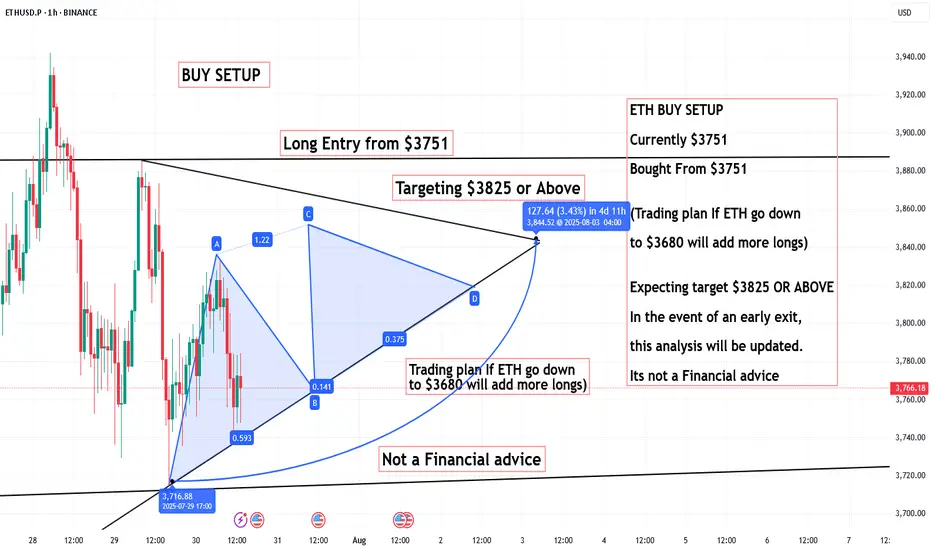
ETH BUY SETUP, Bought From $3751ETH BUY SETUP
Currently $3751
Bought From $3751
(Trading plan If ETH go down ,
to $3680 will add more longs)
Expecting target $3825 OR ABOVE
In the event of an early exit,
this analysis will be updated.
Its not a Financial advice
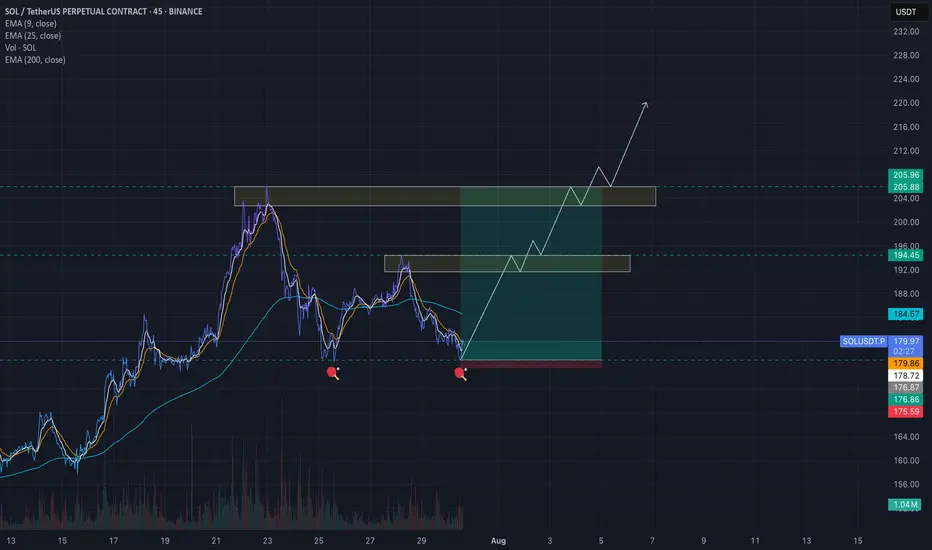
SOLANASolana showing a great bounce and strong buy back with an active escalation. Expecting to hit $200 and above this days. IMHO.
NFA - DYOR
How to Trade the Commitment of Traders Report Part 3Hey Traders so today in part 3 final video will explain how to use this data for trend following and as contrarian style.
Enjoy!
Hope This Helps Your Trading 😃
Clifford

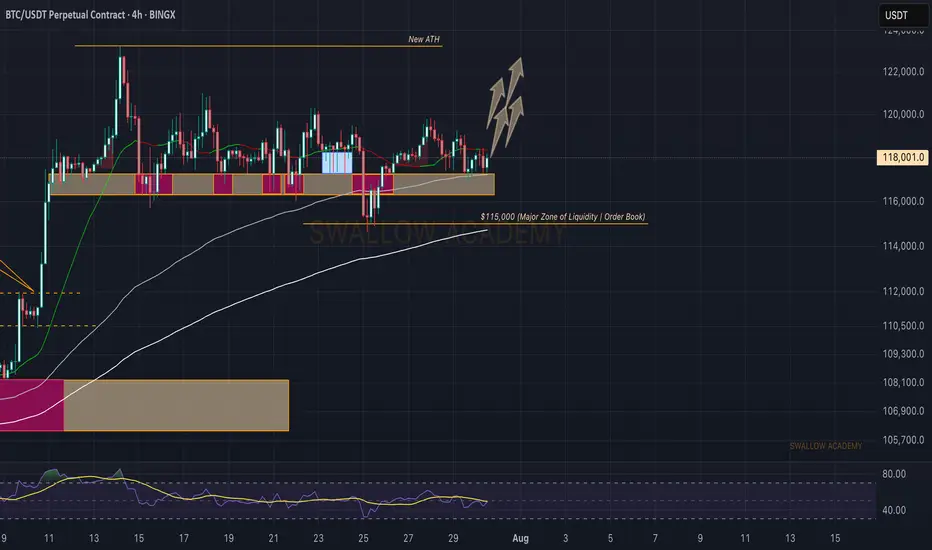
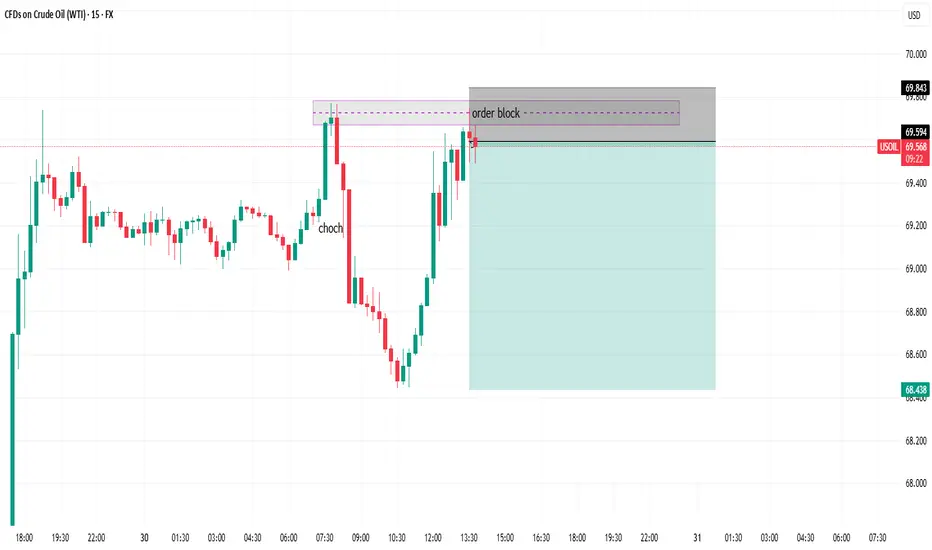
Bitcoin (BTC): Still Above Local SupportIt's been a choppy week so far but BTC is still above the local support zone, which means we are still bullish and the bullish sentiment has not disappeared (for now, at least).
We wait for and mostly keep an eye on that middle line of BB (Bollinger Bands) for now. The order book is our friend currently as well with all those liquidity hunts taking place!
Swallow Academy
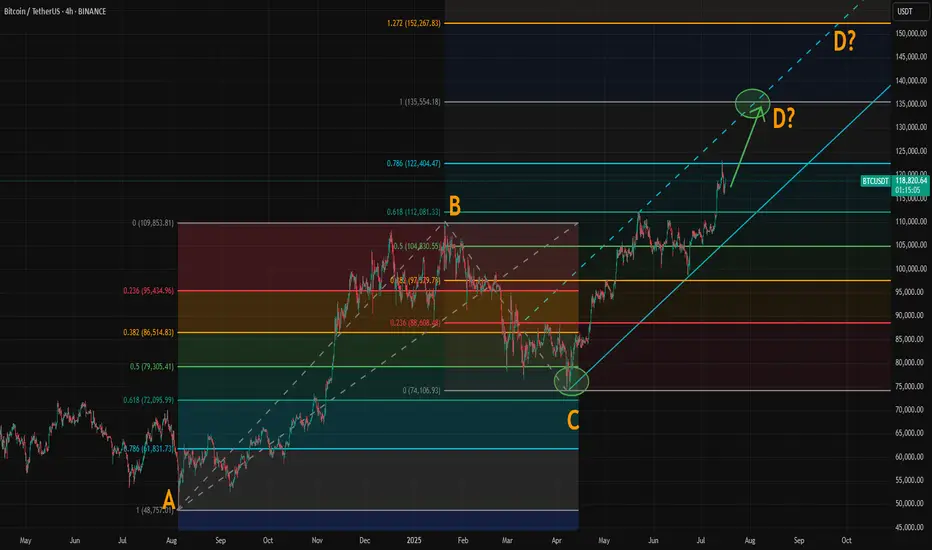
Where Could Bitcoin Make Its Cycle Top? Model and ABCD AlignedWith the breakout above resistance around 110,000, Bitcoin’s rally appears to be back on track. If you've been following our crypto analysis, either here or on our website, you’ll know our target range for this bull cycle is between 135,000 and 150,000, with the top of the range possibly extending further depending on the strength of the final wave.
Now, a possible ABCD pattern is forming, with point D potentially landing at either 135,000 or 150,000. A coincidence? Maybe, maybe not.
How Did We Arrive at the 135K–150K Target?
We based this range on historical halving cycle returns:
Halving Year - Return to Cycle Top
2012 - 9,076%
2016 - 2,122% (↓ 4.27x)
2020 - 541% (↓ 3.92x)
Two things stand out:
Each cycle has shown diminishing returns.
The rate of decline appears roughly consistent, dropping by around 4x each time—but slightly less with each cycle.
So depending on the multiplier used:
If returns fall by 4.27x again → target: 135K
If reduced by 4x → target: 140K
If reduced by 3.92x → target: 142K
If the rate of reduction itself slows (difference of 0.35 between 4.27 and 3.92) → target: 150K
While the sample size is too small, we believe the model holds reasonable logic with fundamental backing from various metrics.
The chart now shows a possible ABCD pattern:
If it becomes a classic AB = CD structure, point D could form near 135K.
If it becomes an extended ABCD (with CD = AB × 1.272), then point D could reach just above 150K.
These technical targets align closely with our halving model projections, increasing our confidence in the 135K–150K range as a likely top zone for this cycle.
Also, please check our earlier post for possible altseason start. A correlation between BTC/ETH and Gold/Silver might give some tips about possible Ether surge.
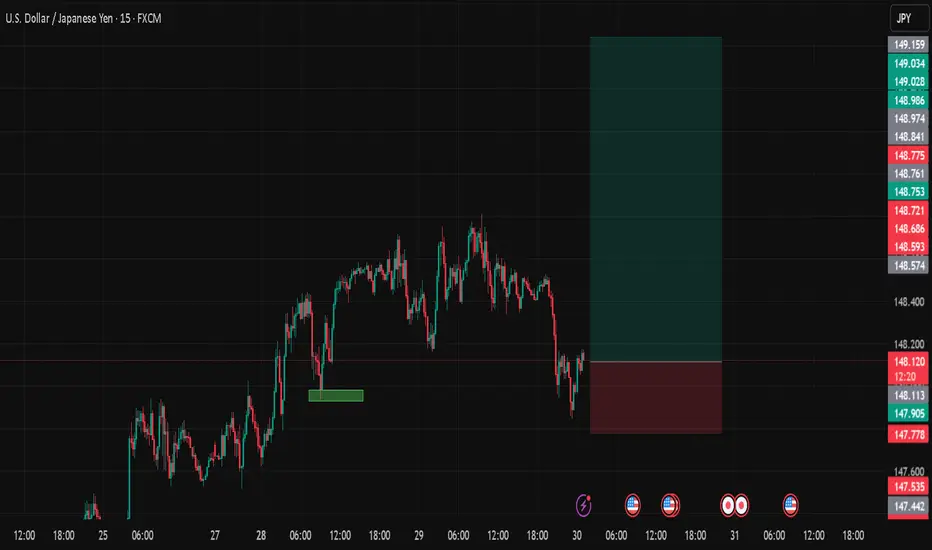
USDJPYDate:
July 30,2025
Session:
Asia and Sydney Session
Pair:
USDJPY
Bias:
Long
Liquid from Mondays New york open swept now price wants to follow trend
Entry: 148.108
Stop Loss: 147.778
Target: 149.640
RR: 4.57
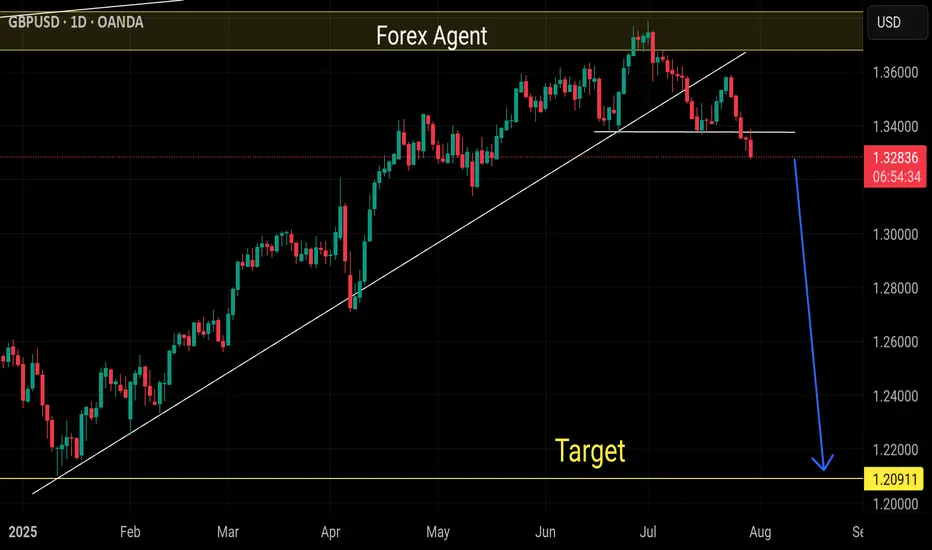
Sell gbpusdOur last selling idea already running 500+ pips in sell
Now previous weak resistance also breaks
In my view its long term selling minimum 800 more pips can be sell
Monthly sell structure and overbought
Market now just on the way of bearing correction
Idex lowcap altcoinIdex undervalued altcoin
Idex went from $0.44 to $0.25 in bearish movement.
Currently trading at $0.28 and potential to break through falling wedge.
Next resistance $0.32 and $0.36.
Rsi = bearish to bullish
Stoch Rsi = avg bullish
Macd = bullish
#crypto #cryptocurrency #altcoins

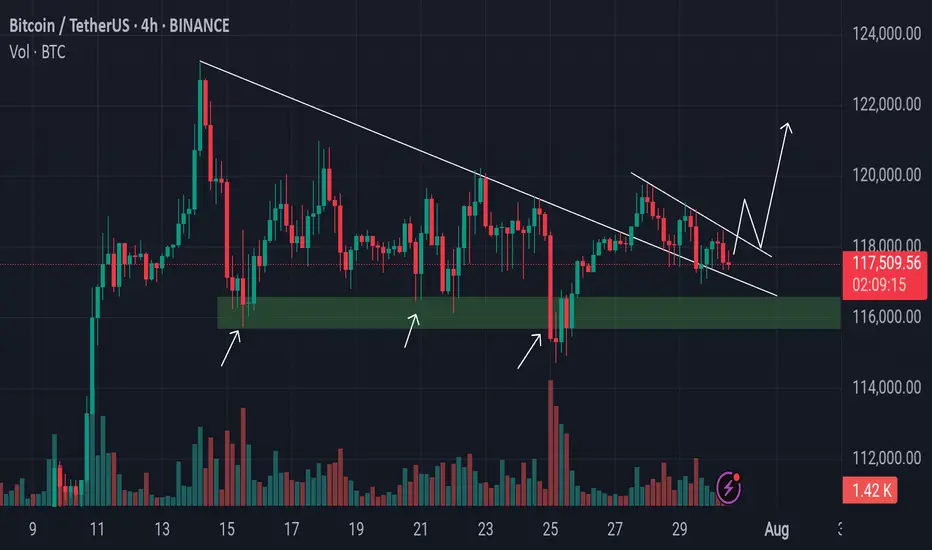
Bitcoin Retests Broken Trendline Minor Resistance in Focus!Bitcoin has recently taken support from the lower levels and moved upward, successfully breaking above a key trendline resistance. Currently, the market appears to be forming another minor trendline resistance on the short-term chart. Interestingly, the previous trendline that was broken is now acting as a support zone, indicating a potential shift in market structure.
If the price manages to break this newly developing minor trendline resistance, we may expect a possible retest of that level. Should the retest hold, it could provide a strong bullish signal, allowing Bitcoin to continue its upward movement toward higher liquidity zones or resistance levels.
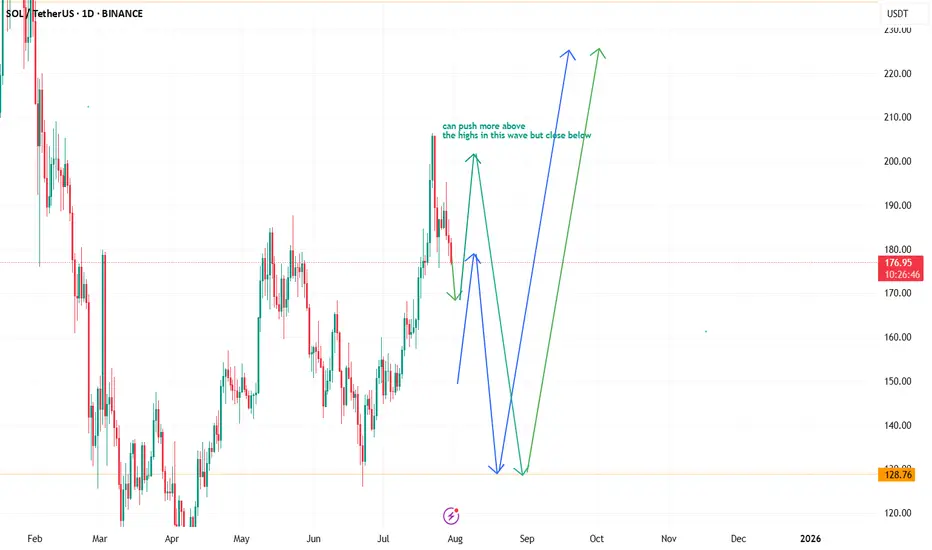
SOL ideas, which one you think gonna play? green or blue?SOL and crypto likely in the last corrective wave before going much higher
Scalping Sell Setup – Trendline Break & Pullback Confirmation📉 Scalping Sell Setup – Trendline Break & Pullback Confirmation
Posted earlier – trade progressing as planned.
As shared in the previous chart, a Sell scalp position was executed based on the trendline break followed by a pullback retest.
Three Take-Profit levels were marked and the price is moving in line with the forecast. ✅
🟢 TP1 Hit
🟢 TP2 Reached
🔵 TP3 in progress
📌 The setup remains valid, and as long as structure holds below the retested trendline, the bearish bias continues.
We will monitor price action near TP3 zone for final exit or trailing stop update.
> Analysis worked perfectly so far – let’s see if TP3 gets cleared soon. 🔍💥
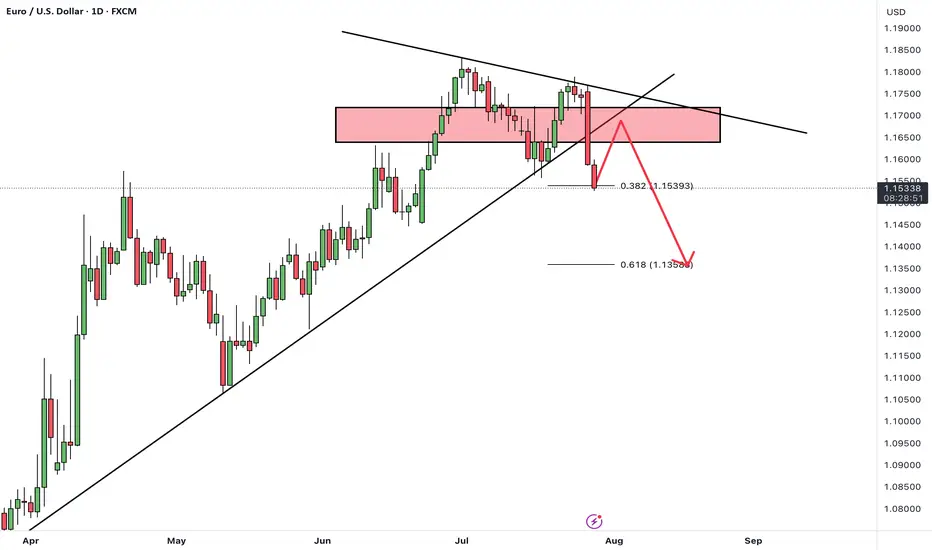
EURUSDHello Traders! 👋
What are your thoughts on EURUSD?
EUR/USD kicked off the week with a sharp drop of nearly 200 pips, driven by renewed concerns over U.S. tariff policies. This strong bearish momentum signals intensified selling pressure across the board.
The pair is now approaching a support zone, which has previously triggered bullish reactions.
However, given the current strong bearish sentiment, there is a real risk this support may not hold.
Our bias remains bearish overall.
If the pair finds temporary support at this level, a short-term corrective bounce is possible.
But ultimately, we expect a continuation of the downtrend toward lower support levels after the correction completes.
Can this support zone stop the bleeding, or is more downside coming? Let us know your thoughts! 👇
Don’t forget to like and share your thoughts in the comments! ❤️
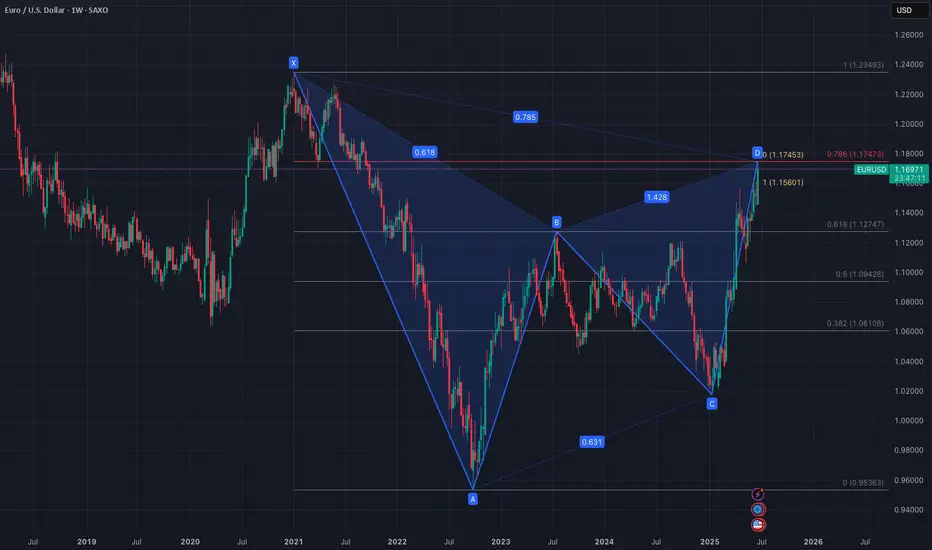
EURUSD - perfect Gartley Pattern?Technical Analysis - no fundamentals taken into account.
EURUSD proce has just completed a perfect Gartley Pattern. If respected, proce will come down to 1.23748 at least. Potentially lower.
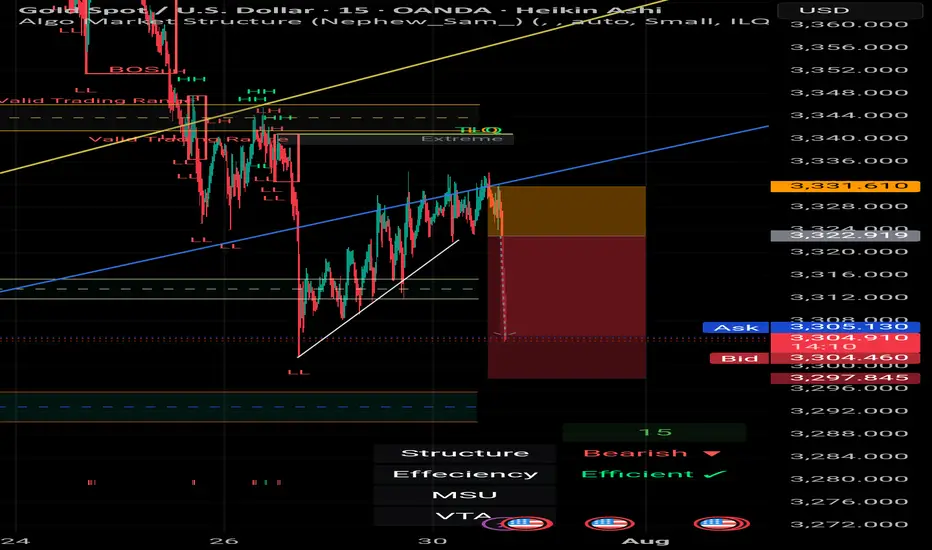
Gold’s Liquidity Hunt Eyes on Bullish FVG Reaction!Gold Analysis – NY Session Outlook
During the New York session, gold created equal highs near recent swing highs, indicating that upside liquidity remains uncollected. Currently, the market is pulling back, targeting liquidity resting below the trendline, along with internal liquidity levels beneath.
If gold continues to move downward and taps into the marked bullish Fair Value Gap (FVG), monitor that zone for any signs of bullish confirmation. If confirmed, there is potential for a further upward move toward the equal highs and beyond, aiming for external liquidity.
Always Do Your Own Research (DYOR).


Gold: ADP, Fed & Key Resistance Gold has been range-bound today—let’s focus on the impact of the ADP data and Fed rate decision ⚠️.
Key resistance lies around 3345-3350 📍: a breakout could fuel further upside 📈, while a rejection may trigger an oscillating pullback 📉
⚡️⚡️⚡️ XAUUSD ⚡️⚡️⚡️
🚀 Buy@ 3325
🚀 TP 3333 - 3339 -3344
Daily updates bring you precise trading signals 📊 When you hit a snag in trading, these signals stand as your trustworthy compass 🧭 Don’t hesitate to take a look—sincerely hoping they’ll be a huge help to you 🌟 👇

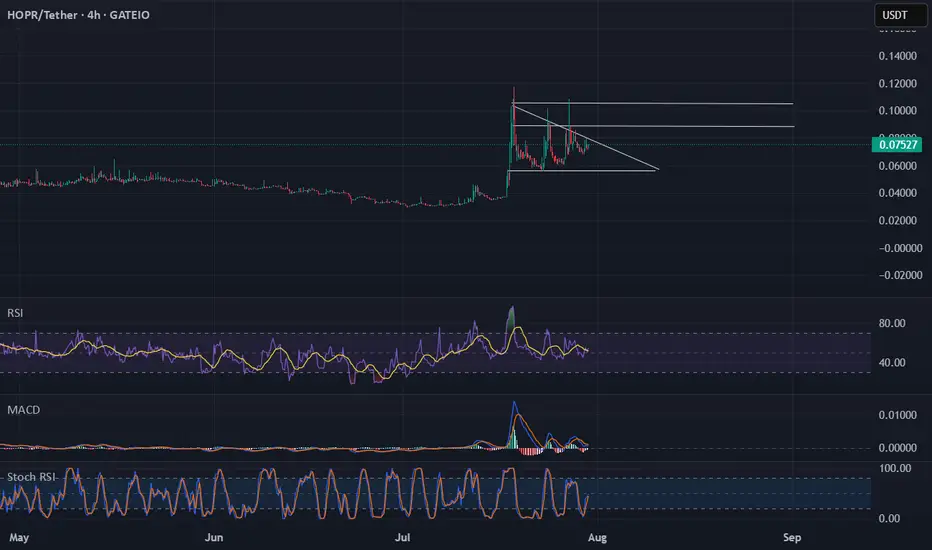
HOPR to double in value?HOPR to double in value?
Hopr had bearish movement due a jump of price from $0.033 to $0.11.
With higher lows bulls might be in favour of buying on the current dip.
Next resistances $0.86 and $0.11.
Rsi = Bullish
Stoch rsi = Bullish
Macd = Bullish
#crypto #cryptocurrency #altcoins
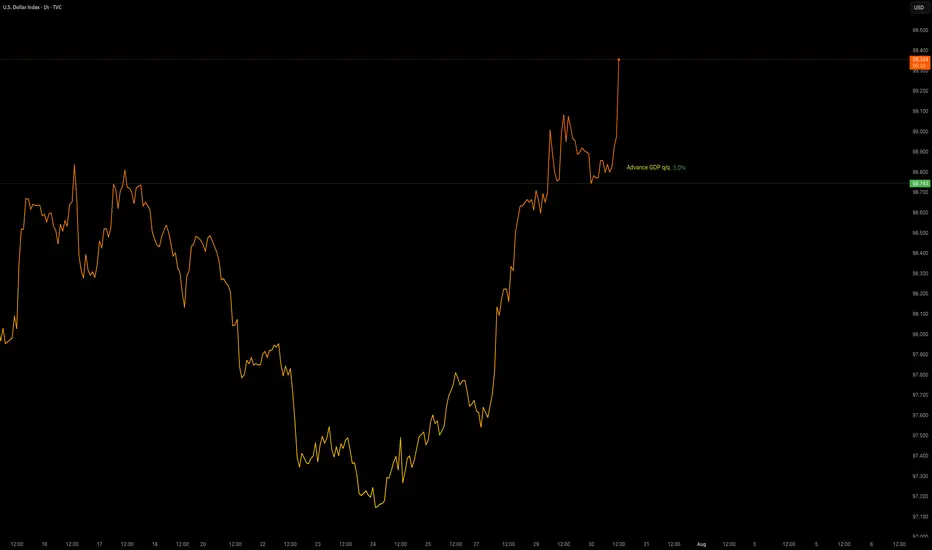
Data Release - Advance GDP q/q (3.0%)Jul 30 2025: ADVANCE GDP q/q (3.0%)
OANDA:XAUUSD sees some downside pressure with positive GDP data.
TVC:DXY gaining strength.
Volatility is increased. This data will be used with Interest Rate Decision later in the day to provide a XAUUSD insight.