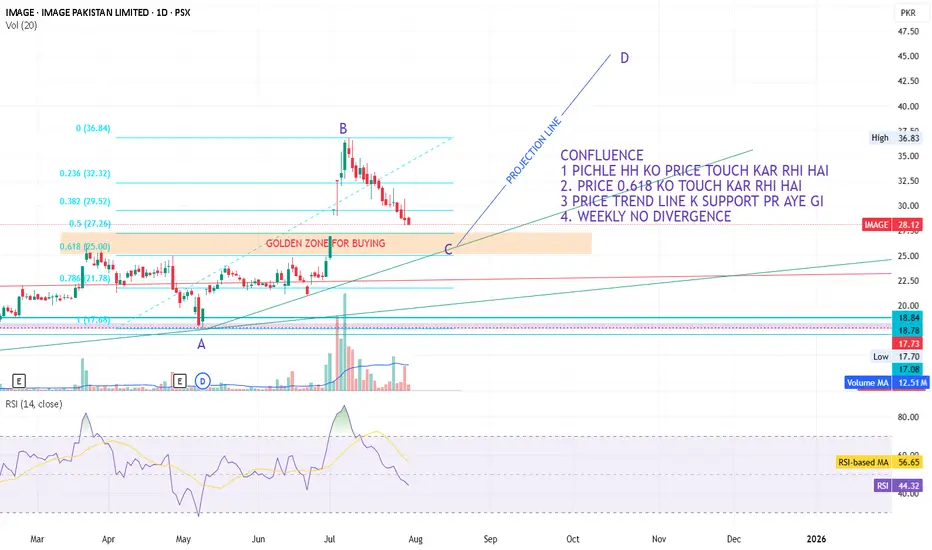
IMAGE PAKISTAN LONG TRADE IDEAImage pakistan Swing trade plan ..
Multiple Confluence Target with one price
Harmonic Patterns
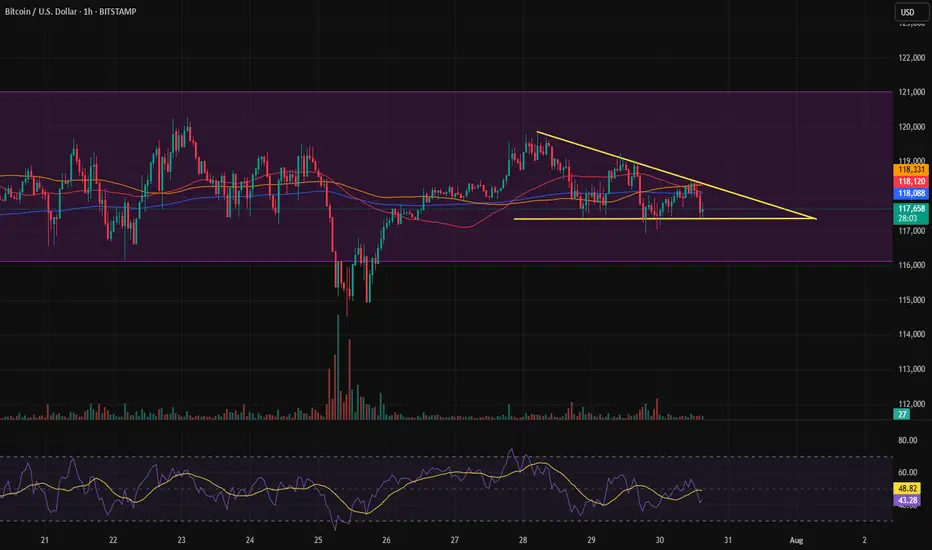
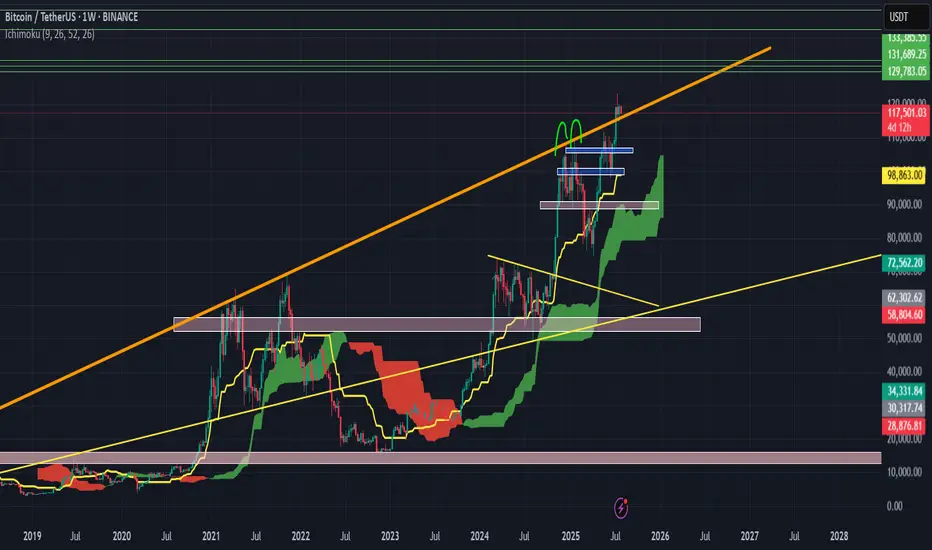
Bitcoin is in a coma.I see a larger range where Bitcoin is showing compression and indecision.
Whenever it breaks out of this compression, if it breaks to the upside, the first target would be the top of the channel, with hopes of a channel breakout.
If it breaks to the downside, the first target would be the bottom of the channel, with hopes of a breakdown.
In either case, we only enter with a confirmed trigger.
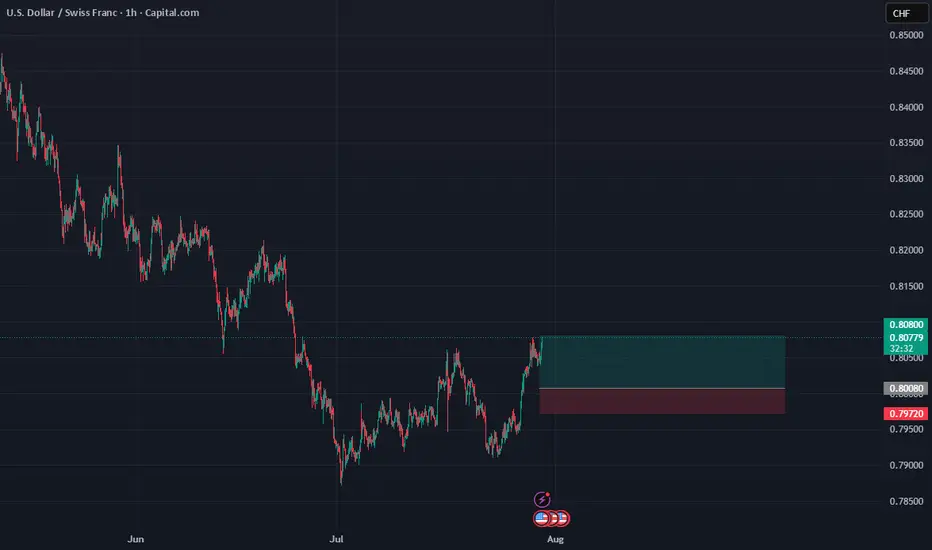
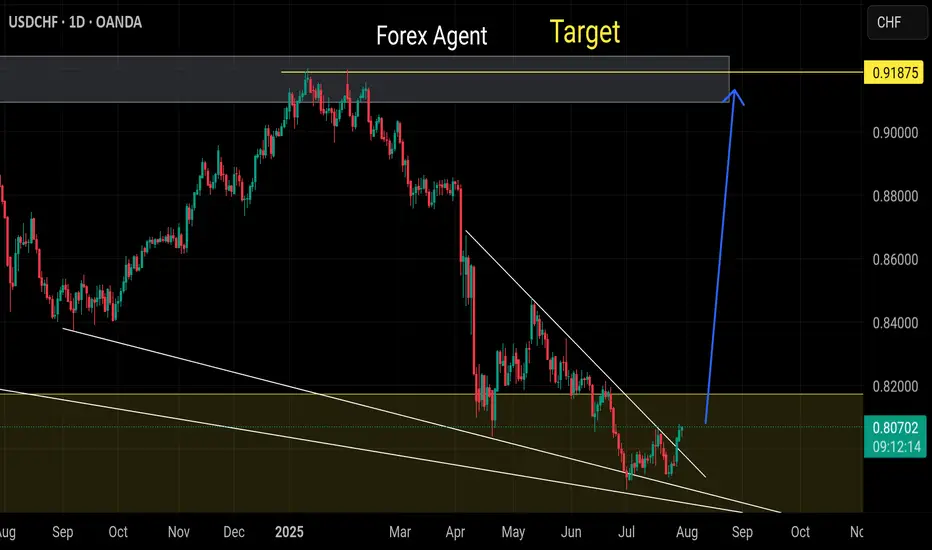
USD/CHFUSD/CHF Overview:
After a downward correction in recent weeks, the USD/CHF pair appears to be finding some support around the 0.80000 - 0.79800 levels. We are observing signs of price consolidation, which could indicate a potential bullish bounce.
Trade Details (Pending Order):
Order Type: Buy Limit
Entry Point: 0.80080
This point was chosen based on a previous support area and the price's attempt to consolidate above it.
Stop Loss (SL): 0.79720
The stop loss is located below a clear local low and below the psychological support level of 0.80000 to provide adequate protection.
Take Profit (TP): 0.80800
This level targets a retest of a previous resistance area, or as a conservative target for the first bullish bounce.
Risk Management:
Distance to Stop Loss: 36 pips (0.80080 - 0.79720)
Distance to Take Profit: 72 pips (0.80800 - 0.80080)
Risk-to-Reward Ratio (R:R): 1:2
This ratio is considered excellent and provides a good opportunity for profit compared to the potential risk.
Additional Considerations:
Traders are monitoring upcoming economic data from the United States and Switzerland.
A decisive break above 0.79720 could invalidate this idea, while a break above 0.80800 could open the door to further upside.
Disclaimer:
This is merely an analytical trading idea and is not intended as investment advice. Please manage your risk consciously and conduct your own research before making any trading decisions.
Nothing Changed, Still BullishDO NOT FORGET USING A STOP LOSS
Warning:
This is just a suggestion and we do not guarantee profits. We advise you analyze the chart before opening any position.
I hope you are always profitable
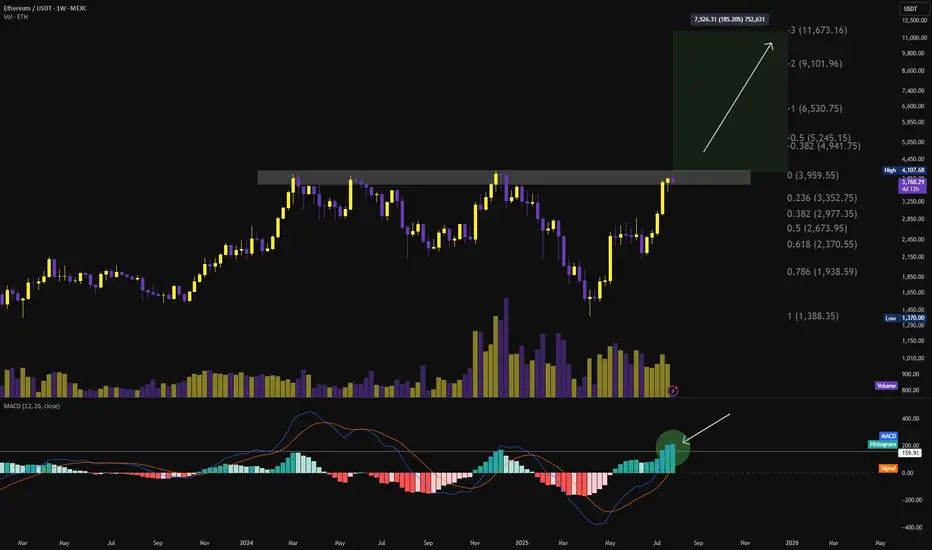
$ETH BREAKOUT FROM $4K IS A MATTER OF TIMEMomentum is in our favour — and this time, it's technically undeniable.
📈 MACD is at the highest levels it's ever been while testing $4K — signaling explosive breakout potential.
Weekly close above $3,959.55 confirms a breakout of a 28-month-long horizontal structure.
Once that’s in — it’s price discovery mode.
🎯 Targets:
→ $5,245 (0.5 Fib)
→ $6,530 (-1 Fib)
→ $9,101 (-2 Fib)
→ $11,673 (-3 Fib)
🟥 Invalidation:
→ Weekly close below $3,352
→ Bearish MACD crossover
Volume rising, structure clean, and momentum fully aligned.
This is the perfect storm for a macro leg to $10K+.
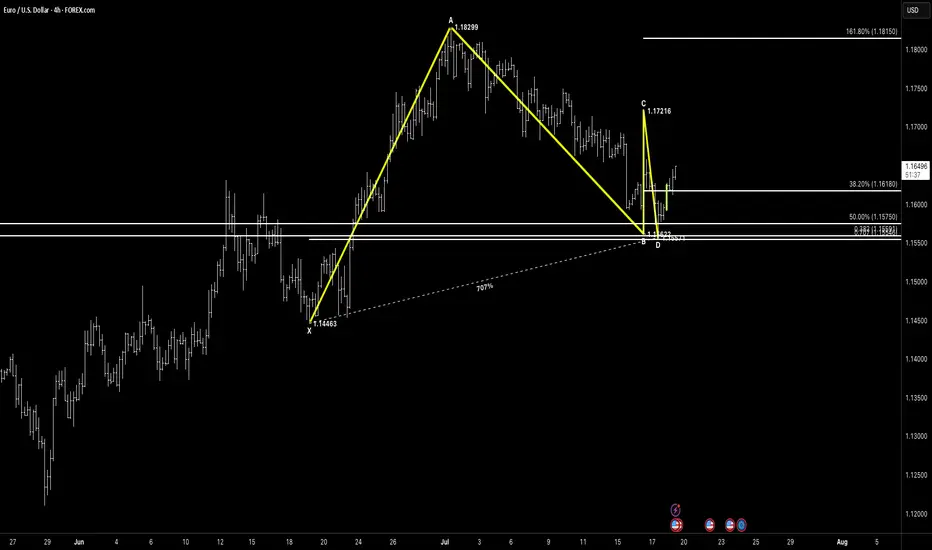
EURUSD / Euro – U.S. Dollar (4H) – ABC Bullish Structure EURUSD / Euro – U.S. Dollar (4H) – ABC Bullish Structure with Double Bottom Base
Pattern Overview:
Pattern Type: ABC Bullish + Corrective Double Bottom
Asset: EURUSD
Timeframe: 4H
Trade Type: Bullish Bias – Monitoring for continuation after rejection from cluster support
🔎 Key Levels
XA: 1.14663 → 1.18299
AB: 1.18299 → 1.16292
BC: 1.16292 → 1.17216
CD: Completion just under 1.15621 cluster
Major Fib Cluster: 0.707% XA, 0.886 AB, 50% CD, Prior Horizontal Support Zone
📐 Fibonacci Extensions & Key Ratios
38.2% retracement: 1.16180
50.0% retracement: 1.15750
161.8% extension: 1.18150
💡 Price Action & Setup
Price has completed an ABC corrective leg, forming a clean double bottom at the D point, hovering over the fib-rich support cluster.
The rejection candle shows buyer interest, and the recent higher low structure implies potential for continuation, especially if price reclaims and holds above 1.1650 short-term structure.
🧠 Market Sentiment
DXY easing slightly after strong dollar dominance
EUR macro calendar quiet – technicals may dominate next moves
Strong base = smart money accumulation likely underway
📊 Next Potential Movement
Break above 1.1675 opens path toward 1.1720, then possibly 1.1815
If 1.1575 cluster fails → risk of full XA retracement
🛡 Risk Management
Aggressive long entries already in play
Conservative entries should wait for higher low confirmation above 1.1650
Protective stop: under 1.1550 zone
📌 Conclusion
This is a bullish structure with a corrective double bottom base sitting right inside a dense confluence zone. Price is compressing between key fibs – expect a directional move next week. Keep your eye on the 1.1675 breakout or 1.1570 loss for next major decision.
“In the densest zones of indecision, patterns and confluence provide the clearest map.”
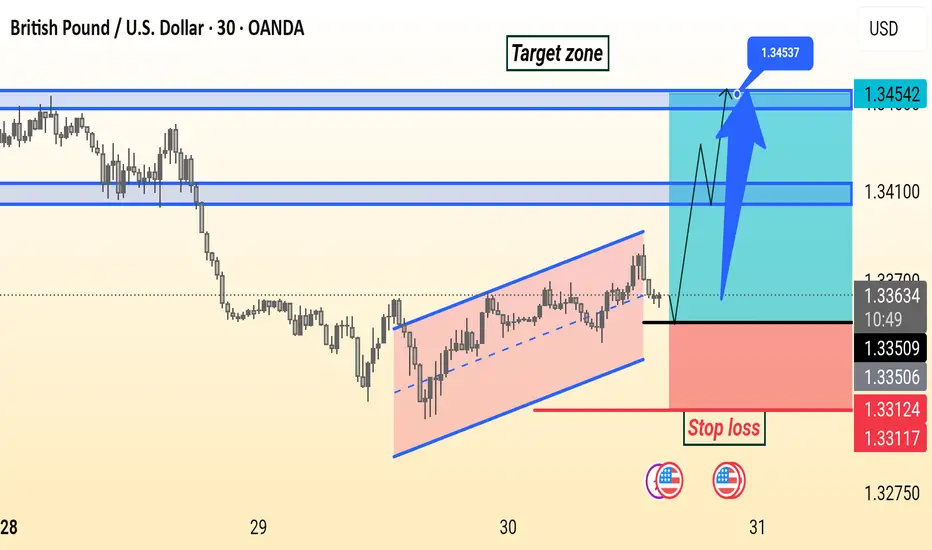
GBPUSD Setup GBP/USD is forming a bullish channel on the 30-minute chart. Price is expected to break above resistance near 1.3365, targeting the 1.3455 zone. Stop loss is set below the channel at 1.3312.
Buy usdchf Our last buying idea already running 150+ pips
In our view more buying expected
Almost totally trend changed as dollar gonna strong among all Cross pairs
Inner down trend breaks
Monthly still oversold
EURUSDEUR/USD Exchange Rate
Current Rate: About 1.1525
Government Bond Yields
U.S. 10-Year Treasury Yield: 4.328%
Eurozone 10-Year Government Bond Yield: Last reported at 2.686%
Economic Data Reports for Today
U.S. Data:
1:15pm
USD
ADP Non-Farm Employment Change
82K -33K
1:30pm
USD
Advance GDP q/q
2.4% -0.5%
USD
Advance GDP Price Index q/q
2.3% 3.8%
3:00pm
USD
Pending Home Sales m/m
0.3% 1.8%
3:30pm
CAD
BOC Press Conference
USD
Crude Oil Inventories
-3.2M
7:00pm
USD
Federal Funds Rate
4.50% 4.50%
USD
FOMC Statement
7:30pm
USD
FOMC Press Conference
Market Focus Today: The Federal Reserve announces its policy decision.
Eurozone Data:
GDP Growth (Q2): Eurostat reports second-quarter growth at 0.1% quarter-on-quarter (QoQ) and 1.4% year-on-year (YoY). Germany and Italy contracted by 0.1% QoQ, France rose 0.3%, and Spain outperformed at 0.7%.
Outlook: The Eurozone economy faces headwinds from new U.S. tariffs and tepid industrial output, though Q2 was somewhat better than feared.
Current Interest Rates
Area Main Rate (July 2025) Policy Outlook
U.S. 4.25% – 4.50% Fed expected to hold steady
EU 2.15% (main refi rate) ECB in data-dependent pause
2.00% (deposit rate)
U.S.: The Federal Reserve is widely expected to hold rates in the 4.25%–4.50% range at today's FOMC meeting, reflecting a cautious approach in light of current growth and inflation figures.
Eurozone: The ECB last held its main refinancing rate at 2.15% and the deposit facility at 2.00% as of the July 24, 2025 meeting, emphasizing a meeting-by-meeting, data-driven stance.
Key Takeaways
EUR/USD is subdued just above 1.15 as the euro weakens on modest Eurozone growth and broad dollar strength ahead of the Fed.
10-year yields remain elevated in both regions, reflecting stable but cautious outlooks.
Today’s U.S. and ECB meetings/data are critical: Markets are watching for central bank reactions to new economic data and the ongoing effects of tariffs and global uncertainty.
This overview captures the most significant developments relevant to currency, rates, bonds, and economic trends for July 30, 2025.
#EURUSD #DOLLAR #EURO

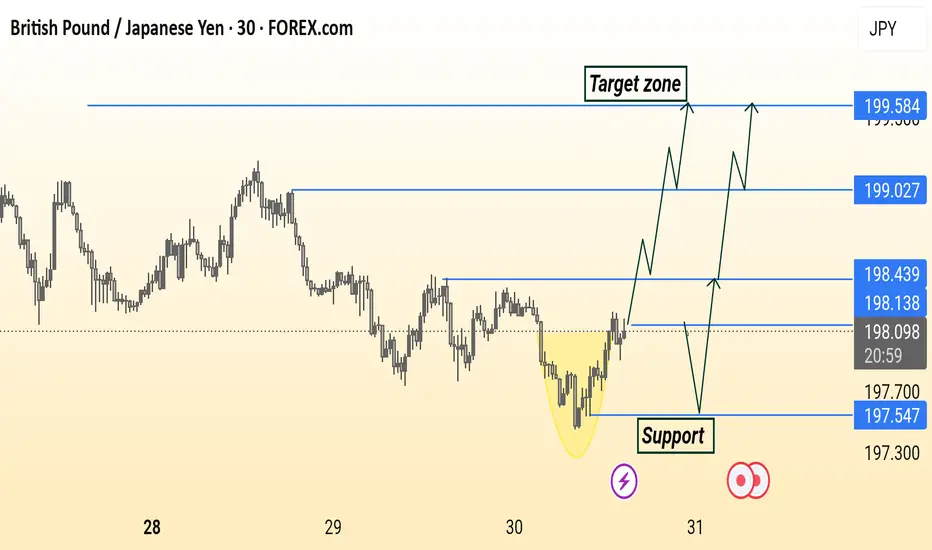
GBP/JPY Analysis is Ready Read The Captions GBP/JPY 30-minute chart shows a potential bullish reversal from a rounded bottom pattern. Price is approaching support around 198.13–197.54, with multiple possible bullish scenarios targeting resistance levels at 198.43, 199.03, and 199.58. The highlighted “Target zone” suggests a continuation if price breaks and holds above key resistance.
MSFT & META Daily Trade SetupsIn this update we review the recent price action in Microsoft & Meta and identify the next high-probability trading opportunities and price objectives to target. To review today's video analysis clcik here!

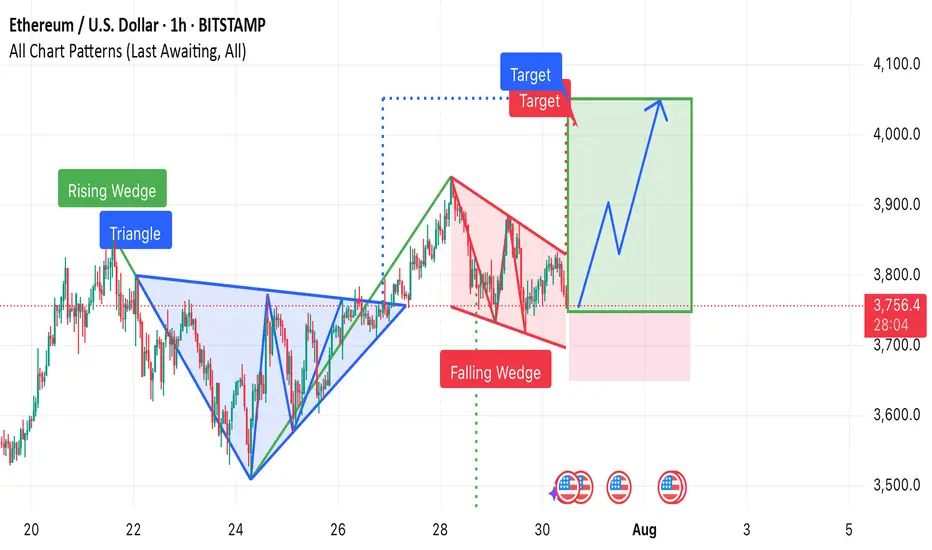
Bullish Projection • Target Area: ~$4,080 – $4,100
• Current Price: ~$3,761
• Pattern Basis: Falling wedge breakout with expected move toward the target range.
• Risk Area: Highlighted in red below current price zone (~$3,700) indicating a stop-loss zone.
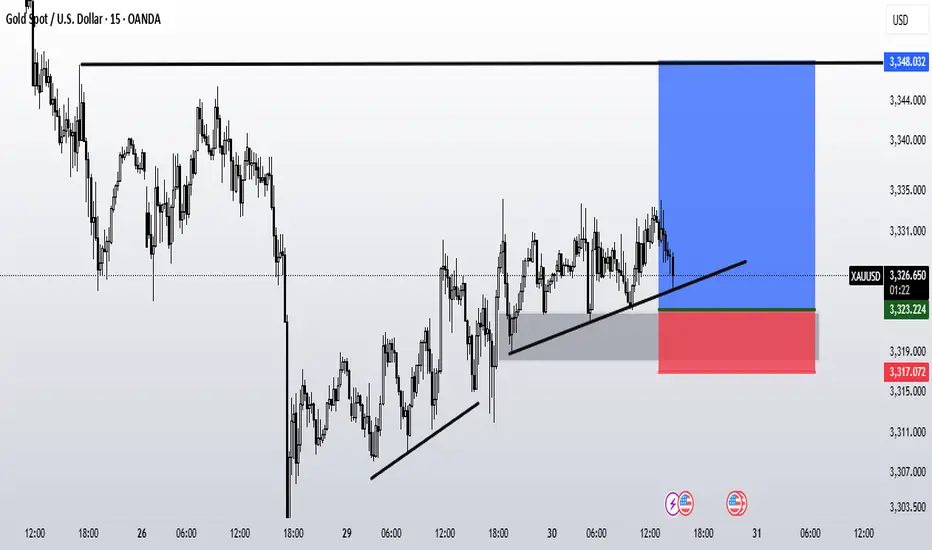
XAUUSD m15 : Long Position R.R 4The price reacted positively after touching the bullish daily and 4-hour order blocks, forming a 15-minute uptrend that continued its bullish movement by repeatedly taking liquidity.
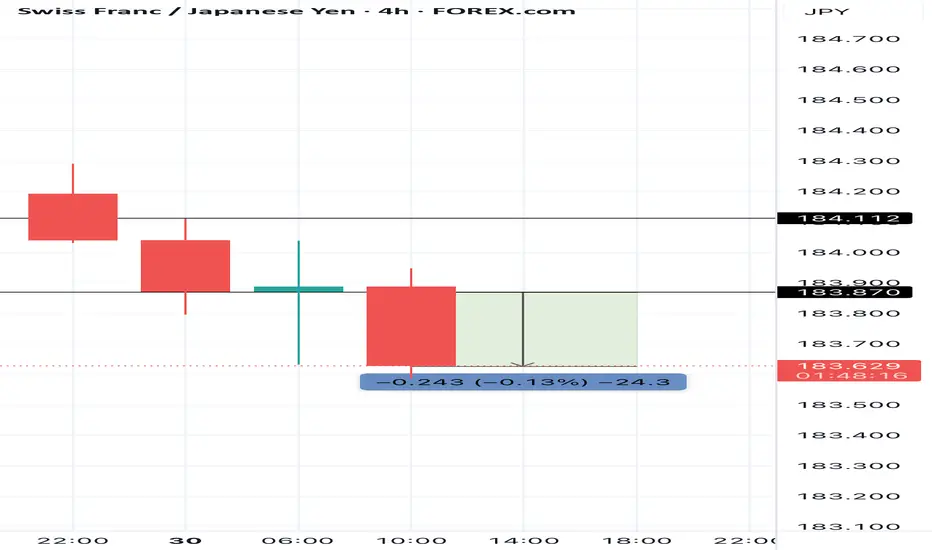
Congratulations CHFJPY profit hit Two scalping positions today all hit take profit we are good for today
XAUUSD potential for a further decline? Fundamental perspective:
Gold hovered near $3,330, staying close to a three-week low as easing trade tensions dampened safe-haven demand. The US–EU tariff agreement and signs of progress in other trade talks have calmed fears of broader conflict, reducing gold’s geopolitical bid.
The focus now turns to the Fed’s policy decision. While interest rates are expected to remain unchanged, markets will scrutinize Powell’s remarks for any dovish signals ahead of September. Mixed US data, including softer job openings but an uptick in US consumer confidence, adds to the uncertainty, keeping gold traders on edge.
Technical Perspective:
XAUUSD hovers between the 3200-3350 range following a bearish breakout of the ascending trend line and channel. An extension of its decline below the 3350 resistance and breakout zone could prompt a retest of the support at 3200, which coincides with the Fibonacci confluence area. Conversely, a break above 3350 with bullish momentum and higher swings shown on the lower timeframes could pave the way for further gains toward the swing high at 3450.
By Li Xing Gan, Financial Markets Strategist Consultant to Exness

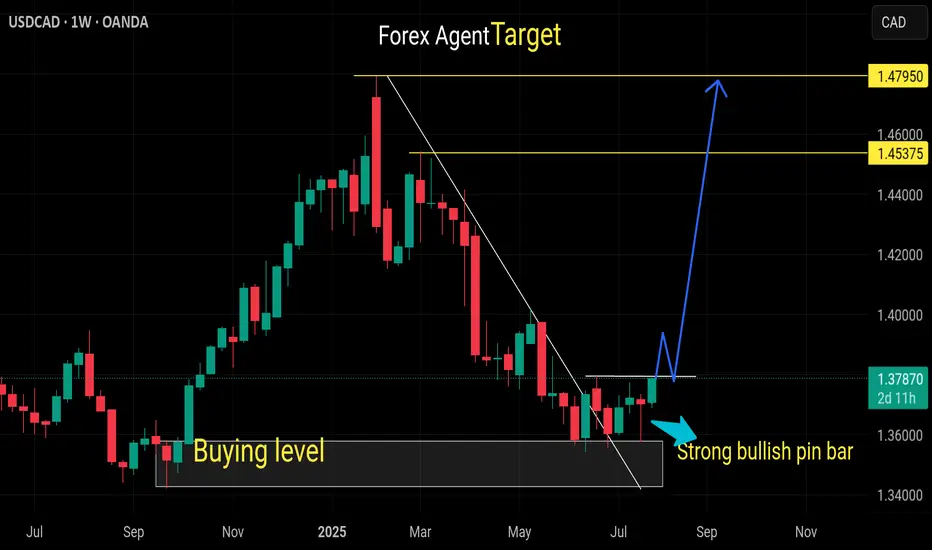
Buy usdcadOur last buying idea already running 100+ pips in buy
In my view usdcad ready to break this resistance
It can be today and next month candel
Weekly and monthly already oversold pair
WTI OIL The federal funds rate is the interest rate at which U.S. banks and credit unions lend their excess reserve balances to other banks overnight, usually on an uncollateralized basis. This rate is set as a target range by the Federal Open Market Committee (FOMC), which is the policymaking arm of the Federal Reserve. The current target range as of July 2025 is approximately 4.25% to 4.5%.
The federal funds rate is a key benchmark that influences broader interest rates across the economy, including loans, credit cards, and mortgages. When the Fed changes this rate, it indirectly affects borrowing costs for consumers and businesses. For example, increasing the rate makes borrowing more expensive and tends to slow down economic activity to control inflation, while lowering the rate stimulates growth by making credit cheaper.
The Fed adjusts this rate based on economic conditions aiming to maintain stable prices and maximum employment. It is a vital tool of U.S. monetary policy, impacting economic growth, inflation, and financial markets.
In summary:
It is the overnight lending rate between banks for reserve balances.
It is set as a target range by the Federal Reserve's FOMC.
It influences many other interest rates in the economy.
Current range (July 2025) is about 4.25% to 4.5%.
1. ADP Non-Farm Employment Change (Forecast: +82K, Previous: -33K)
Above Forecast:
If ADP employment is much stronger than expected, the Fed would see this as a sign of ongoing labor market resilience. Robust job growth would support consumer spending, potentially keep wage pressures elevated, and could make the Fed less likely to ease policy soon. This reinforces the case for holding rates steady or staying data-dependent on further cuts.
Below Forecast or Negative:
If ADP jobs gain falls short or is negative again, the Fed may interpret it as a weakening labor market, raising recession risk and reducing inflationary wage pressures. This outcome could increase the chances of a future rate cut or prompt a more dovish tone, provided it aligns with other softening indicators.
2. Advance GDP q/q (Forecast: +2.4%, Previous: -0.5%)
Above Forecast:
A GDP print above 2.4% signals surprisingly strong economic growth and likely sustains the Fed’s view that the U.S. economy is avoiding recession. The Fed may delay rate cuts or take a more cautious approach, as stronger growth can support higher inflation or at least reduce the urgency for support.
Below Forecast or Negative:
Weak GDP—especially if close to zero or negative—would signal that the economy remains at risk of stagnation or recession. The Fed may then pivot to a more dovish stance, become more willing to cut rates, or accelerate discussions on easing to avoid a downturn.
3. Advance GDP Price Index q/q (Forecast: 2.3%, Previous: 3.8%)
Above Forecast:
A significantly higher-than-expected GDP Price Index (an inflation measure) points to persistent or resurgent inflationary pressures in the economy. The Fed might see this as a reason to delay cuts or maintain restrictive rates for longer.
Below Forecast:
If the Price Index prints well below 2.3%, it suggests that inflation is cooling faster than anticipated. This outcome could allow the Fed to move toward easing policy if other conditions warrant, as price stability is more clearly in hand.
Bottom Line Table: Data Surprises and Likely Fed Reaction
Data Surprise Fed Outlook/Action
All above forecast Hawkish bias, rate cuts delayed or on hold
All below forecast Dovish bias, higher chances of rate cut
Mixed Data-dependent, further confirmation needed
Summary:
The Fed’s interpretation hinges on how these figures compare to forecasts and to each other. Stronger growth, jobs, and inflation = less rush to cut; weaker numbers = lower rates sooner. If growth or jobs are especially weak or inflation falls sharply, expect more dovish Fed commentary and a greater likelihood of future easing. Conversely, if the data all surprise to the upside, hawkish (rate-hold) messaging is likely to persist.
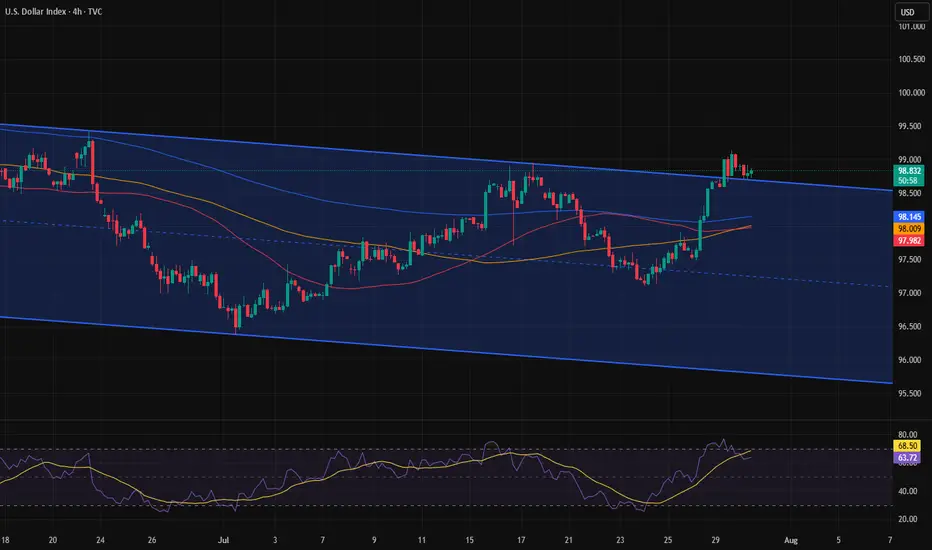
The U.S. Dollar Index (DXY) is a financial benchmark that measures the value of the United States dollar relative to a basket of six major foreign currencies. It provides a weighted average reflecting the dollar's strength or weakness against these currencies. The DXY is widely used by traders, investors, and economists to gauge the overall performance and health of the U.S. dollar on the global stage.
Key Features of the DXY:
Currencies included and their weights:
Euro (EUR) – 57.6%
Japanese Yen (JPY) – 13.6%
British Pound (GBP) – 11.9%
Canadian Dollar (CAD) – 9.1%
Swedish Krona (SEK) – 4.2%
Swiss Franc (CHF) – 3.6%
It was established in 1973 after the collapse of the Bretton Woods system to serve as a dynamic measure of the dollar's value.
The index reflects changes in the exchange rates of theses versus the U.S. dollar, with a higher DXY indicating a stronger dollar.
The DXY influences global trade dynamics, commodity prices (like oil and gold)
#SHAVYFXHUB #USOIL #WTI #OIL

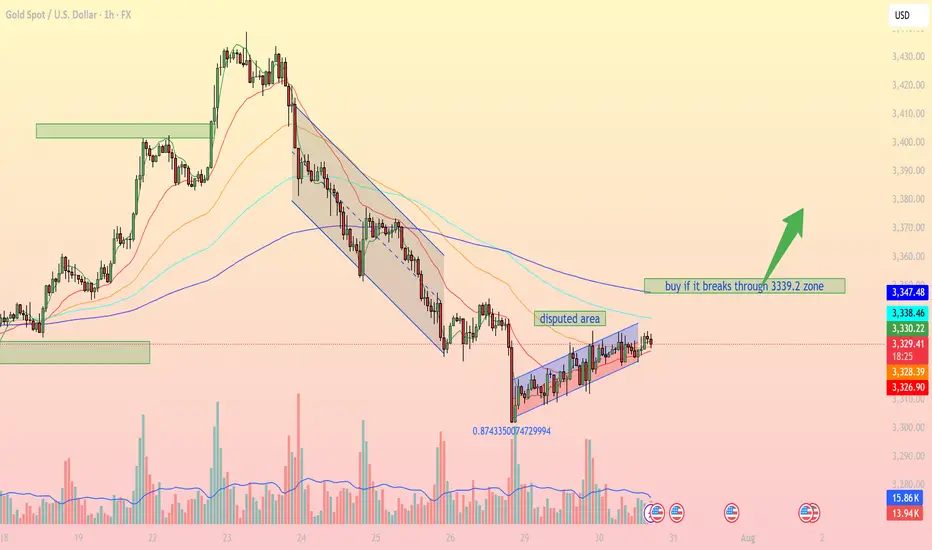
Accumulation pattern awaiting breakout confirmationIntraday Outlook: Accumulation pattern awaiting breakout confirmation
On the 1H timeframe, XAUUSD is forming a clear consolidation pattern within a narrow ascending channel after falling from a prior distribution zone. Buyers are attempting to regain control, but strong resistance remains around the 3,339 – 3,347 USD area.
1. Technical Breakdown:
Trendline & Channel: Price is currently moving inside a small rising channel, indicating a short-term bullish bias, though momentum remains limited.
EMA Dynamics: EMA 20, 50, and 100 are beginning to converge, signaling a potential breakout. A bullish EMA crossover (EMA20 > EMA50) could confirm stronger upward momentum.
Disputed Area: This zone represents heavy indecision between bulls and bears. A clear breakout above or below is needed for directional clarity.
Fibonacci Level: The 0.874 retracement level from the recent low shows strong buyer interest, potentially forming a short-term bottom.
2. Key Support & Resistance Levels:
3,339.2 USD Major resistance – needs to be broken for bullish continuation
3,347.4 USD Next resistance if breakout occurs
3,328.2 USD Immediate support (current price zone)
3,326.7 USD Strong support if price retraces
3. Suggested Trading Strategies:
Scenario 1 – Breakout Buy Strategy:
Entry: Buy if price breaks and closes above 3,339.2 USD on the 1H chart.
Stop Loss: Below 3,328 USD.
Take Profit: First target at 3,347, extended targets at 3,358 and 3,372 USD.
Scenario 2 – Pullback Long Entry:
If price fails to break resistance, consider buying the dip near the 3,326 – 3,328 USD support zone for a better risk-reward setup.
Scenario 3 – Breakdown Sell Setup:
If price breaks below 3,326 USD and exits the channel, a bearish move towards 3,295 – 3,300 USD becomes likely.
Gold is in a key consolidation phase, with the 3,339 USD resistance acting as the decisive breakout zone. Traders should closely monitor price action, volume, and EMA behavior to catch the next directional move.
Follow for more trading strategies like this. Save this post if you find it useful!
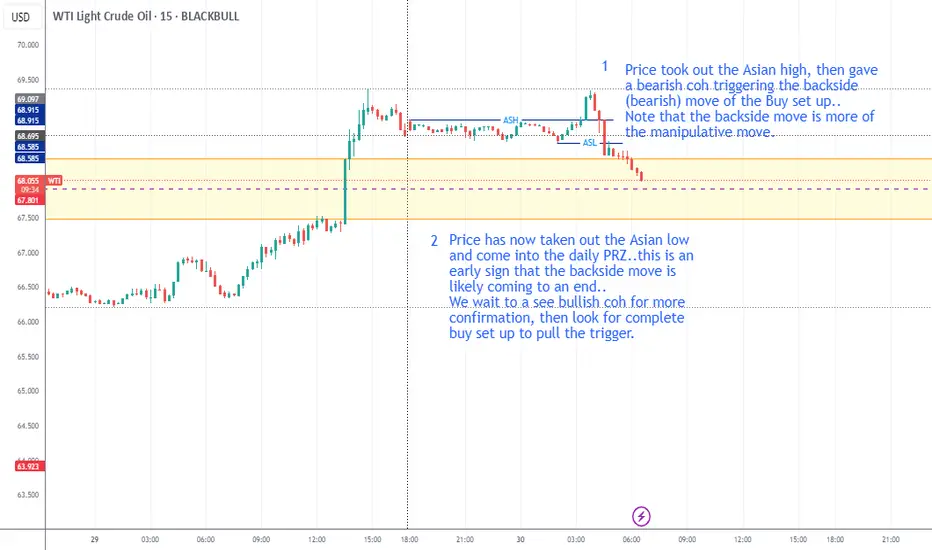
WTI is up on my radarPrice closed above daily GM, travelled, and now retraced back to the GM..
For now, I'll be BULLISH biased and look for Buy setup on the lower time frames..
Price took out the Asian high, then gave a bearish coh triggering the backside (bearish) move of the Buy set up..
Note that the backside move is more of the manipulative move.
Price has now taken out the Asian low and come into the daily PRZ..this is an early sign that the backside move is likely coming to an end..
We wait to a see bullish coh for more confirmation, then look for complete buy set up to pull the trigger.
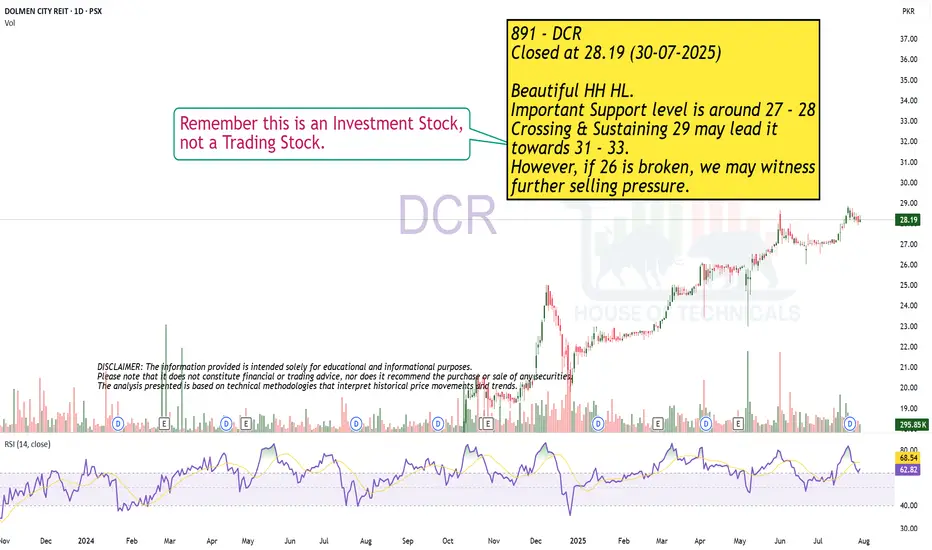
Beautiful HH HL.891 - DCR
Closed at 28.19 (30-07-2025)
Beautiful HH HL.
Important Support level is around 27 - 28
Crossing & Sustaining 29 may lead it
towards 31 - 33.
However, if 26 is broken, we may witness
further selling pressure.
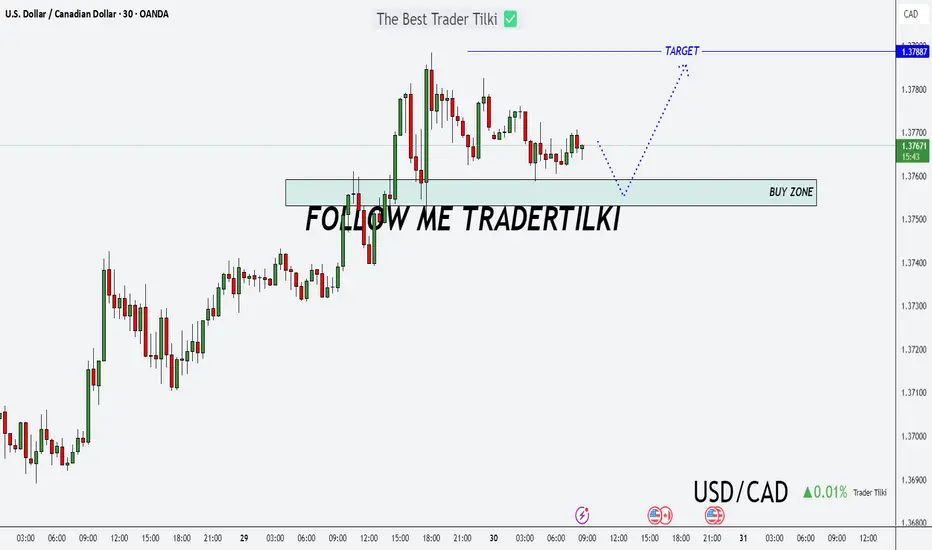
A New Day, A New Opportunity: USDCAD Buy StrategyGood morning Traders,
USDCAD has reached a key support zone between 1.37531 and 1.37592.
I'm opening a buy position from this level, aiming for the 1.37887 target.
Feel free to adjust your stop-loss based on your own margin and risk tolerance.
Your likes are my biggest source of motivation when sharing analysis. Thanks to everyone who supports with a simple like!
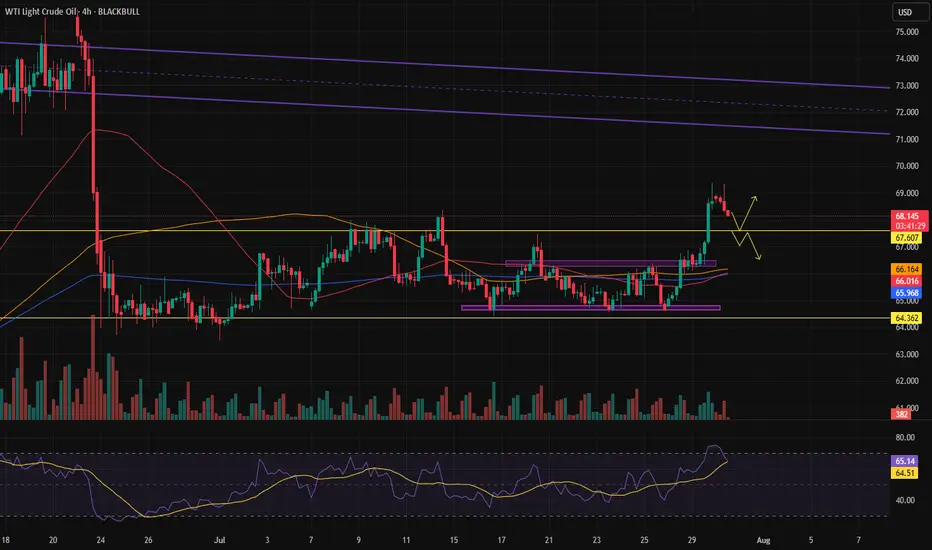
Back to boring range or a pullback and trend continuation?I hope it doesn't return to that boring range and instead makes a pullback and moves upward.
Although the price of oil depends on thousands of fundamental reasons.
Correction and rise, or drop?Today, with the first news release, we'll see whether the Dollar Index is making a correction before continuing upward, or if it's going to drop and fall back into the channel.