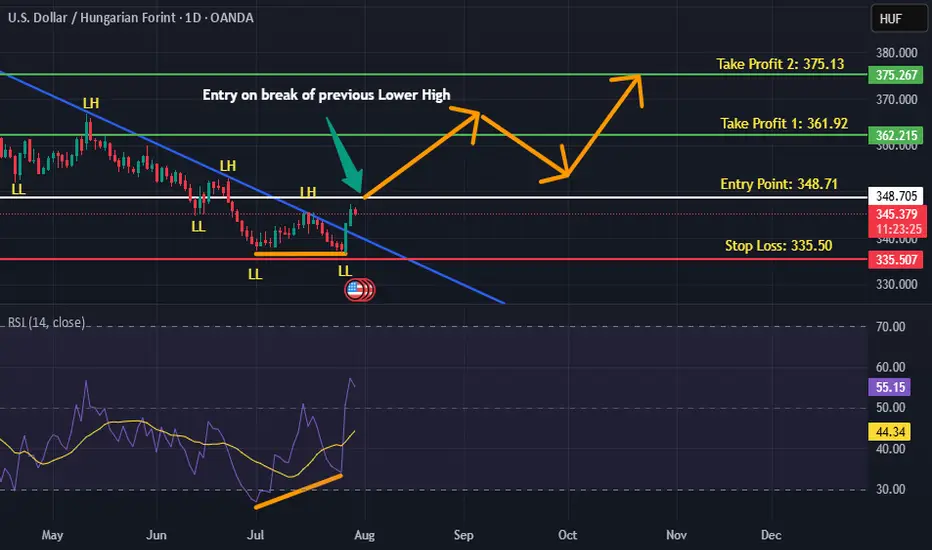
USDHUF is BullishPrice was in a downtrend, and respecting the descending trendline. However the bullish divergence coupled with double bottom reversal pattern hints that bulls are assuming control of the price action. If previous lower high is broken with good volume then we can expect a bullish reversal as per Dow theory. Targets are mentioned on the chart.
Harmonic Patterns
#ETH/USDT SETUP ,Bought From $3696#ETH
The price is moving within a descending channel on the 1-hour frame, adhering well to it, and is on its way to breaking strongly upwards and retesting it.
We have support from the lower boundary of the descending channel at 3640.
We have a downtrend on the RSI indicator that is about to be broken and retested, supporting the upside.
There is a major support area in green at 3600, which represents a strong basis for the upside.
Don't forget a simple thing: ease and capital.
When you reach the first target, save some money and then change your stop-loss order to an entry order.
For inquiries, please leave a comment.
We have a trend to hold above the Moving Average 100.
Entry price: 3696.
First target: 3764.
Second target: 3826.
Third target: 3904.
Don't forget a simple thing: ease and capital.
When you reach your first target, save some money and then change your stop-loss order to an entry order.
For inquiries, please leave a comment.
Thank you.

#ZETA/USDT Critical Support#ZETA
The price is moving within an ascending channel on the 1-hour frame, adhering well to it, and is on track to break it strongly upwards and retest it.
We have support from the lower boundary of the ascending channel, at 0.1960.
We have a downtrend on the RSI indicator that is about to break and retest, supporting the upside.
There is a major support area in green at 0.1985, which represents a strong basis for the upside.
Don't forget a simple thing: ease and capital.
When you reach the first target, save some money and then change your stop-loss order to an entry order.
For inquiries, please leave a comment.
We have a trend to hold above the 100 Moving Average.
Entry price: 0.2030.
First target: 0.2060.
Second target: 0.2104.
Third target: 0.2156.
Don't forget a simple thing: ease and capital.
When you reach your first target, save some money and then change your stop-loss order to an entry order.
For inquiries, please leave a comment.
Thank you.

BTC - Bulls vs Bears: who will win?Market Context
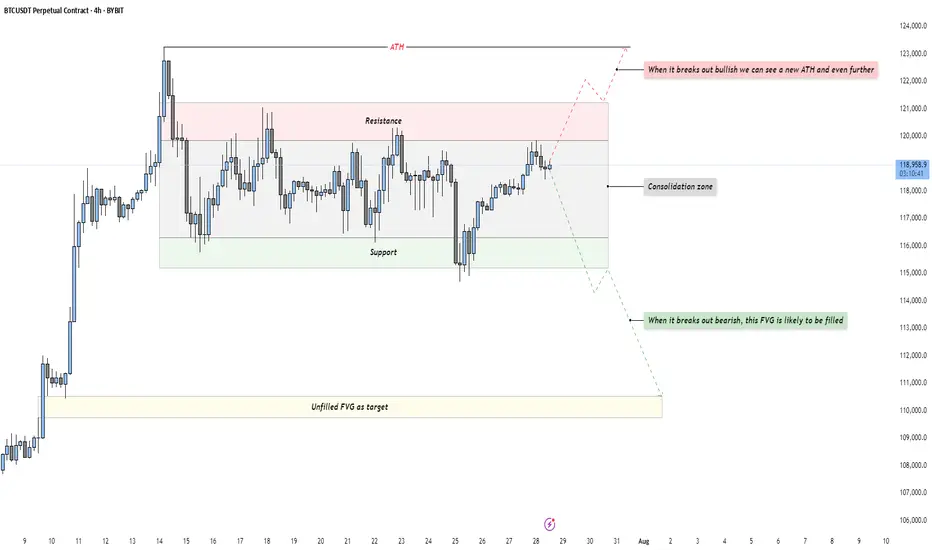
Bitcoin is trading in a tight consolidation just below its all-time high after a strong impulsive rally. This phase represents a balance of power between buyers and sellers, with neither side able to take control yet. Such a pause in momentum at this key level often builds pressure for a breakout move as liquidity pools accumulate above and below the range.
Consolidation Phase
The current range is clearly defined by a resistance area at the top and a support area at the bottom. Price has been oscillating within these boundaries without any sustained breakout attempts. This range-bound behavior is an essential part of the market cycle, as it allows larger players to build or distribute positions. The longer price stays in this box, the more significant the breakout that follows tends to be.
Bullish Breakout Scenario
If price breaks out decisively above resistance, it would indicate buyers have absorbed all the supply at these levels. Such a breakout opens the path to a new all-time high and could potentially extend far beyond as trapped shorts are forced to cover. For traders, a retest of the breakout level on lower timeframes could provide a low-risk entry point for continuation to the upside.
Bearish Breakout Scenario
On the flip side, if support fails, the market will likely gravitate toward the unfilled Fair Value Gap left behind during the previous rally. This inefficiency becomes a natural draw for price, offering a logical downside target for a corrective move. A clean break below the range followed by a retest from underneath could present shorting opportunities for those aiming to capture that move into the FVG.
Final Words
Patience and precision are key when dealing with setups like this. Let the market come to your level — and react with intent.
If you found this breakdown helpful, a like is much appreciated! Let me know in the comments what you think or if you’re watching the same zones.
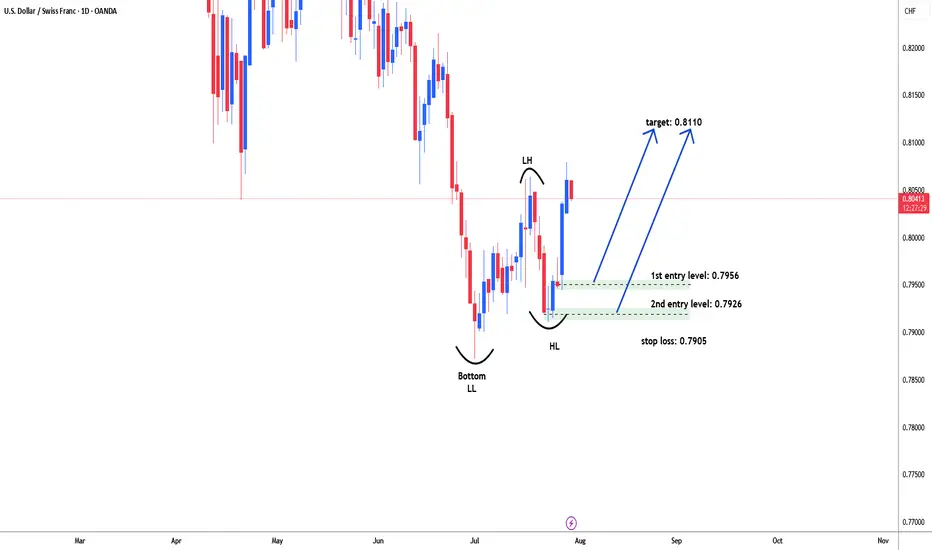
USDCHF possible bullish reversal for 0.8110#USDCHF forming higher high and higher low in daily time frame. broker initial resistance level as 0.8064 but did not hold price above it. need patient for pullback to test demand zone for another leg higher. Price could not breach lower low level 0.7873 and start moving higher. there are two different demand levels for long i.e. 0.7956 & 0.7626. stop loss below 0.7910 i.e 0.7985. target: 0.8110
Gold Trade plan 30/07/2025Dear Traders,
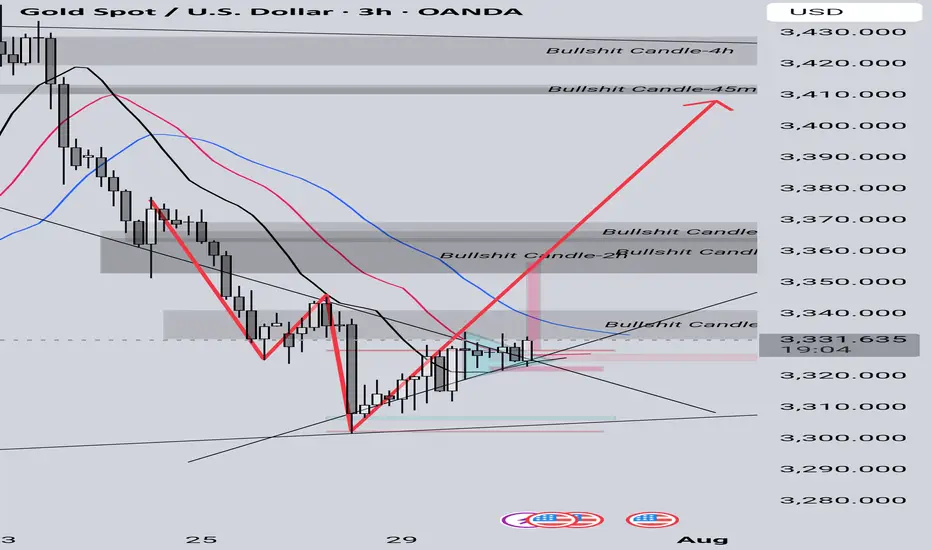
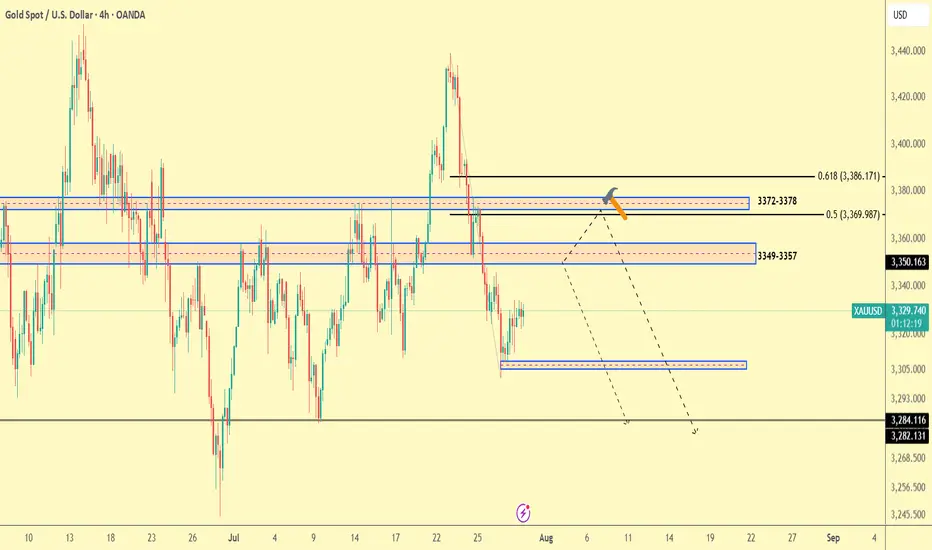
This chart represents the XAU/USD (Gold / U.S. Dollar) pair on a 4-hour timeframe. The market is showing a series of Fibonacci retracements and key levels, with potential price action zones marked for future movements.
Key Levels:
Resistance Zones: At 3,422.105 (near the green line), followed by the 3,386.171 level (Fibonacci 0.618).
Support Zones: Major support is visible near 3,282.131 (bottom of the chart), with additional minor support levels at 3,305.000 and 3,293.000.
Mid-range Support: Around 3,369.987.
Potential Price Action:
The price recently dropped from higher levels, breaking below the previous support levels. The market seems to be testing lower support zones.
A potential move down towards 3,284.116 or 3,282.131 is likely if the current support levels do not hold.
Conversely, if price action holds the current support zone (3,329.040), a retest of the higher resistance at 3,350.163 could occur.
Fibonacci Levels:
Retracement Levels: The Fibonacci retracement is drawn with key levels, particularly around 3,372-3,378 and 3,349-3,357, acting as strong support or resistance.
Extensions: There is potential for the price to move towards the 3,420 region if resistance levels break.
Strategy Suggestion:
Short Position: Targeting lower levels near 3,282.131 or 3,284.116.
Long Position: If price holds above 3,329.040, target resistance at 3,350.163 and beyond.
Regards,
Alireza!
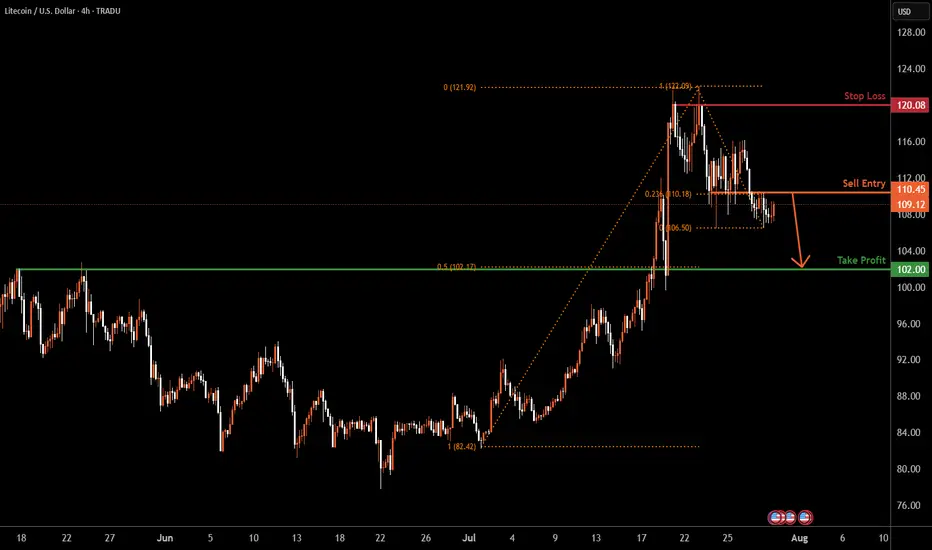
LTCUSD H4 | Bearish reversal off pullback resistanceLitecoin (LTC/USD) is rising towards the sell entry that lines up with the 23.6% Fibonacci retracement and could drop lower.
Sell entry is at 110.45, which is a pullback resistance that aligns with the 23.6% Fibonacci retracement.
Stop loss is at 120.08, which is a swing high resistance.
Take profit is at 102.00, which is an overlap support that aligns with the 50% Fibonacci retracement.
High Risk Investment Warning
Trading Forex/CFDs on margin carries a high level of risk and may not be suitable for all investors. Leverage can work against you.
Stratos Markets Limited (tradu.com ):
CFDs are complex instruments and come with a high risk of losing money rapidly due to leverage. 65% of retail investor accounts lose money when trading CFDs with this provider. You should consider whether you understand how CFDs work and whether you can afford to take the high risk of losing your money.
Stratos Europe Ltd (tradu.com ):
CFDs are complex instruments and come with a high risk of losing money rapidly due to leverage. 66% of retail investor accounts lose money when trading CFDs with this provider. You should consider whether you understand how CFDs work and whether you can afford to take the high risk of losing your money.
Stratos Global LLC (tradu.com ):
Losses can exceed deposits.
Please be advised that the information presented on TradingView is provided to Tradu (‘Company’, ‘we’) by a third-party provider (‘TFA Global Pte Ltd’). Please be reminded that you are solely responsible for the trading decisions on your account. There is a very high degree of risk involved in trading. Any information and/or content is intended entirely for research, educational and informational purposes only and does not constitute investment or consultation advice or investment strategy. The information is not tailored to the investment needs of any specific person and therefore does not involve a consideration of any of the investment objectives, financial situation or needs of any viewer that may receive it. Kindly also note that past performance is not a reliable indicator of future results. Actual results may differ materially from those anticipated in forward-looking or past performance statements. We assume no liability as to the accuracy or completeness of any of the information and/or content provided herein and the Company cannot be held responsible for any omission, mistake nor for any loss or damage including without limitation to any loss of profit which may arise from reliance on any information supplied by TFA Global Pte Ltd.
The speaker(s) is neither an employee, agent nor representative of Tradu and is therefore acting independently. The opinions given are their own, constitute general market commentary, and do not constitute the opinion or advice of Tradu or any form of personal or investment advice. Tradu neither endorses nor guarantees offerings of third-party speakers, nor is Tradu responsible for the content, veracity or opinions of third-party speakers, presenters or participants.
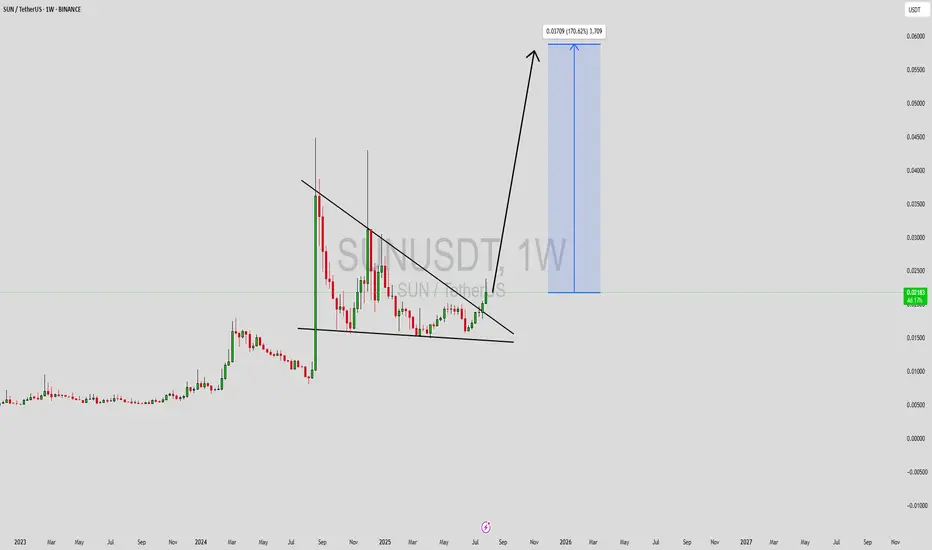
SUNUSDT Forming Potential BreakoutSUNUSDT is currently forming a promising potential breakout pattern that traders and investors should closely watch. The price action has shown a period of consolidation near key support zones, building a strong base for a potential explosive move. With volume gradually increasing and bulls taking control, the pair appears primed to break past resistance levels, signaling the beginning of a new uptrend phase.
The technical structure supports a bullish bias, with the potential to achieve a gain of 140% to 150%+ if the breakout materializes fully. Historical price behavior and recent candle formations suggest that SUNUSDT is gearing up for a rally, especially as it approaches a crucial trendline. If confirmed, this breakout could lead to a parabolic move, driven by renewed market interest and buying pressure.
SUN, being part of the TRON ecosystem, benefits from a solid foundation and increasing usage in DeFi applications. The token has seen growing investor interest, further fueling positive sentiment and long-term potential. The fundamentals are aligning well with the current technical outlook, providing additional confidence to bullish traders eyeing high-reward setups.
Given the momentum and improving market dynamics, SUNUSDT has become a high-potential watchlist candidate for both swing traders and long-term investors. A confirmed breakout above the current range could open the door to significant upside gains.
✅ Show your support by hitting the like button and
✅ Leaving a comment below! (What is You opinion about this Coin)
Your feedback and engagement keep me inspired to share more insightful market analysis with you!
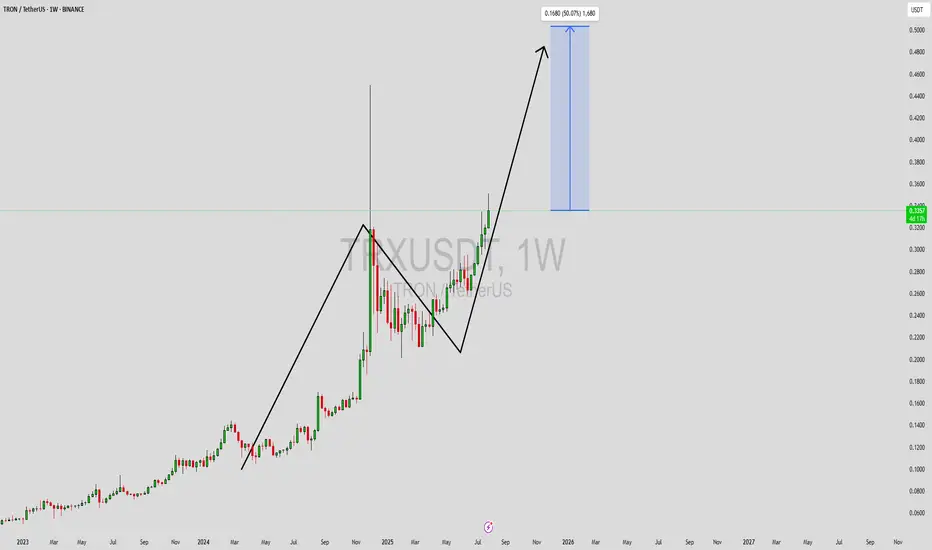
TRXUSDT Forming bullish continuationTRXUSDT (TRON/USDT) is currently showing a strong bullish continuation pattern on the weekly chart, suggesting that the momentum is far from over. After a solid upward rally followed by a corrective wave, the price has resumed its uptrend with clear higher highs and higher lows forming on the chart. The recent breakout to the upside signals renewed bullish strength, supported by increasing volume and investor confidence.
The chart setup indicates a potential 40% to 50% price increase in the coming weeks, based on the current market structure and projection from the previous swing high. TRX is now targeting a significant resistance zone, and a successful breakout above this level could trigger a fresh leg up. With broader market conditions stabilizing and TRON's fundamentals remaining strong, the likelihood of sustained gains remains high.
TRON has consistently maintained its presence as one of the top utility-focused blockchain projects, offering fast, low-cost transactions and ongoing ecosystem development. This fundamental strength, combined with the technical setup, is drawing attention from both retail and institutional investors. The rising volume supports the idea that smart money is accumulating ahead of a bigger move.
With momentum building and chart signals aligning in favor of bulls, TRXUSDT is positioned for a potential breakout run. Traders and investors may consider keeping this pair on their radar, especially if it retests support levels successfully before pushing higher.
✅ Show your support by hitting the like button and
✅ Leaving a comment below! (What is You opinion about this Coin)
Your feedback and engagement keep me inspired to share more insightful market analysis with you!
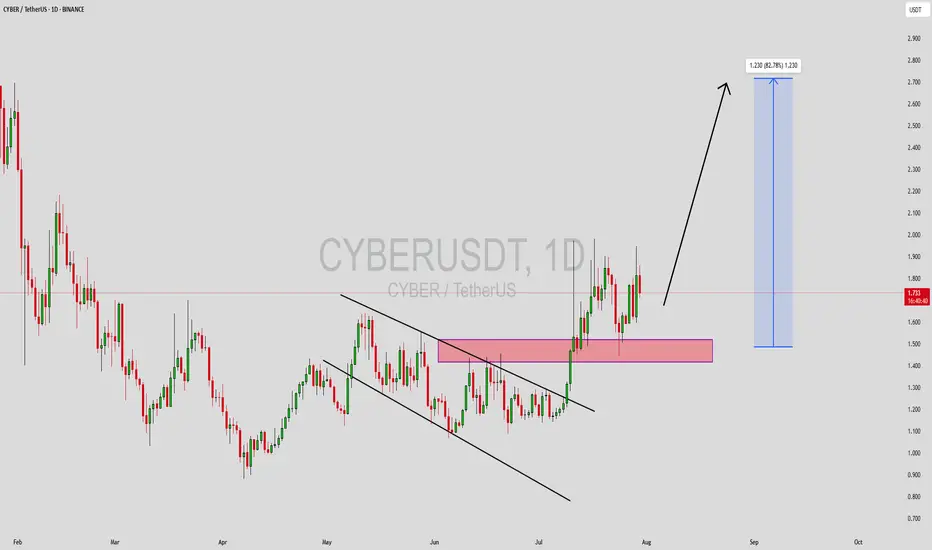
CYBERUSDT Forming Descending ChannelCYBERUSDT is currently displaying a bullish setup, forming a textbook descending wedge pattern on the chart. This technical formation is typically a strong reversal signal, often preceding a breakout to the upside. With price action narrowing within the wedge and maintaining solid support, the probability of an impulsive move upwards increases. Volume remains consistent, indicating that accumulation may already be underway by informed participants.
The descending wedge pattern converges toward a breakout zone, and CYBERUSDT is now nearing that critical point. Historically, such patterns lead to a price surge once the resistance line is breached with conviction. The expected potential gain of 70% to 80% aligns with the measured move from the height of the wedge, making this pair an attractive setup for breakout traders and mid-term holders. Momentum indicators are also starting to tilt bullish, providing further confluence for upside movement.
Investor interest appears to be growing around CYBER, not only from technical traders but also from market sentiment indicators. This suggests that the coin is gaining traction across multiple fronts, which could act as a catalyst for further price appreciation. The wedge breakout, if confirmed with strong volume, could result in a swift and aggressive rally, especially in a supportive broader market environment.
If CYBERUSDT breaks out with strength and retests the upper boundary successfully, it could mark the beginning of a sustained bullish phase. Traders should watch for confirmation with a daily candle close above the wedge resistance. With significant upside potential and a bullish pattern structure, CYBERUSDT is one of the coins to watch closely this week.
✅ Show your support by hitting the like button and
✅ Leaving a comment below! (What is You opinion about this Coin)
Your feedback and engagement keep me inspired to share more insightful market analysis with you!
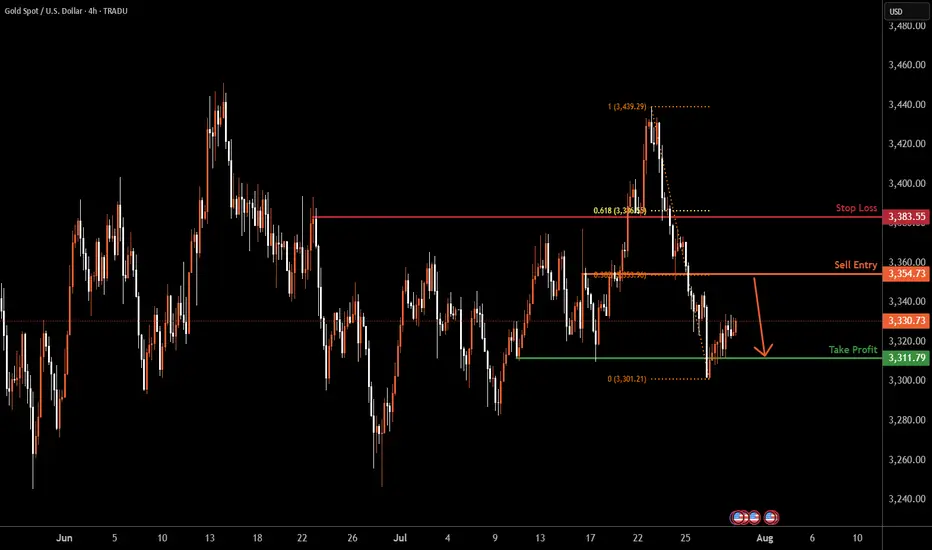
XAUUSD H4 | Heading into pullback resistanceBased on the H4 chart analysis, the price is rising towards the sell entry, which is a pullback resistance that lines up with the 38.2% Fibonacci retracement and could drop to the take profit.
Sell entry is at 3,354.73, which is a pullback resistance that aligns with the 38.2% Fibonacci retracement.
Stop loss is at 3,383.55, which is a pullback resistance that is slightly below the 61.8% Fibonacci retracement.
Take profit is at 3,311.79, which is a multi-swing low support.
High Risk Investment Warning
Trading Forex/CFDs on margin carries a high level of risk and may not be suitable for all investors. Leverage can work against you.
Stratos Markets Limited (tradu.com ):
CFDs are complex instruments and come with a high risk of losing money rapidly due to leverage. 65% of retail investor accounts lose money when trading CFDs with this provider. You should consider whether you understand how CFDs work and whether you can afford to take the high risk of losing your money.
Stratos Europe Ltd (tradu.com ):
CFDs are complex instruments and come with a high risk of losing money rapidly due to leverage. 66% of retail investor accounts lose money when trading CFDs with this provider. You should consider whether you understand how CFDs work and whether you can afford to take the high risk of losing your money.
Stratos Global LLC (tradu.com ):
Losses can exceed deposits.
Please be advised that the information presented on TradingView is provided to Tradu (‘Company’, ‘we’) by a third-party provider (‘TFA Global Pte Ltd’). Please be reminded that you are solely responsible for the trading decisions on your account. There is a very high degree of risk involved in trading. Any information and/or content is intended entirely for research, educational and informational purposes only and does not constitute investment or consultation advice or investment strategy. The information is not tailored to the investment needs of any specific person and therefore does not involve a consideration of any of the investment objectives, financial situation or needs of any viewer that may receive it. Kindly also note that past performance is not a reliable indicator of future results. Actual results may differ materially from those anticipated in forward-looking or past performance statements. We assume no liability as to the accuracy or completeness of any of the information and/or content provided herein and the Company cannot be held responsible for any omission, mistake nor for any loss or damage including without limitation to any loss of profit which may arise from reliance on any information supplied by TFA Global Pte Ltd.
The speaker(s) is neither an employee, agent nor representative of Tradu and is therefore acting independently. The opinions given are their own, constitute general market commentary, and do not constitute the opinion or advice of Tradu or any form of personal or investment advice. Tradu neither endorses nor guarantees offerings of third-party speakers, nor is Tradu responsible for the content, veracity or opinions of third-party speakers, presenters or participants.
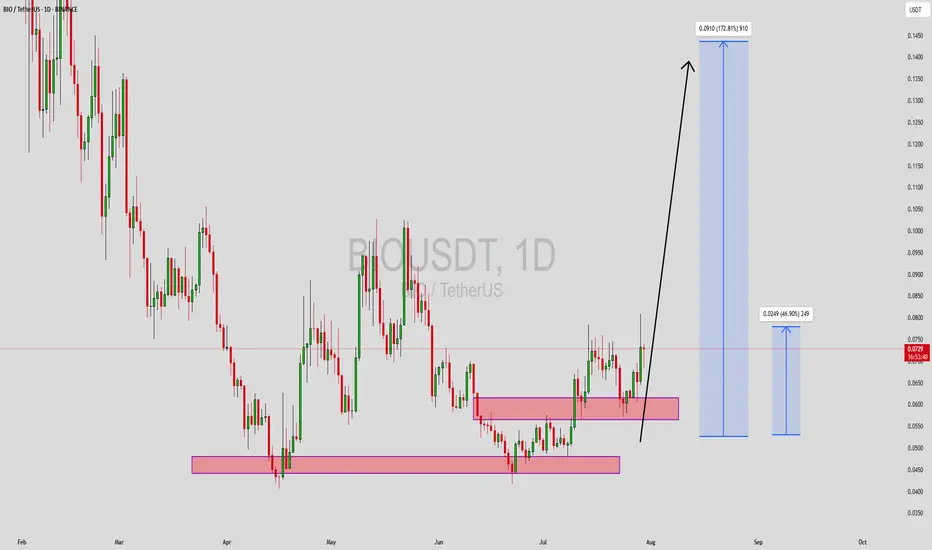
BIOUSDT Forming Strong PotentialBIOUSDT is currently presenting a highly promising technical structure, suggesting a strong potential upside. The chart shows the price has recently bounced from a key support zone and has started forming higher lows—an early signal of bullish accumulation. With multiple support blocks holding firm and upward price projection arrows indicating potential targets, the setup leans toward a breakout continuation. The volume pattern also confirms healthy market activity, which reinforces the strength of this possible trend reversal.
The price action seems to be coiling just beneath resistance, which typically precedes an impulsive breakout move. Based on the chart’s structure and market dynamics, there is a clear path for a substantial price rally. The projected targets indicate a potential gain of 140% to 150%, making BIOUSDT a high-potential candidate for short- to mid-term traders. The confluence of horizontal support zones and higher timeframe trend signals suggest that momentum may continue to build in the coming sessions.
What sets BIOUSDT apart right now is the growing investor interest around the project. Whether driven by ecosystem developments or speculative momentum, the increased volume and social buzz are helping sustain price levels and set the stage for a bullish continuation. A confirmed breakout above the recent consolidation could lead to rapid gains, especially if broader market conditions remain favorable.
Traders should keep an eye on a daily close above the marked resistance region with increased volume as a confirmation signal. Given the sharp projected upside and the clear technical roadmap laid out on the chart, BIOUSDT remains a compelling opportunity for those monitoring altcoins with breakout potential.
✅ Show your support by hitting the like button and
✅ Leaving a comment below! (What is You opinion about this Coin)
Your feedback and engagement keep me inspired to share more insightful market analysis with you!
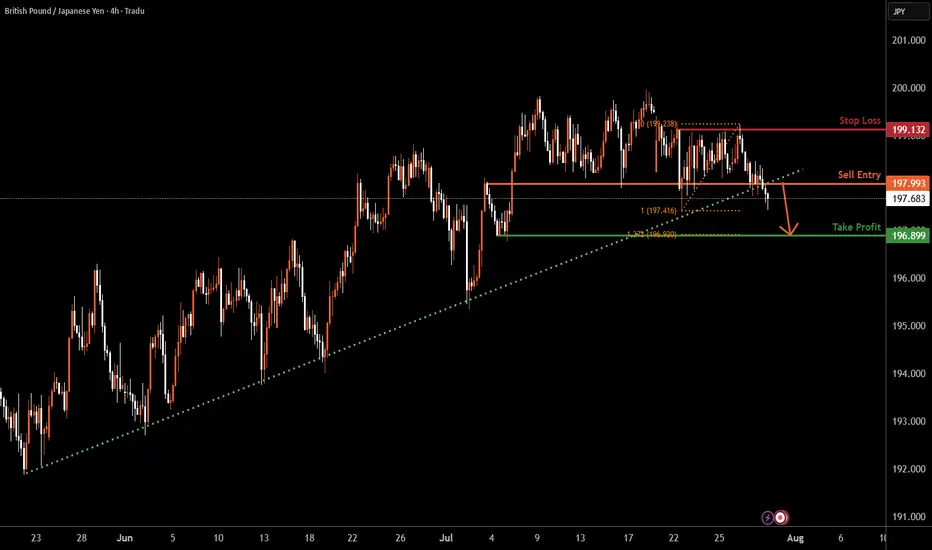
GBPJPY H4 | Bearish dropGBP/JPY has broken below the support level, which is an overlap support. A potential pullback to the sell entry, followed by a reversal, could lead to a further price drop.
Sell entry is at 197.99, which is an overlap resistance.
Stop loss is at 199.13, which is a pullback resistance.
Take profit is at 196.89, which is a swing low support that lines up with the 127.2% Fibonacci extension.
High Risk Investment Warning
Trading Forex/CFDs on margin carries a high level of risk and may not be suitable for all investors. Leverage can work against you.
Stratos Markets Limited (tradu.com ):
CFDs are complex instruments and come with a high risk of losing money rapidly due to leverage. 65% of retail investor accounts lose money when trading CFDs with this provider. You should consider whether you understand how CFDs work and whether you can afford to take the high risk of losing your money.
Stratos Europe Ltd (tradu.com ):
CFDs are complex instruments and come with a high risk of losing money rapidly due to leverage. 66% of retail investor accounts lose money when trading CFDs with this provider. You should consider whether you understand how CFDs work and whether you can afford to take the high risk of losing your money.
Stratos Global LLC (tradu.com ):
Losses can exceed deposits.
Please be advised that the information presented on TradingView is provided to Tradu (‘Company’, ‘we’) by a third-party provider (‘TFA Global Pte Ltd’). Please be reminded that you are solely responsible for the trading decisions on your account. There is a very high degree of risk involved in trading. Any information and/or content is intended entirely for research, educational and informational purposes only and does not constitute investment or consultation advice or investment strategy. The information is not tailored to the investment needs of any specific person and therefore does not involve a consideration of any of the investment objectives, financial situation or needs of any viewer that may receive it. Kindly also note that past performance is not a reliable indicator of future results. Actual results may differ materially from those anticipated in forward-looking or past performance statements. We assume no liability as to the accuracy or completeness of any of the information and/or content provided herein and the Company cannot be held responsible for any omission, mistake nor for any loss or damage including without limitation to any loss of profit which may arise from reliance on any information supplied by TFA Global Pte Ltd.
The speaker(s) is neither an employee, agent nor representative of Tradu and is therefore acting independently. The opinions given are their own, constitute general market commentary, and do not constitute the opinion or advice of Tradu or any form of personal or investment advice. Tradu neither endorses nor guarantees offerings of third-party speakers, nor is Tradu responsible for the content, veracity or opinions of third-party speakers, presenters or participants.
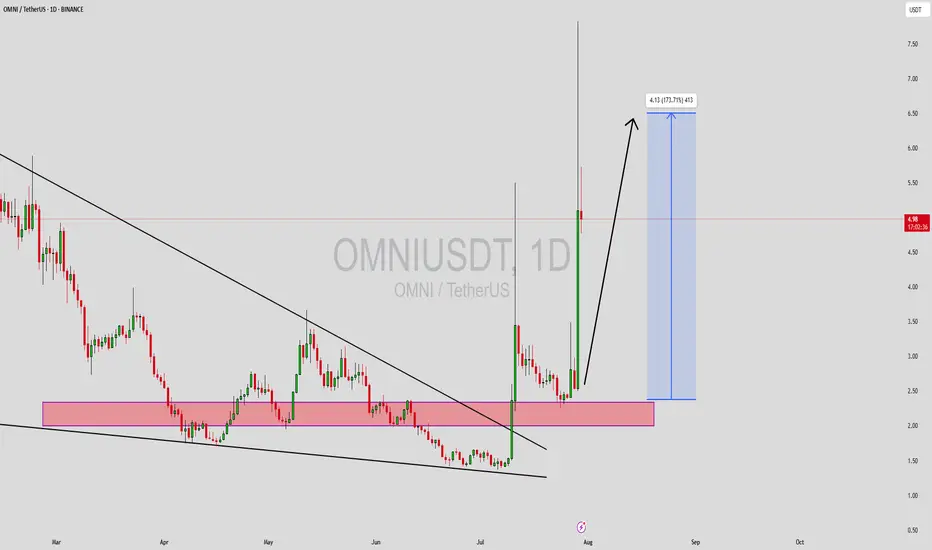
OMNIUSDT Forming Falling WedgeOMNIUSDT is currently trading within a classic falling wedge pattern, a structure that often signals a powerful bullish reversal. This pattern forms when price consolidates downward with decreasing volatility, often leading to a breakout to the upside. OMNIUSDT appears to be approaching the breakout zone, where a surge in price could be imminent. The falling wedge is a high-conviction setup among technical traders and frequently leads to strong rallies—especially when supported by increasing volume and investor sentiment, both of which are present here.
From a technical analysis perspective, the falling wedge is tightening, and bullish momentum is building as OMNIUSDT tests key resistance levels. With volume steadily increasing and investor interest on the rise, this breakout could be explosive. The expected gain projection sits between 160% to 170%, positioning OMNIUSDT as a potential outperformer in the short- to mid-term. Traders should keep an eye on confirmation signals such as a strong daily close above the wedge or a spike in buy-side volume.
There is also broader market optimism surrounding OMNIUSDT, supported by community interest and recent positive developments in the project’s ecosystem. This creates a favorable environment for bullish technical setups to play out successfully. Additionally, falling wedge patterns often attract both breakout traders and swing traders looking to capitalize on sharp price expansions.
If OMNIUSDT confirms the breakout, this move could mark the beginning of a strong uptrend. The pattern, combined with strong market fundamentals and high-volume interest, gives technical traders and investors confidence to monitor this opportunity closely.
✅ Show your support by hitting the like button and
✅ Leaving a comment below! (What is You opinion about this Coin)
Your feedback and engagement keep me inspired to share more insightful market analysis with you!
NZDUSD H4 | Bearish dropKiwi (NZD/USD) is rising towards the sell entry, which is a pullback resistance and could reverse from this level and drop lower.
Sell entry is at 0.5978, which is a pullback resistance.
Stop loss is at 0.6002, which is a pullback resistance that lines up with the 50% Fibonacci retracement.
Take profit is at 0.5942, which is a multi-swing low support.
High Risk Investment Warning
Trading Forex/CFDs on margin carries a high level of risk and may not be suitable for all investors. Leverage can work against you.
Stratos Markets Limited (tradu.com ):
CFDs are complex instruments and come with a high risk of losing money rapidly due to leverage. 65% of retail investor accounts lose money when trading CFDs with this provider. You should consider whether you understand how CFDs work and whether you can afford to take the high risk of losing your money.
Stratos Europe Ltd (tradu.com ):
CFDs are complex instruments and come with a high risk of losing money rapidly due to leverage. 66% of retail investor accounts lose money when trading CFDs with this provider. You should consider whether you understand how CFDs work and whether you can afford to take the high risk of losing your money.
Stratos Global LLC (tradu.com ):
Losses can exceed deposits.
Please be advised that the information presented on TradingView is provided to Tradu (‘Company’, ‘we’) by a third-party provider (‘TFA Global Pte Ltd’). Please be reminded that you are solely responsible for the trading decisions on your account. There is a very high degree of risk involved in trading. Any information and/or content is intended entirely for research, educational and informational purposes only and does not constitute investment or consultation advice or investment strategy. The information is not tailored to the investment needs of any specific person and therefore does not involve a consideration of any of the investment objectives, financial situation or needs of any viewer that may receive it. Kindly also note that past performance is not a reliable indicator of future results. Actual results may differ materially from those anticipated in forward-looking or past performance statements. We assume no liability as to the accuracy or completeness of any of the information and/or content provided herein and the Company cannot be held responsible for any omission, mistake nor for any loss or damage including without limitation to any loss of profit which may arise from reliance on any information supplied by TFA Global Pte Ltd.
The speaker(s) is neither an employee, agent nor representative of Tradu and is therefore acting independently. The opinions given are their own, constitute general market commentary, and do not constitute the opinion or advice of Tradu or any form of personal or investment advice. Tradu neither endorses nor guarantees offerings of third-party speakers, nor is Tradu responsible for the content, veracity or opinions of third-party speakers, presenters or participants.

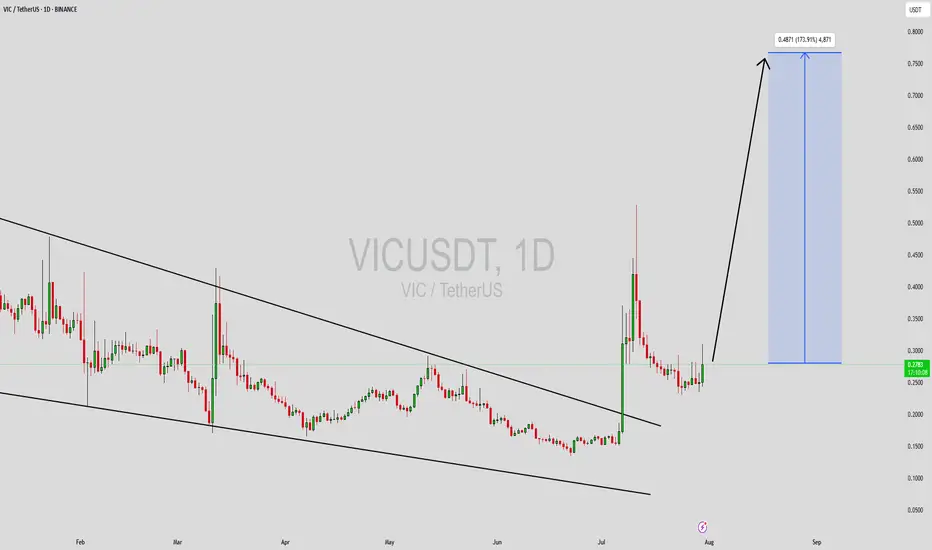
VICUSDT Forming Bullish WaveVICUSDT is currently exhibiting a powerful bullish wave pattern that could signal the beginning of a significant upward move. After a period of consolidation and corrective decline, the price has begun to carve out a series of higher highs and higher lows—often a precursor to explosive momentum. The volume profile also aligns with this structure, showing increased interest from buyers who seem to be positioning ahead of a breakout. This pattern often aligns with Elliott Wave Theory’s impulsive leg, suggesting a sharp upside move could soon unfold.
Technically, VICUSDT is showing signs of entering a new bullish phase. With a potential breakout already brewing, this asset could see an impressive gain of around 140% to 150% if current momentum continues. Traders should pay attention to resistance breakouts and volume surges, as these will be key confirmations of the wave pattern's validity. The bullish wave formation indicates not just a short-term pump, but the possibility of sustained upward movement in line with broader market recovery.
Investor sentiment is steadily improving around the VICUSDT project. Increased trading volume and stronger community buzz suggest that accumulation is underway, potentially ahead of major catalyst events or market-wide bullishness. This aligns well with technical projections, making VICUSDT a high-risk, high-reward opportunity for traders watching for altcoin season setups.
In a market driven by momentum and wave-based patterns, VICUSDT stands out with a structure that supports a strong continuation. Traders and investors alike should keep a close eye on this pair, as the technicals align for a breakout scenario that could exceed expectations.
✅ Show your support by hitting the like button and
✅ Leaving a comment below! (What is You opinion about this Coin)
Your feedback and engagement keep me inspired to share more insightful market analysis with you!
AUDUSD H4| Bearish reversal off 38.2% Fibonacci resistanceAussie (AUD/USD) is rising towards the sell entry, which is a pullback resistance that lines up with the 38.2% Fibonacci retracement and could reverse to the take profit.
Buy entry is at 0.6541, which is a pullback resistance that lines up with the 38.2% Fibonacci retracement.
Stop loss is at 0.6580, which is a pullback resistance that aligns with the 61.8% Fibonacci retracement.
Take profit is at 0.6467, which is a swing low support.
High Risk Investment Warning
Trading Forex/CFDs on margin carries a high level of risk and may not be suitable for all investors. Leverage can work against you.
Stratos Markets Limited (tradu.com ):
CFDs are complex instruments and come with a high risk of losing money rapidly due to leverage. 65% of retail investor accounts lose money when trading CFDs with this provider. You should consider whether you understand how CFDs work and whether you can afford to take the high risk of losing your money.
Stratos Europe Ltd (tradu.com ):
CFDs are complex instruments and come with a high risk of losing money rapidly due to leverage. 66% of retail investor accounts lose money when trading CFDs with this provider. You should consider whether you understand how CFDs work and whether you can afford to take the high risk of losing your money.
Stratos Global LLC (tradu.com ):
Losses can exceed deposits.
Please be advised that the information presented on TradingView is provided to Tradu (‘Company’, ‘we’) by a third-party provider (‘TFA Global Pte Ltd’). Please be reminded that you are solely responsible for the trading decisions on your account. There is a very high degree of risk involved in trading. Any information and/or content is intended entirely for research, educational and informational purposes only and does not constitute investment or consultation advice or investment strategy. The information is not tailored to the investment needs of any specific person and therefore does not involve a consideration of any of the investment objectives, financial situation or needs of any viewer that may receive it. Kindly also note that past performance is not a reliable indicator of future results. Actual results may differ materially from those anticipated in forward-looking or past performance statements. We assume no liability as to the accuracy or completeness of any of the information and/or content provided herein and the Company cannot be held responsible for any omission, mistake nor for any loss or damage including without limitation to any loss of profit which may arise from reliance on any information supplied by TFA Global Pte Ltd.
The speaker(s) is neither an employee, agent nor representative of Tradu and is therefore acting independently. The opinions given are their own, constitute general market commentary, and do not constitute the opinion or advice of Tradu or any form of personal or investment advice. Tradu neither endorses nor guarantees offerings of third-party speakers, nor is Tradu responsible for the content, veracity or opinions of third-party speakers, presenters or participants.

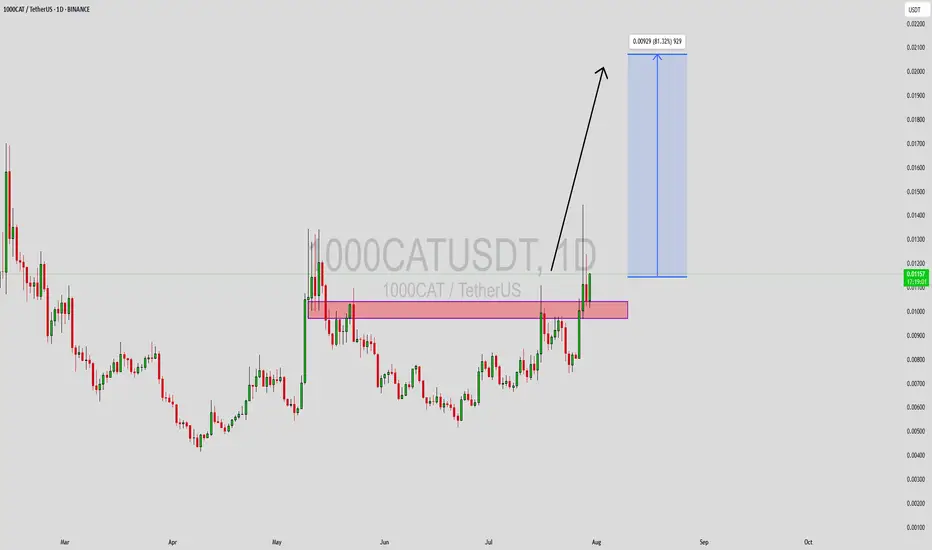
1000CATUSDT Forming Bullish Reversal1000CATUSDT is showing strong signs of bullish Reversal as it begins to form a solid base for a possible upward rally. After a period of consolidation, price action appears to be gaining momentum, supported by good volume activity — a key indicator that accumulation may be taking place. This setup has caught the attention of many short- and mid-term traders anticipating a breakout in the coming days.
From a technical perspective, the current structure suggests that buyers are starting to step in more aggressively. The asset seems to be forming higher lows, which could be the early signs of a trend reversal. If the price manages to break above its recent resistance zone, a strong upward move of around 70% to 80% could be within reach, especially as market sentiment around small-cap altcoins continues to improve.
Investor interest is increasing in the CATUSDT project, fueled by community engagement and growing speculative momentum. Such market dynamics often precede sharp moves in price, especially when supported by technical breakout patterns and volume confirmation. The fundamentals combined with bullish technicals make 1000CATUSDT one to watch closely.
As the broader market stabilizes, assets like 1000CATUSDT with strong technical structures and bullish setups could deliver notable returns. Traders should remain alert for confirmation signals and take advantage of the potential upside if bullish continuation unfolds.
✅ Show your support by hitting the like button and
✅ Leaving a comment below! (What is You opinion about this Coin)
Your feedback and engagement keep me inspired to share more insightful market analysis with you!
USDJPY | H4 Bullish bounce offBased on the H4 chart analysis, the price is falling towards the buy entry, which is an overlap support that aligns with the 61.8% Fibonacci retracement and could bounce from this level and rise higher.
Buy entry is at 147.08, which is an overlap support that lines up with the 61.8% Fibonacci retracement.
Stop loss is at 145.82, which is a multi-swing low support.
Take profit is at 148.72, which is pullback resistance.
High Risk Investment Warning
Trading Forex/CFDs on margin carries a high level of risk and may not be suitable for all investors. Leverage can work against you.
Stratos Markets Limited (tradu.com ):
CFDs are complex instruments and come with a high risk of losing money rapidly due to leverage. 65% of retail investor accounts lose money when trading CFDs with this provider. You should consider whether you understand how CFDs work and whether you can afford to take the high risk of losing your money.
Stratos Europe Ltd (tradu.com):
CFDs are complex instruments and come with a high risk of losing money rapidly due to leverage. 66% of retail investor accounts lose money when trading CFDs with this provider. You should consider whether you understand how CFDs work and whether you can afford to take the high risk of losing your money.
Stratos Global LLC (tradu.com ):
Losses can exceed deposits.
Please be advised that the information presented on TradingView is provided to Tradu (‘Company’, ‘we’) by a third-party provider (‘TFA Global Pte Ltd’). Please be reminded that you are solely responsible for the trading decisions on your account. There is a very high degree of risk involved in trading. Any information and/or content is intended entirely for research, educational and informational purposes only and does not constitute investment or consultation advice or investment strategy. The information is not tailored to the investment needs of any specific person and therefore does not involve a consideration of any of the investment objectives, financial situation or needs of any viewer that may receive it. Kindly also note that past performance is not a reliable indicator of future results. Actual results may differ materially from those anticipated in forward-looking or past performance statements. We assume no liability as to the accuracy or completeness of any of the information and/or content provided herein and the Company cannot be held responsible for any omission, mistake nor for any loss or damage including without limitation to any loss of profit which may arise from reliance on any information supplied by TFA Global Pte Ltd.
The speaker(s) is neither an employee, agent nor representative of Tradu and is therefore acting independently. The opinions given are their own, constitute general market commentary, and do not constitute the opinion or advice of Tradu or any form of personal or investment advice. Tradu neither endorses nor guarantees offerings of third-party speakers, nor is Tradu responsible for the content, veracity or opinions of third-party speakers, presenters or participants.

Waiting for tomorrow.The entire market is waiting for the major news that will be announced one after another starting tomorrow.

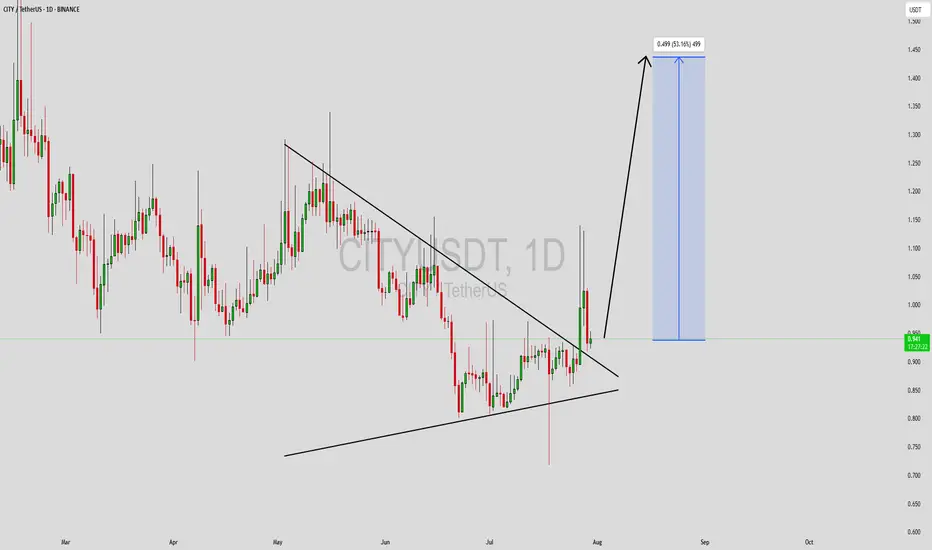
CITYUSDT Forming Descending ChannelCITYUSDT has recently broken out of a well-defined descending channel pattern, indicating a potential shift from a bearish trend into a bullish reversal phase. This breakout is a significant technical signal, especially when accompanied by increasing trading volume, which confirms renewed interest and momentum in the market. The descending channel acted as a prolonged consolidation, allowing price action to coil and build potential energy for the next major move.
As the price exits the channel, it is now testing previous resistance levels that may soon flip into support. This transition marks a critical turning point for CITYUSDT, as buyers begin to step in with more confidence. If the momentum continues, a 40% to 50% upside move appears realistic in the short term, especially as broader market sentiment improves and capital flows into altcoins with solid setups.
Investor interest is steadily increasing in CITY, particularly among those looking for mid-cap tokens with technical clarity and potential for near-term growth. The recent price structure suggests bullish divergence is at play, and breakout traders will likely be targeting higher resistance zones to secure gains. This coin could be setting up for a sustained recovery rally if buyers maintain control.
This is a great moment for those watching CITYUSDT closely. The pattern breakout and rising volume could make this a high-reward opportunity if current momentum holds. As always, risk management and confirmation are key for optimal entries.
✅ Show your support by hitting the like button and
✅ Leaving a comment below! (What is You opinion about this Coin)
Your feedback and engagement keep me inspired to share more insightful market analysis with you!
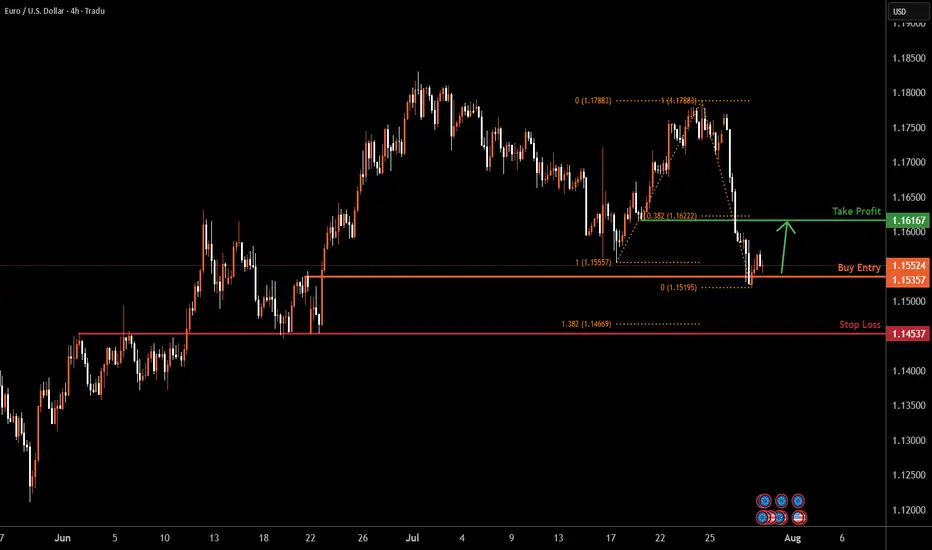
EURUSD | H4 Bullish bounce offBased on the H4 chart analysis, the price is reacting off the support level, which is a pullback support, and could rise higher.
Buy entry is at 1.1535, which is a pullback support.
Stop loss is at 1.1453, which is an overlap support that is underneath the 138.2% Fibonacci extension.
Take profit is at 1.1616, which is a pullback resistance that aligns with the 38.2% Fibonacci retracement.
High Risk Investment Warning
Trading Forex/CFDs on margin carries a high level of risk and may not be suitable for all investors. Leverage can work against you.
Stratos Markets Limited (tradu.com ):
CFDs are complex instruments and come with a high risk of losing money rapidly due to leverage. 65% of retail investor accounts lose money when trading CFDs with this provider. You should consider whether you understand how CFDs work and whether you can afford to take the high risk of losing your money.
Stratos Europe Ltd (tradu.com ):
CFDs are complex instruments and come with a high risk of losing money rapidly due to leverage. 66% of retail investor accounts lose money when trading CFDs with this provider. You should consider whether you understand how CFDs work and whether you can afford to take the high risk of losing your money.
Stratos Global LLC (tradu.com ):
Losses can exceed deposits.
Please be advised that the information presented on TradingView is provided to Tradu (‘Company’, ‘we’) by a third-party provider (‘TFA Global Pte Ltd’). Please be reminded that you are solely responsible for the trading decisions on your account. There is a very high degree of risk involved in trading. Any information and/or content is intended entirely for research, educational and informational purposes only and does not constitute investment or consultation advice or investment strategy. The information is not tailored to the investment needs of any specific person and therefore does not involve a consideration of any of the investment objectives, financial situation or needs of any viewer that may receive it. Kindly also note that past performance is not a reliable indicator of future results. Actual results may differ materially from those anticipated in forward-looking or past performance statements. We assume no liability as to the accuracy or completeness of any of the information and/or content provided herein and the Company cannot be held responsible for any omission, mistake nor for any loss or damage including without limitation to any loss of profit which may arise from reliance on any information supplied by TFA Global Pte Ltd.
The speaker(s) is neither an employee, agent nor representative of Tradu and is therefore acting independently. The opinions given are their own, constitute general market commentary, and do not constitute the opinion or advice of Tradu or any form of personal or investment advice. Tradu neither endorses nor guarantees offerings of third-party speakers, nor is Tradu responsible for the content, veracity or opinions of third-party speakers, presenters or participants.