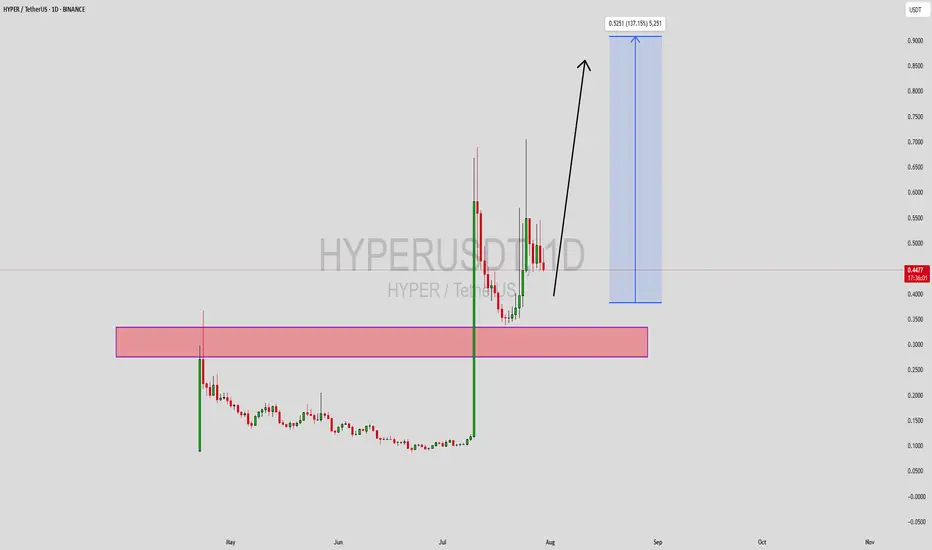
HYPERUSDT Forming Bullish ContinuationHYPERUSDT is capturing significant attention as it emerges from a consolidation zone, signaling a potential bullish continuation. After a massive impulse move to the upside, the price found support at a critical zone, which has now flipped into a demand area. This area is acting as a strong base for buyers, with volume steadily increasing—a key indication of accumulation and renewed interest from market participants.
Currently, the price is forming a structure that reflects bullish momentum, supported by recent higher lows and increased wick rejections from below. This kind of setup often precedes a strong breakout, especially when reinforced by strong volume, as seen here. The chart suggests a potential upside move of over 130%, targeting previous liquidity zones and untouched resistance areas, as buyers step in aggressively.
HYPER is becoming a trending topic in the altcoin space, with investors closely watching its price action for signs of a full recovery. As trading sentiment shifts bullish and on-chain metrics support the narrative, HYPERUSDT stands out as one of the higher potential mid-cap coins. A breakout beyond recent highs could quickly accelerate gains, given the relatively thin resistance levels above.
This setup is ideal for breakout traders and swing positions, especially as the broader market regains confidence. Patience and technical confirmation will be key, but HYPERUSDT is positioning itself as a standout opportunity for the weeks ahead.
✅ Show your support by hitting the like button and
✅ Leaving a comment below! (What is You opinion about this Coin)
Your feedback and engagement keep me inspired to share more insightful market analysis with you!
Harmonic Patterns
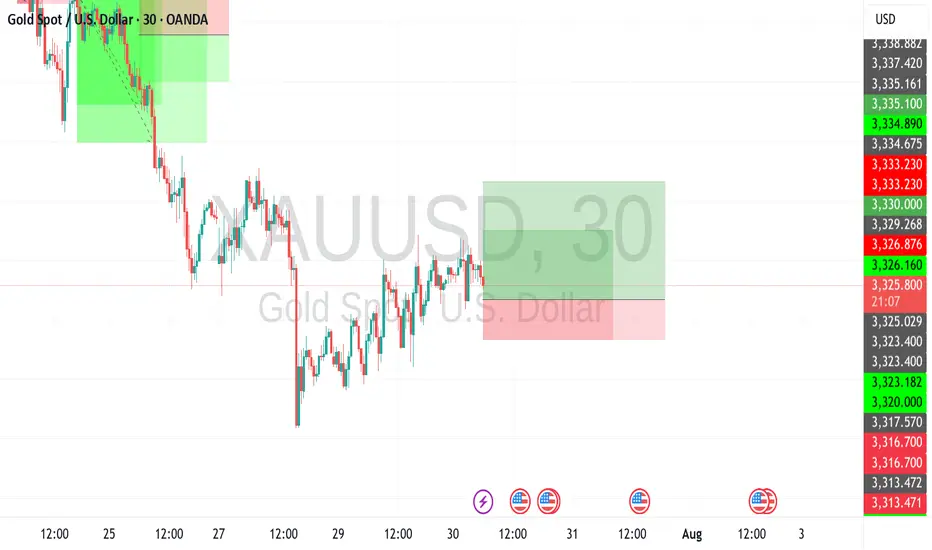
XAUUSDXAUUSD Updated in 30M :
The gold signal is marked on the chart based on the latest price changes and the supply and demand in the market. These points include the entry point, stop loss, and take profit
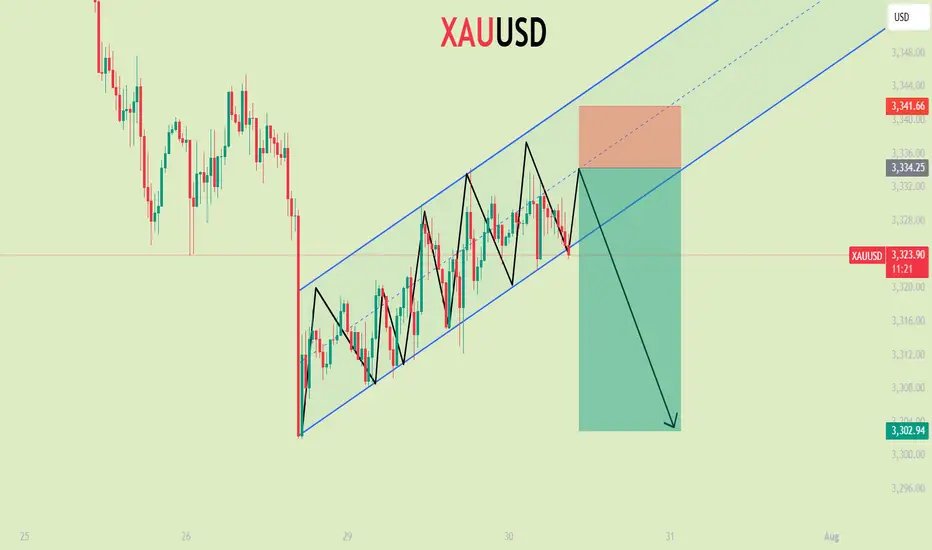
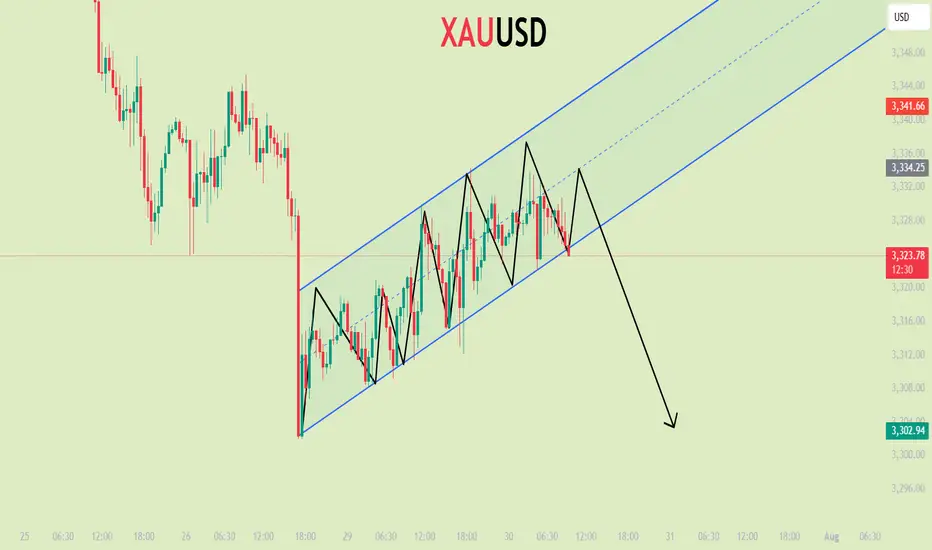
XAUUSDXAUUSD Updated in 30M :
The gold signal is marked on the chart based on the latest price changes and the supply and demand in the market. These points include the entry point, stop loss, and take profit
GBPUSD H4 | Bearish continuationThe Cable (GBP/USD) is rising toward a pullback resistance level and may reverse from this point, potentially dropping lower.
Buy entry is at 1.3391, located at a pullback resistance.
Stop loss is at 1.3460, also a pullback resistance, positioned slightly above the 50% Fibonacci retracement.
Take profit is at 1.3318, which is a pullback support level.
High Risk Investment Warning
Trading Forex/CFDs on margin carries a high level of risk and may not be suitable for all investors. Leverage can work against you.
Stratos Markets Limited (tradu.com ):
CFDs are complex instruments and come with a high risk of losing money rapidly due to leverage. 65% of retail investor accounts lose money when trading CFDs with this provider. You should consider whether you understand how CFDs work and whether you can afford to take the high risk of losing your money.
Stratos Europe Ltd (tradu.com ):
CFDs are complex instruments and come with a high risk of losing money rapidly due to leverage. 66% of retail investor accounts lose money when trading CFDs with this provider. You should consider whether you understand how CFDs work and whether you can afford to take the high risk of losing your money.
Stratos Global LLC (tradu.com ):
Losses can exceed deposits.
Please be advised that the information presented on TradingView is provided to Tradu (‘Company’, ‘we’) by a third-party provider (‘TFA Global Pte Ltd’). Please be reminded that you are solely responsible for the trading decisions on your account. There is a very high degree of risk involved in trading. Any information and/or content is intended entirely for research, educational and informational purposes only and does not constitute investment or consultation advice or investment strategy. The information is not tailored to the investment needs of any specific person and therefore does not involve a consideration of any of the investment objectives, financial situation or needs of any viewer that may receive it. Kindly also note that past performance is not a reliable indicator of future results. Actual results may differ materially from those anticipated in forward-looking or past performance statements. We assume no liability as to the accuracy or completeness of any of the information and/or content provided herein and the Company cannot be held responsible for any omission, mistake nor for any loss or damage including without limitation to any loss of profit which may arise from reliance on any information supplied by TFA Global Pte Ltd.
The speaker(s) is neither an employee, agent nor representative of Tradu and is therefore acting independently. The opinions given are their own, constitute general market commentary, and do not constitute the opinion or advice of Tradu or any form of personal or investment advice. Tradu neither endorses nor guarantees offerings of third-party speakers, nor is Tradu responsible for the content, veracity or opinions of third-party speakers, presenters or participants.

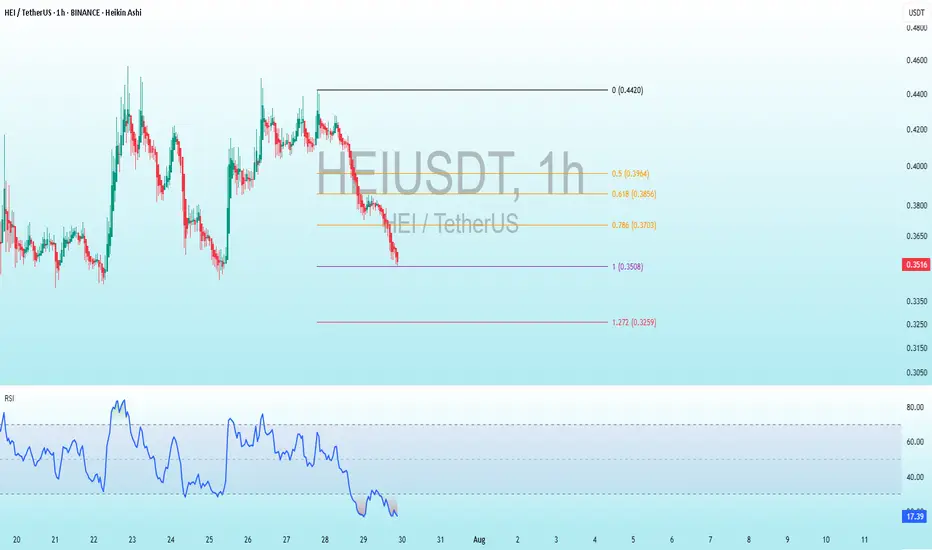
HEI Bullish DivergenceBINANCE:HEIUSDT
Trade Setup:
Target 1: 0.3703 (0.786 Fibonnaci Golden Zone).
Target 2: 0.3856 (0.618 Fibonnaci Golden Zone).
Target 3: 0.3964 (0.5 Fibonnaci Golden Zone).
Target 4: 0.4420 (0 Fibonnaci).
Stop Loss: 0.3259 (1.272 Fibonnaci).
RSI Analysis: The RSI is showing a bullish divergence, suggesting potential bullish momentum. The current RSI is around 17.39, approaching oversold territory, so caution is advised.
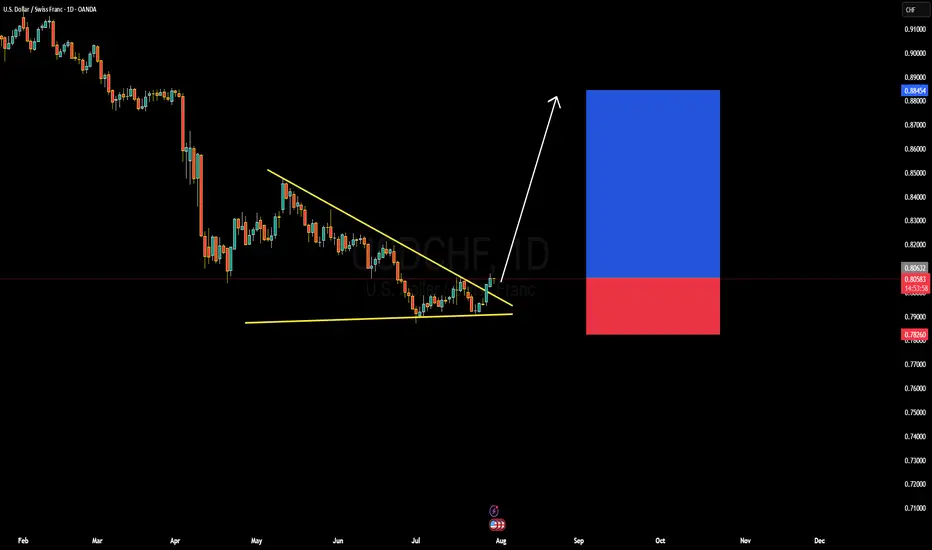
USDCHF Forming Falling WedgeUSDCHF has recently broken out of a falling wedge pattern on the daily timeframe, which is typically a bullish reversal signal. After an extended period of compression and lower highs, the pair has pierced above the descending trendline with strong bullish momentum. This breakout indicates a shift in sentiment, and we are now seeing early signs of a potential trend reversal to the upside. The structure suggests the market could target higher levels, with immediate resistance near the 0.8200–0.8300 zone and extended upside potential toward 0.8800.
From a macro perspective, the US dollar is gaining traction again, supported by firm US GDP growth and persistent inflation pressures, which keep the Federal Reserve in a cautious stance. Investors are now reassessing rate cut expectations, with Fed officials emphasizing data-dependency. On the other hand, the Swiss franc is seeing slight weakness as the Swiss National Bank remains dovish compared to other central banks. The widening monetary policy divergence favors dollar strength in the short to medium term.
Technically, the breakout above the wedge confirms buyer dominance, and with the RSI and MACD turning bullish, momentum favors continuation to the upside. The risk-to-reward remains attractive with a tight invalidation level below the recent lows around 0.7820. Price action traders may consider entering on minor pullbacks toward the breakout zone, with eyes on retesting the previous swing highs.
Overall, USDCHF presents a clean bullish setup following the breakout of a falling wedge pattern. With solid confluence from both technical and fundamental angles, this pair is poised for further gains in the coming sessions. Patience and confirmation remain key, but the structure supports a long bias for those aligned with momentum
30.07.25 Morning ForecastPairs on Watch -
FX:AUDUSD
FX:NZDUSD
FX:EURUSD
A short overview of the instruments I am looking at for today, multi-timeframe analysis down to what I will be looking at for an entry. Enjoy!

GBPUSD Forming Rising WedgeGBPUSD is currently showing a clear breakdown from a rising wedge pattern on the daily timeframe—a classic bearish signal. After a prolonged bullish channel, price has decisively broken below the lower trendline support, confirming a shift in momentum. The pair is now approaching a major demand zone around the 1.3100–1.3150 area, which previously acted as a strong support level. Based on price action structure, further downside movement is anticipated until price retests that zone for potential reaction.
From a fundamental perspective, the pound has come under pressure as UK economic data has started to show signs of softening. Slower retail sales, weakening PMI numbers, and sticky inflation are weighing on the British currency. Meanwhile, the US dollar remains firm, supported by a hawkish stance from the Federal Reserve and strong US GDP data. As markets continue to price in the possibility of another rate hike or a longer pause in rate cuts, dollar strength is expected to persist—adding bearish weight to GBPUSD.
Technically, the breakdown from the wedge pattern confirms a bearish reversal structure. The current bearish leg is aligned with increasing downside momentum, and if price sustains below 1.3360, the next key target sits around the 1.3200 zone. This area also aligns with previous consolidation and could serve as a temporary floor. However, a break below that zone may expose deeper targets toward 1.3050 in the medium term.
Overall, the bias for GBPUSD remains bearish unless there is a strong bullish reversal signal. For now, trend-following traders may look to sell the rallies, keeping an eye on key support levels for signs of exhaustion. The current setup offers a good risk-to-reward opportunity with confirmation from both technical breakdown and macroeconomic headwinds.

VRA/USDT THE RETURN TO KEY LEVELVra has good chance to return to the key level, since the last data shows a growth in the volume.

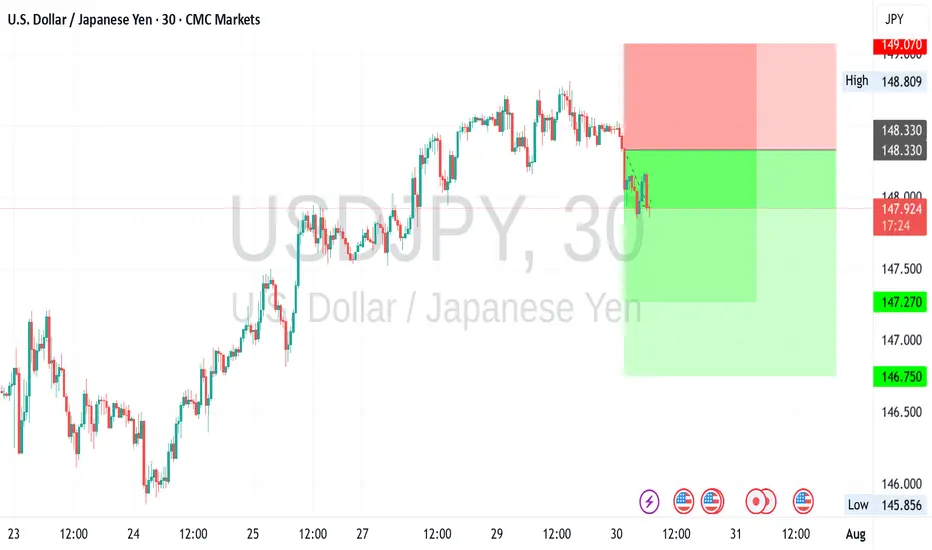
USDJPY Confirmed that the currency pair has been dominatedConfirmed that the currency pair has been dominated by the short side in the short term through high-frequency aggregated reasoning on the time-sharing K-line pattern, capital turnover bias, and short-cycle public opinion winds, especially suggests that under the current market conditions, investors need to be wary of what appears to be a mild rebound but is actually a long-drawn-out trap.
The trading spectrum chart tracked by the system shows that short high-frequency accounts have continued to maintain a steady increase in positions in recent trading cycles, while long transactions have shrunk significantly, with an obvious structural imbalance. Words like "conservative", "position reduction" and "trend risk" have proliferated in the public opinion platform, and the dominant market sentiment has shifted to defense.
What's more, multiple signals have formed a "negative resonance", including: macro pressure, net outflow of capital, weakening of technical rebound, and investors' mentality turning cold.
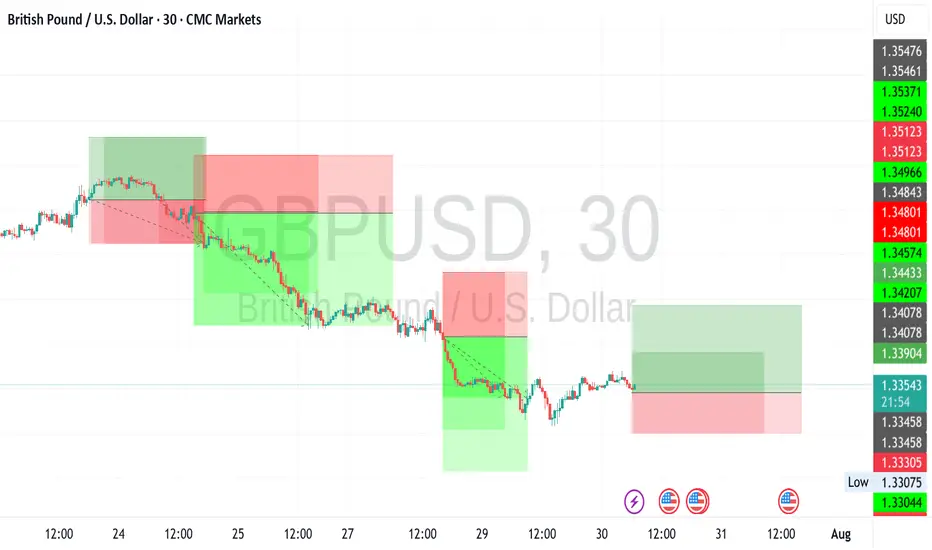
GBPUSD long Especially after some key economies announced higherCombined with the global market news sentiment, social platform dynamics and real-time capital flow situation, comprehensive judgment of the current foreign exchange market long and short pattern of positive changes. Especially after some key economies announced higher-than-market-expected GDP and inflation control results, the market's judgment on the future economic cycle tends to be positive.
The system monitored the rise of terms such as "return of growth", "confirmation of inflection point" and "confidence restoration" in social media and financial opinions, reflecting that market sentiment is shifting from wait-and-see to optimism. At the same time, the risk aversion mood edge down, risky asset allocation ratio rose, especially conducive to part of the high correlation between the performance of the currency pair repair.
Flow of funds data show that some large institutions since last week began to make up for the previous reduction in foreign exchange positions, the volume of transactions increased significantly, This is a positive reaction to the policy shift and improved economic data. Against this backdrop, the current formation of long momentum has a certain degree of sustainability.
Gold recently experienced a typical "suppression and release"Capital dynamics and sentiment modeling, found that the gold market has recently experienced a typical "suppression and release" type of reaction. After a period of sustained pressure on the emotional background, the dominant force of the short side began to weaken, and both long and short sentiment tends to be balanced, and the logic of gold as a safe-haven asset has been re-explored and recognized.
This type of trend is often non-explosive, but through the emotional layers of repair and structural slow reversal of the gradual unfolding. The current signal strength has reached the bearish threshold set by the system, with a certain operational feasibility.
It is recommended that traders try to follow up with a low percentage of positions, but still need to retain enough position space to cope with the possible continuation of fluctuations. The whole layout is mainly defensive and offensive, and it is appropriate to seek progress in a stable manner.
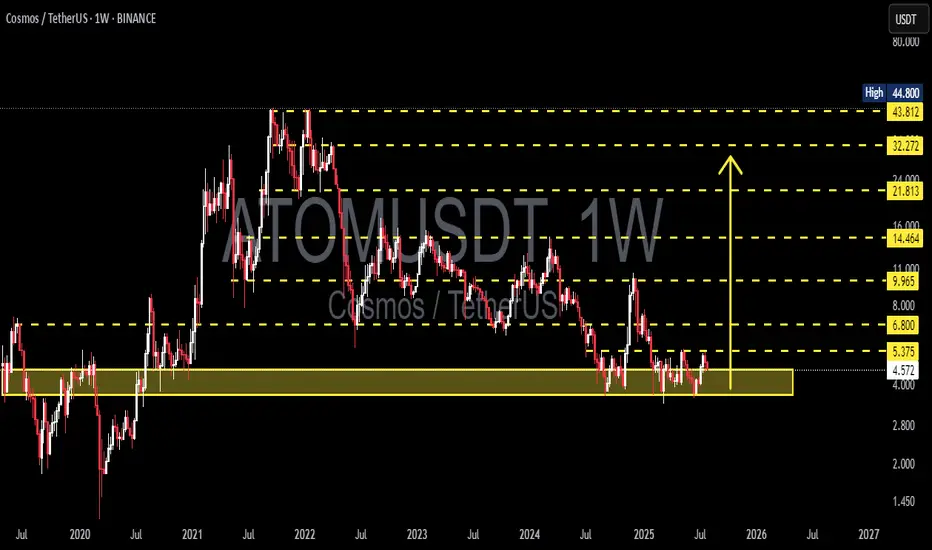
ATOM/USDT Weekly Analysis – Major Reversal Incoming?🔍 Technical Structure & Price Action:
ATOM has been in a prolonged downtrend since peaking at $44.80 in 2022, forming consistent lower highs and lower lows. However, the price has recently returned to a major long-term demand zone between $4.00 – $5.37, which has historically acted as a strong support since 2020.
The price is showing a bullish reaction from this level, indicating a potential trend reversal or relief rally.
---
🧱 Key Levels & Technical Zones:
Level Role
$4.00 - $5.37 Major Historical Demand Zone (Strong Support) 🟨
$6.80 Minor Resistance & Double Bottom Neckline
$9.96 Mid-Term Key Resistance
$14.46 Next Bullish Target If Breakout Holds
$21.81 Major Resistance Ahead
$32.27 - $43.81 Long-Term Distribution Zone / ATH Range
$44.80 All-Time High (ATH)
---
📐 Patterns and Price Behavior:
🟡 1. Potential Double Bottom (Reversal Pattern)
The price appears to be forming a double bottom structure with a neckline around $6.80. A successful breakout above this level could signal a confirmed trend reversal.
🟡 2. Sideways Accumulation
ATOM has been ranging sideways within a tight zone, suggesting institutional accumulation before a possible impulse breakout.
🟡 3. Volume Compression
Declining volume near support often precedes a strong breakout move, either up or down.
---
✅ Bullish Scenario:
Price continues to hold above the $4.00 – $5.37 demand zone.
If weekly candle closes above $6.80, bullish confirmation is triggered.
Potential targets:
Short-Term: $9.96
Mid-Term: $14.46 – $21.81
Long-Term: $32.27 – $43.81 (if momentum sustains)
📈 Confirmation Signs:
Break and weekly close above $6.80
Increasing breakout volume
RSI divergence from oversold territory
---
⚠️ Bearish Scenario:
If price breaks down below $4.00, bears could regain control.
Possible downside targets:
Next Support: $2.80
Breakdown invalidates the double bottom structure
Continuation of macro downtrend likely
📉 Confirmation Signs:
Strong weekly close below $4.00
Spike in selling volume
Failure to break $6.80 resistance
---
🎯 Conclusion & Strategy:
ATOM is sitting at a make-or-break level, where a strong historical support zone meets growing bullish momentum. If bulls manage to break above $6.80, it could trigger a multi-week rally toward mid-term targets. This setup presents a high reward-to-risk opportunity if managed correctly.
---
⚙️ Trading Strategy Suggestion:
Aggressive Entry: Within $5.00 - $5.37 zone, stop loss below $4.00
Conservative Entry: After confirmed breakout above $6.80
Take-Profit Zones: $9.96 → $14.46 → $21.81
Risk Management is a MUST 🚨
#ATOMUSDT #Cosmos #CryptoAnalysis #DoubleBottom #AltcoinOutlook #TechnicalAnalysis #SupportResistance #PriceAction #CryptoTrading #BreakoutWatch #TrendReversal
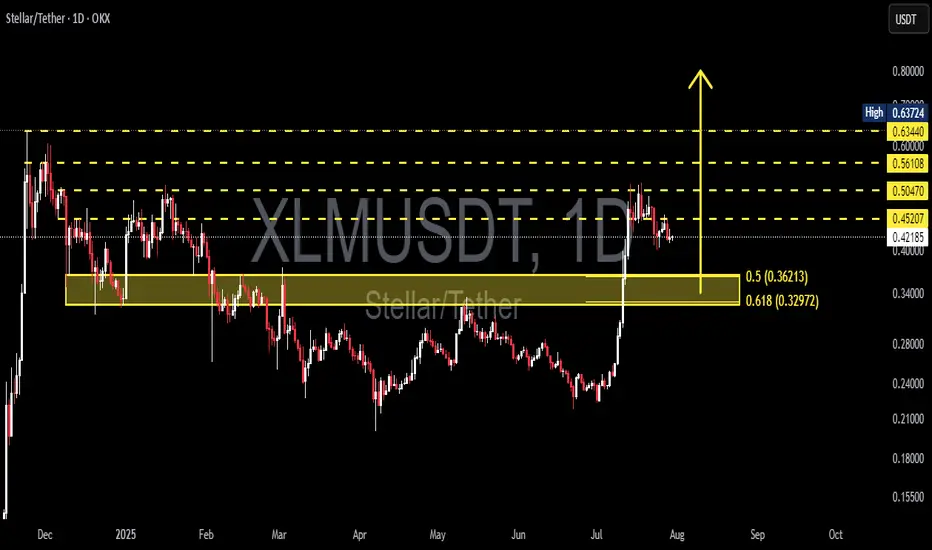
XLMUSDT – Accumulation Phase or the Start of a Major Breakout?🔍 Market Overview:
Stellar (XLM) against USDT is showing a technically significant structure. After breaking above a long-standing consolidation zone, price is now in a mild corrective phase, retesting previous resistance as new support. This setup suggests a critical decision point — will XLM confirm a bullish continuation, or was it a false breakout before further decline?
---
📌 Key Price Levels:
✅ Strong Demand Zone (Historical Support + Fibonacci Confluence)
XLM recently surged from the zone between $0.32972–$0.36213, which coincides with:
Fibonacci retracement levels: 0.5 (0.36213) & 0.618 (0.32972) from the recent swing low
A multi-tested support/resistance zone, now acting as a major demand area
This zone is currently the most critical support region for bulls to defend.
❌ Layered Resistance Zones (Bullish Targets Ahead)
If upward momentum resumes, watch these key resistance levels:
0.45207 → Nearest resistance
0.50470 → Structural resistance
0.56108 → Mid-range psychological barrier
0.60000 → Historical resistance zone
0.63440 → Medium-term technical target
0.63724 → Local swing high
---
📈 Bullish Scenario:
> "As long as price holds above the demand zone without printing lower lows, the bullish bias remains valid."
1. Bullish continuation confirmed with a daily close above $0.45207, ideally supported by strong volume.
2. A bullish continuation pattern (e.g., flag or pennant) may be forming.
3. Short-term targets extend to $0.50470–$0.56108, with a mid-term outlook toward $0.63+.
4. Macro sentiment or altcoin market momentum could act as a breakout catalyst.
---
📉 Bearish Scenario:
> "A breakdown below the demand zone could trigger a bearish trend reversal."
1. Failure to hold $0.42 could trigger a deeper pullback to $0.36–$0.33 zone.
2. A confirmed breakdown below $0.32972 (Fibo 0.618) invalidates bullish structure, possibly starting a new downtrend (Lower Lows).
3. Watch for potential bearish divergence if price gets rejected around $0.45–$0.50 area.
---
📐 Chart Pattern & Market Structure:
Currently showing a developing Higher High & Higher Low (HH-HL) structure — a sign of early trend reversal.
Price may be forming a Bullish Rectangle or Ascending Triangle, depending on future break direction.
This pullback appears to be a healthy retest, not a trend reversal (yet).
---
🧠 Strategy & Trader Insights:
Swing traders may look to enter near $0.36–$0.38, with tight stops below $0.32.
Breakout traders should wait for a clear breakout and close above $0.45207 before entering.
Avoid chasing trades in the middle of the range — wait for confirmation or rejection at key levels.
---
💬 Final Thoughts:
This is a high-potential setup for XLM, provided the current support structure holds. The demand zone is acting as a critical foundation for any bullish continuation. However, risk management is essential as the market approaches a key decision point.
#XLMUSDT #Stellar #CryptoAnalysis #AltcoinSeason #PriceAction #SupportResistance #TechnicalAnalysis #FibonacciLevels #BreakoutSetup
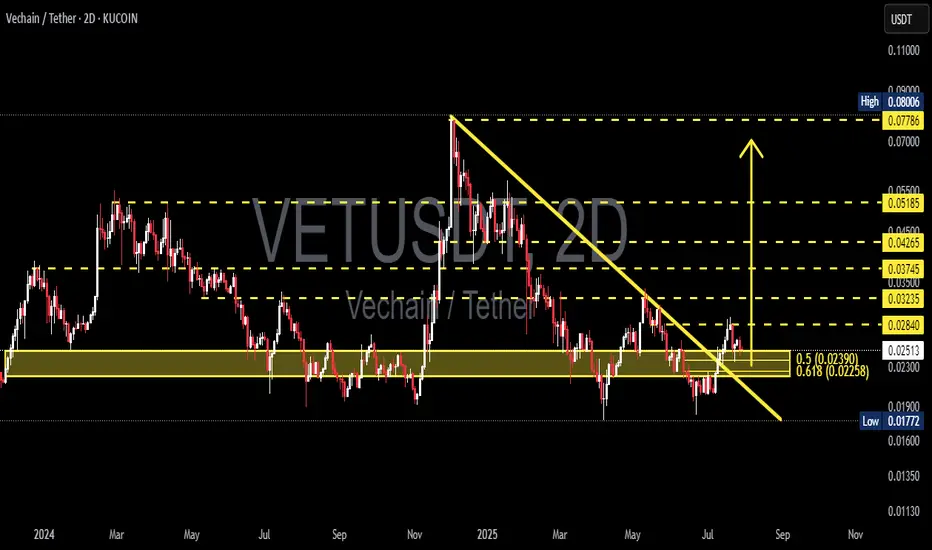
VET/USDT – Golden Pocket Retest After Breakout!🧠 Overview: Is VeChain About to Flip Bullish?
The 2D VET/USDT chart (KuCoin) is presenting a high-potential setup. After months of downward pressure, VET has finally broken above a long-standing descending trendline, which has been intact since early 2025.
Now, price is retesting a major support zone—which also happens to be the Golden Pocket of the Fibonacci retracement (0.5–0.618). This area is crucial for confirming whether this is a real trend reversal or just another fakeout.
---
🧩 Technical Structure & Key Levels
📍 Descending Trendline (Broken)
A clear breakout from the downtrend that started in February 2025.
First signal of a potential trend reversal.
📍 Critical Support Zone – Golden Pocket
Range: 0.02258 – 0.02390 USDT
Aligns with Fibonacci 0.5–0.618 retracement from recent swing low to high.
Acts as a historically strong horizontal support — now being retested after the breakout.
📍 Fibonacci Resistance Levels (Upside Targets)
Level Price (USDT)
Resistance 1 0.02840
Resistance 2 0.03235
Resistance 3 0.03745
Resistance 4 0.04265
Resistance 5 0.05185
Extended High 0.07786 – 0.08006
📍 Major Support (Last Line of Defense)
0.01772 USDT, the lowest level seen since late 2023.
---
✅ Bullish Scenario – Valid Retest & Reversal
If the Golden Pocket zone holds, we could see:
Continuation of bullish momentum
Gradual move toward:
🎯 0.02840 as the first resistance
🎯 0.03235 – 0.03745 as mid-term targets
🎯 0.04265 – 0.05185 if momentum strengthens
Potential formation of an Inverse Head & Shoulders pattern, signaling a strong reversal base
---
❌ Bearish Scenario – Failed Retest
If price fails to hold the 0.02258–0.02390 support zone:
We may see a move back down toward 0.01772 USDT
This would invalidate the bullish breakout (false breakout scenario)
The longer-term downtrend could resume
> ⚠️ Beware of a potential bull trap around 0.025–0.026 — price rejection here could signal a failed breakout.
---
🧠 Current Price Action Pattern
✅ Descending Trendline Breakout → early bullish signal
🔁 Golden Pocket Retest → now in progress, critical for direction confirmation
📈 Reversal Potential → watching for Inverse Head & Shoulders formation
---
💡 Conclusion
VET/USDT is at a make-or-break level. The breakout above the descending trendline is promising, but the current retest of the Golden Pocket zone is the real test for bulls. If this level holds, we could be witnessing the early stages of a trend reversal with multiple upside targets in play.
#VETUSDT #VeChain #CryptoBreakout #FibonacciLevels #GoldenPocket #AltcoinAnalysis #InverseHeadAndShoulders #TrendReversal #CryptoTechnicalAnalysis #SupportResistance #CryptoSignals
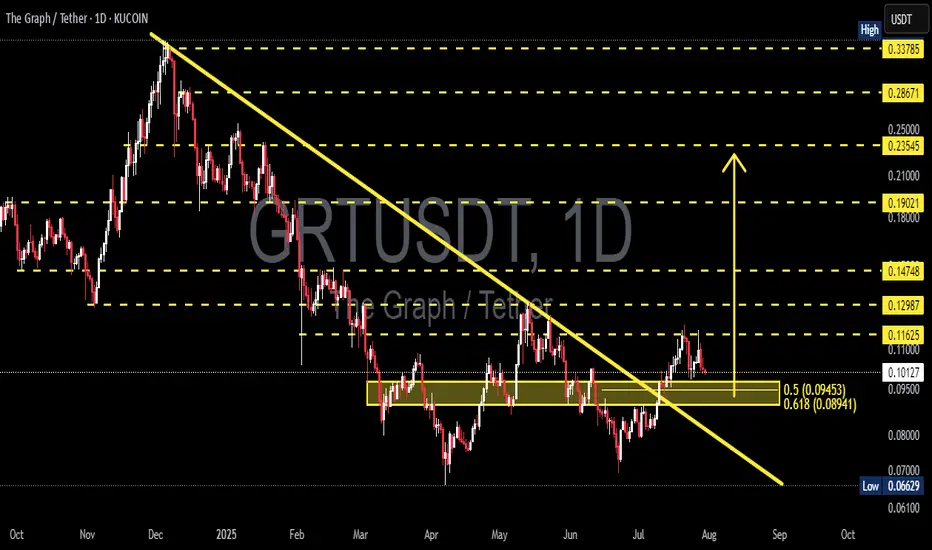
GRT/USDT at a Crossroads: Golden Pocket Retest or Breakdown?The GRT/USDT chart is currently at a critical technical juncture, presenting a high-probability setup for both breakout continuation or breakdown rejection. Here’s a breakdown of the key elements visible on the chart:
---
📐 1. Major Downtrend Breakout
GRT has been in a long-term downtrend since its peak in late 2024, with a well-respected descending trendline acting as resistance.
In mid-July 2025, the price broke above this trendline, signaling a potential trend reversal from bearish to bullish.
While volume was moderate, the breakout is technically valid.
---
📊 2. Golden Pocket Fibonacci Retest
Price is currently retesting the critical Fibonacci retracement zone:
0.5 = $0.09453
0.618 = $0.08941
This range is widely known as the “Golden Pocket”, a high-probability bounce zone during bullish continuation setups.
Price is currently sitting inside this zone, which makes this a potential low-risk entry area.
---
🧱 3. Key Historical Consolidation Zone
The area between $0.089 and $0.095 is not only the golden pocket but also aligns with a strong historical consolidation zone from April to June 2025.
This level acted as both support and resistance, making it a key technical and psychological level.
---
⚔️ Potential Price Scenarios
---
📈 Bullish Scenario (Upside Potential):
If price holds and bounces from the $0.089 – $0.095 support zone:
1. Initial resistance targets:
$0.10185 to $0.11000
2. Followed by breakout targets:
$0.11625
$0.12987
$0.14748
3. Medium-term bullish targets if trend continues:
$0.19021
$0.23545
📌 Bullish Confirmation Signs:
Bullish engulfing or strong reversal candle on the daily close.
Increased volume on the bounce.
RSI recovery from neutral (30–50) zone.
---
📉 Bearish Scenario (Downside Risk):
If price fails to hold above the $0.08941 Fibonacci level:
1. A breakdown below support may trigger further selling pressure.
2. Key downside targets:
$0.08000 (minor support)
$0.06629 (previous swing low)
📌 Bearish Confirmation Signs:
Daily close below $0.089 with strong bearish volume.
RSI drops below 30.
Strong rejection from resistance with bearish structure.
---
🧠 Pattern and Market Structure Insights
Breakout + Retest: Classic setup where price breaks a long-term trendline and returns to retest the breakout zone.
Fibonacci Confluence: The golden pocket aligns with previous price structure, reinforcing its strength.
Hidden Double Bottom (Potential): If price holds, this may also form a subtle double bottom structure — a bullish continuation signal.
---
📚 Conclusion & Trading Strategy
GRT/USDT is currently showing a technically strong setup, with a clean breakout followed by a meaningful retest at a key demand zone.
💡 If you're looking for a strategic long entry, this area offers low risk, high reward potential, provided you manage your stop-loss correctly.
---
🎯 Trade Idea & Risk Management
Potential Entry: $0.089 – $0.095
Conservative Stop Loss: Below $0.088
Initial Target Zone: $0.101 – $0.116
Mid-term Target: $0.19 – $0.23
#GRT #GRTUSDT #TheGraph #AltcoinAnalysis #CryptoBreakout #TechnicalAnalysis #CryptoTrading #FibonacciLevels #TrendlineBreak #GoldenPocket #BullishSetup #BearishBreakdown #CryptoEducation #Altcoins
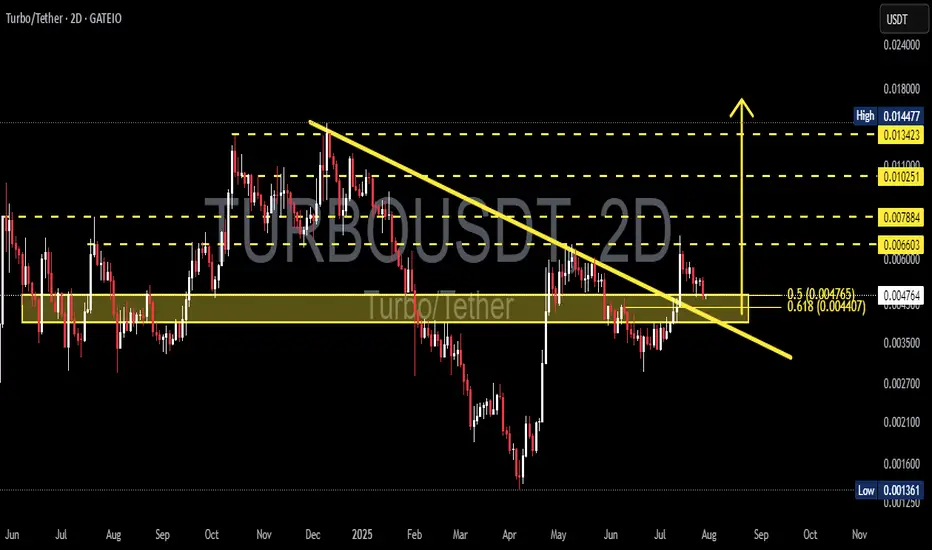
TURBO/USDT: Critical Decision Point – Breakout or Bull Trap?🧩 Overview
TURBO/USDT is currently sitting at a decisive technical juncture. After a prolonged downtrend since its late 2024 peak, the price has recently shown signs of a momentum shift by breaking out from a major descending trendline. The key question now: Is this the beginning of a bullish reversal, or just a temporary fakeout?
---
📉 Pattern Breakdown
Descending Triangle Breakout (Confirmed)
This classical bearish continuation pattern had formed since November 2024 with consistent lower highs. The recent breakout to the upside suggests a shift in market sentiment.
Historical Accumulation Zone (Demand Zone)
The yellow horizontal box (around 0.0042 – 0.0047 USDT) has acted as a strong historical accumulation and reaction area.
Golden Pocket Retest (Fibonacci 0.5 – 0.618)
The price is currently retesting the golden pocket retracement zone, which often acts as a decision zone for institutional buyers and swing traders.
---
📈 Bullish Scenario (Breakout Confirmation)
If the price holds above the golden pocket zone and prints a higher low, we could see:
🎯 Next Bullish Targets:
0.00660 USDT – Minor resistance
0.00788 USDT – Psychological level
0.01025 USDT – Mid-range resistance
0.01342 USDT – Major key level before recent highs
0.01447 USDT – Local high and full breakout target
✅ Bullish Confirmation:
A strong 2D candle close above 0.0066 with rising volume would validate the bullish breakout and signal continuation.
---
📉 Bearish Scenario (Fakeout Risk)
If price fails to hold the 0.0044 – 0.0047 USDT range and breaks back down:
🔻 Bearish Targets:
0.0035 USDT – Previous local support
0.0025 USDT – Old consolidation zone
0.00136 USDT – All-time low (last defense level)
❗️Bearish Confirmation:
A breakdown below 0.0044 USDT with bearish volume would invalidate the breakout and open the door for deeper downside.
---
🧠 Additional Insights
The initial breakout had solid volume, but current price action is testing the breakout validity.
RSI or momentum indicators (not shown here) should be monitored for divergence or confluence with this setup.
---
📌 Conclusion
> TURBO/USDT is at a make-or-break moment. While the breakout from the descending triangle is a strong bullish signal, the retest of the golden pocket zone must hold to confirm the trend reversal. Failure to do so could turn this into a bull trap with deeper downside risk.
⏳ Eyes on this level — market is choosing a direction.
#TURBO #USDT #CryptoAnalysis #BreakoutOrFakeout #TechnicalAnalysis #DescendingTriangle #FibonacciGoldenPocket #BullishScenario #BearishScenario #AltcoinWatch #CryptoTrading
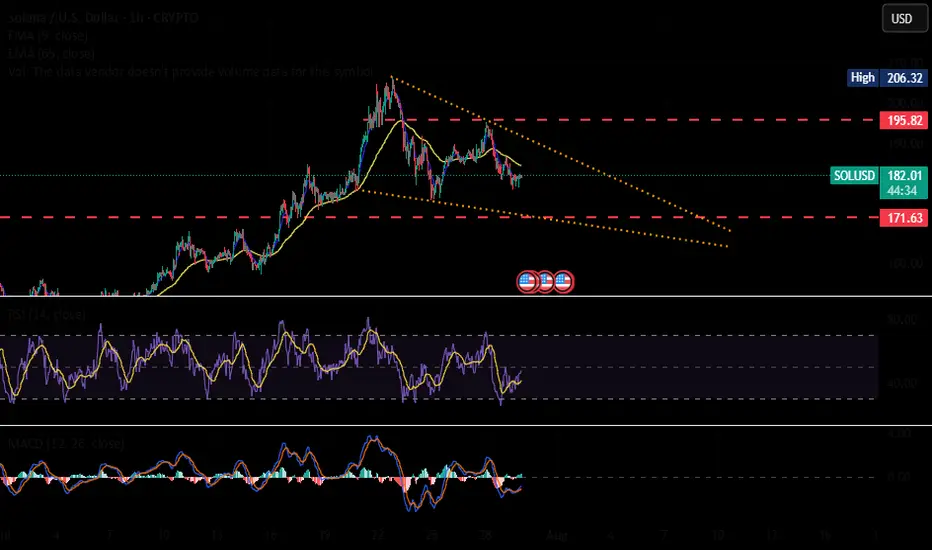
$SOL🚨 CRYPTOCAP:SOL Bullish Flag Forming 🚨
Solana is currently setting up a clean bullish flag pattern. We’re watching the $195 level closely a breakout above that zone could confirm a continuation to the upside.
However, confirmation is key we’ll need to see strong momentum and volume to validate the move.
👀 On the downside, there's liquidity building around $171. If price dips into that zone, we might see buyer activity spike possibly creating a new wave of volatility.
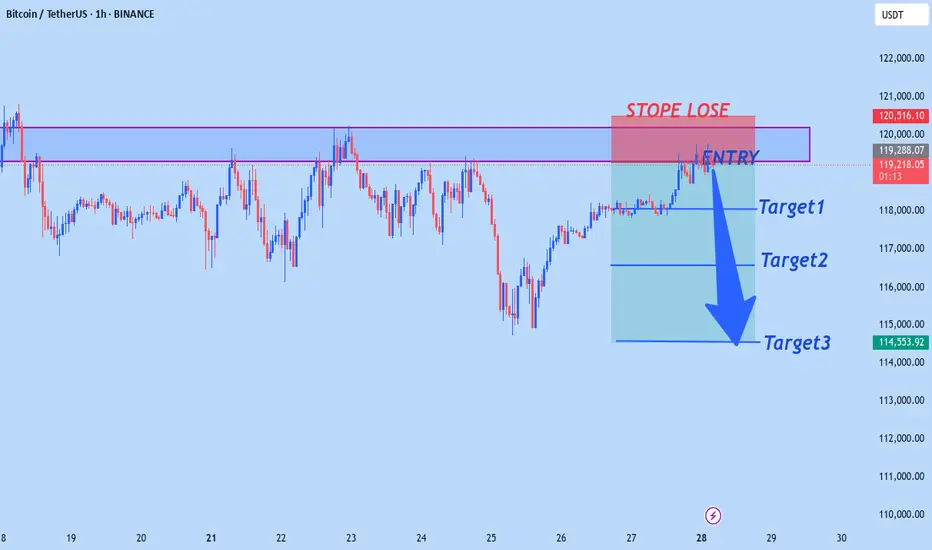
BTCUSD WILL FALLING SOONBtcusd sell from 119,200
Target1 118,000
Target2 116,500
Tagret3 114,500
StopeLose 120,500
Trade at your own risk
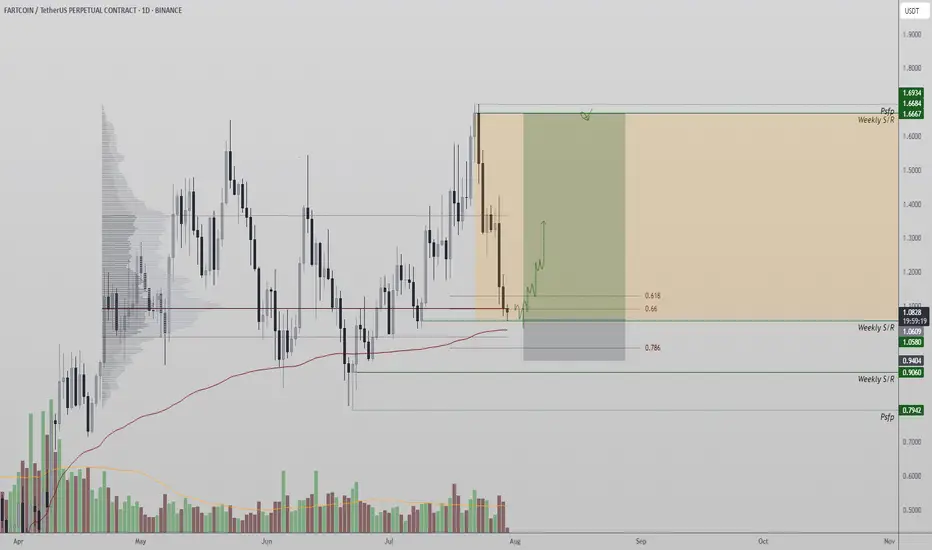
Fartcoin Tests Major Support Zone: Will a Reversal Emerge?Fartcoin has reached a critical support zone that may serve as the foundation for a potential reversal. Traders are closely watching this level for signs of a bottoming structure before confirming a trade.
Price action is now testing the $1.05 region—a key technical support level with multiple overlapping indicators. This zone is not just a psychological round number, but also aligns with the point of control (POC), the VWAP-based support-resistance (VWAPSR), the value area low, and the 0.618 Fibonacci retracement. This confluence makes it a prime candidate for a potential bullish reaction if buyers step in and form a structural base.
Key Technical Points:
- Support at $1.05: Aligns with the POC, VWAPSR, value area low, and 0.618 Fibonacci
- Reversal Watch: A bottoming structure needs to form on the daily timeframe for confirmation
- Key Level for Trade Setup: Current price region offers a technical point of interest, but confirmation is still required
The current zone at $1.05 has become a focal point for market participants due to its technical significance. It represents a major area of price memory and historical volume interaction, making it an ideal level to monitor for a shift in trend. However, while price has arrived at this zone, it has not yet shown clear signs of reversal or structural confirmation.
A reversal from this level would require the formation of a bottoming pattern—such as a double bottom, bullish divergence, or a higher low structure—on the daily timeframe. Without such a structure in place, any bounce should be treated with caution. The current environment presents potential, but a well-defined entry model needs to materialize before considering an actionable trade.
From a broader market structure perspective, the $1.05 region stands out as a potential inflection point. The fact that it aligns with so many technical metrics—POC, VWAPSR, value area low, and the 0.618 Fib—adds credibility to the level as a valid support zone. If a bullish setup forms and volume begins to build from here, the probability of a reversal increases, potentially initiating a new leg toward recent highs.
What to Expect in the Coming Price Action
Fartcoin is trading at a high-confluence support level where a reversal could begin forming. Traders should closely monitor for structural confirmation and volume influx to validate a long setup. Without a bottoming structure, further downside remains possible, but the current level offers an attractive technical area for a potential reversal to develop.
Sell EURGBP now for a quick scalping Sell EURGBP now for a quick scalping ...... looking for 20 pips plus on profit target here

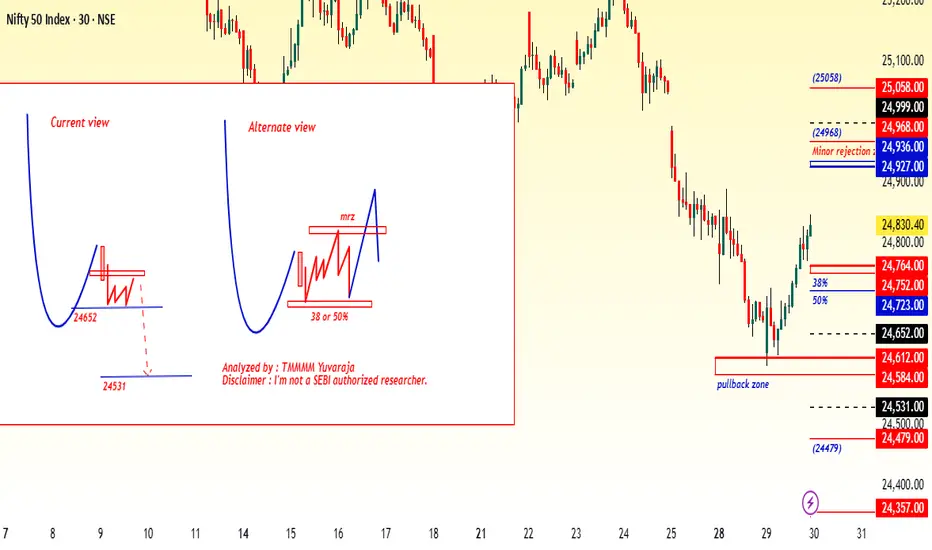
#Nifty directions and levels for July 30th:Good morning, friends! 🌞
Here are the market directions and levels for July 30th:
There have been no major changes in the global market. The global sentiment remains moderately bullish,
while the local market continues to show a bearish tone.
Today, Gift Nifty indicates a gap-down opening of around 40 points.
What can we expect today?
In the previous session, both Nifty and Bank Nifty took a solid pullback after the gap-down start.
However, neither of them broke the 38% Fibonacci level in the current swing.
So, unless the 38% level is broken, we should continue to approach the market with a bearish view.
At the same time, key parameters have been lagging recently, which has made it difficult for the market to take a clear direction.
My primary expectation is consolidation within the previous day's range.
However, if the market breaks the bottom with a solid structure, then we can expect the correction to continue.
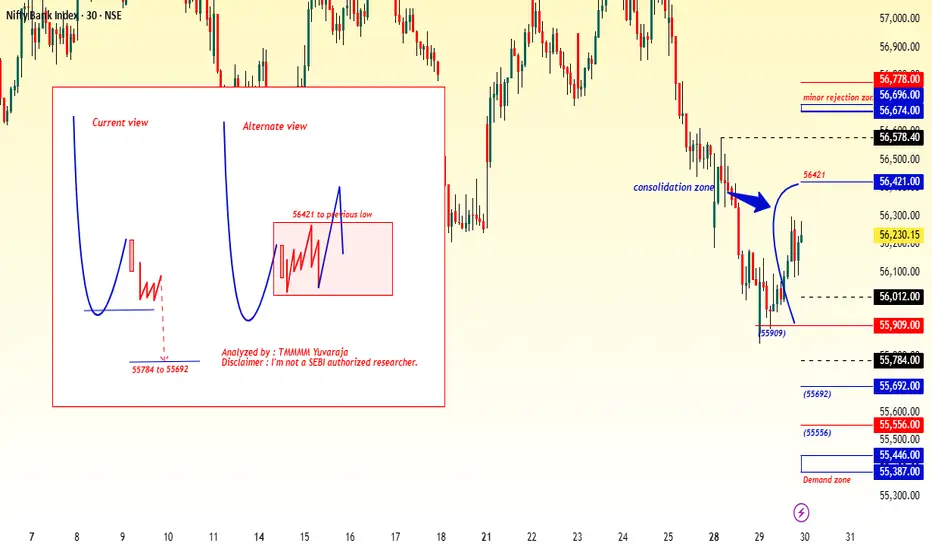
#Banknifty directions and levels for July 30th:
What can we expect today?
In the previous session, both Nifty and Bank Nifty took a solid pullback after the gap-down start.
However, neither of them broke the 38% Fibonacci level in the current swing.
So, unless the 38% level is broken, we should continue to approach the market with a bearish view.
At the same time, key parameters have been lagging recently, which has made it difficult for the market to take a clear direction.
My primary expectation is consolidation within the previous day's range.
However, if the market breaks the bottom with a solid structure, then we can expect the correction to continue.