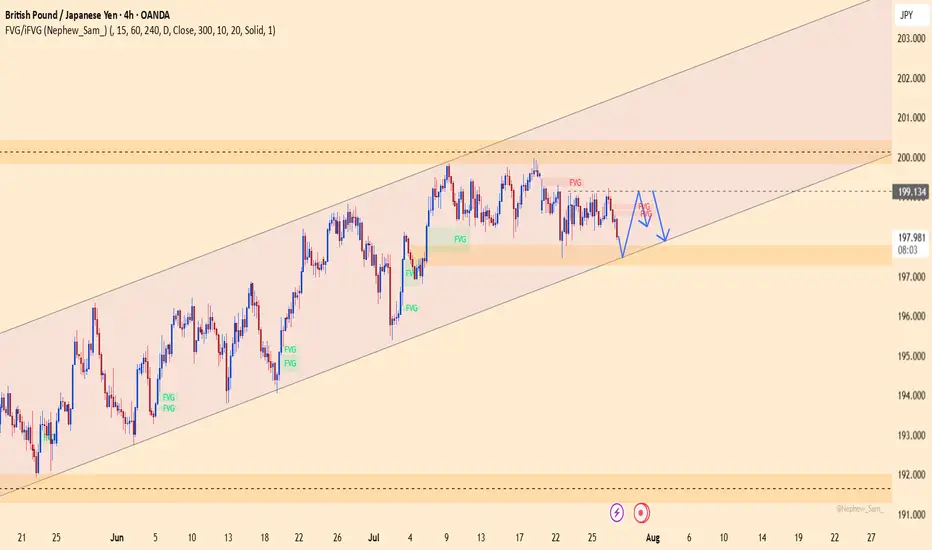
GBPJPY – Bearish pressure returns near ascending channel supportGBPJPY is trading close to the lower trendline of the ascending channel, with the 197.400 zone acting as a key support. A breakdown below this level could trigger stronger bearish momentum.
On the news front, Japan’s CPI remains solid, strengthening the yen. Meanwhile, the British pound is under pressure after recent consumer spending data showed signs of weakness, raising concerns over the UK’s economic outlook.
Strategy: If the price breaks below 197.400 and fails to bounce back, consider SELL setups in line with the bearish trend. If it rebounds, watch the reaction around the 199.100 zone for signs of recovery confirmation.
Harmonic Patterns
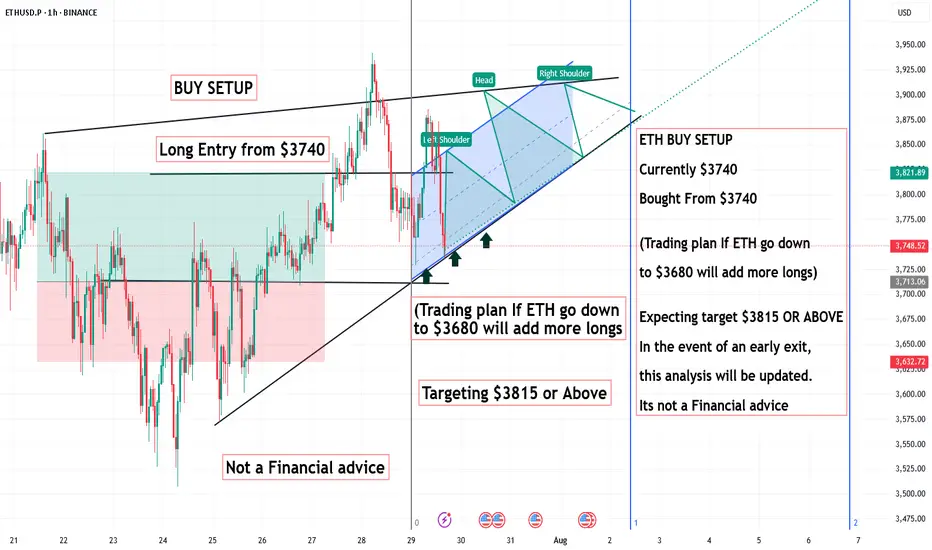
ETH BUY SETUP ,Bought From $3740ETH BUY SETUP
Currently $3740
Bought From $3740
(Trading plan If ETH go down
to $3680 will add more longs)
Expecting target $3815 OR ABOVE
In the event of an early exit,
this analysis will be updated.
Its not a Financial advice
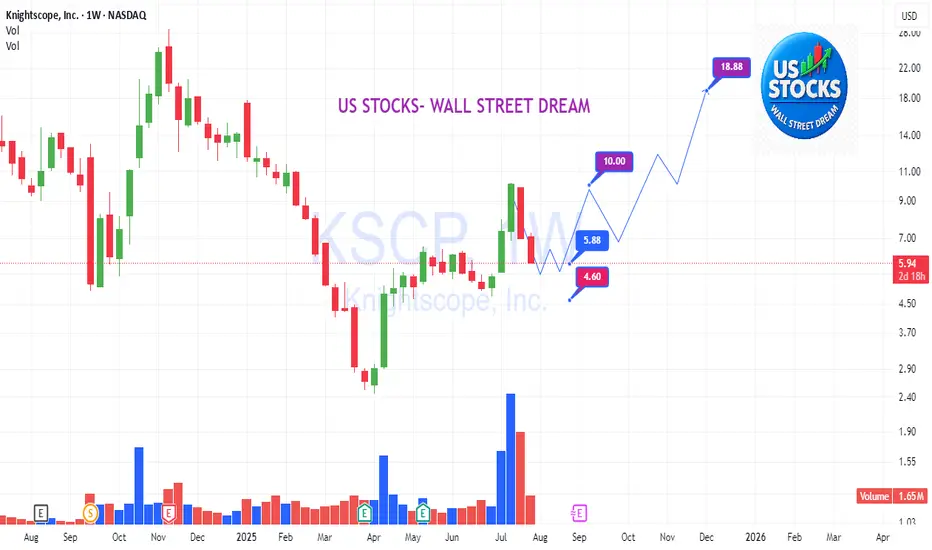
KSCP: Seek opportunities in the crowd's fearNASDAQ:KSCP
🌾🌾🌾
While the majority are fearful and busy searching for reasons why the market is dropping or correcting, the group keeps diligently searching for and sharing opportunities 🥰.
⚡️⚡️⚡️
US STOCKS- WALL STREET DREAM- LET'S THE MARKET SPEAK!
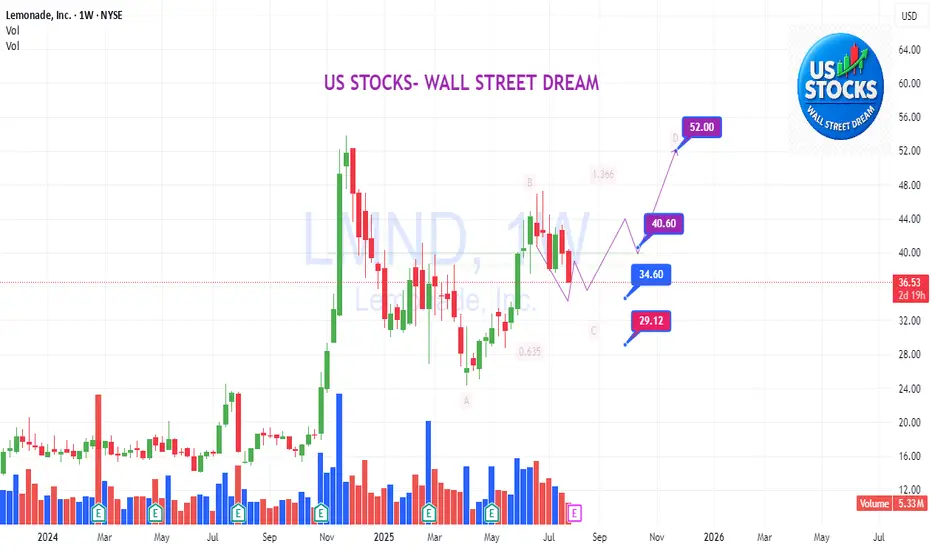
LMND: Catching the dip!LMND
.
Catching the dip!
✨✨✨
In fact, good entry points are usually either boring or when the crowd is fearful — not when everyone is excited and FOMO-ing.
🌺🌺🌺
US STOCKS- WALL STREET DREAM- LET'S THE MARKET SPEAK!
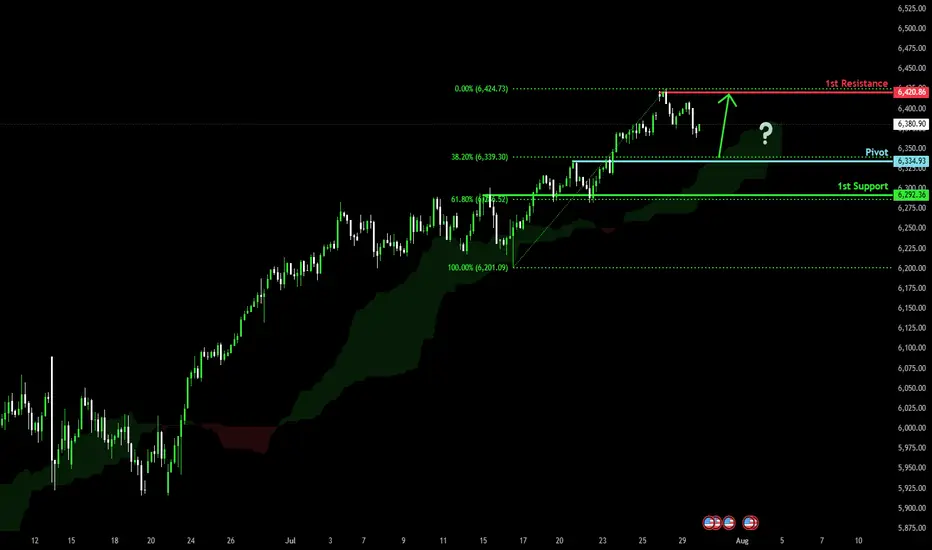
Bullish continuation?S&P500 is falling towards the pivot and could bounce to the swing high resistance.
Pivot: 6,334.93
1st Support: 6,292.36
1st Resistance: 6,420.86
Risk Warning:
Trading Forex and CFDs carries a high level of risk to your capital and you should only trade with money you can afford to lose. Trading Forex and CFDs may not be suitable for all investors, so please ensure that you fully understand the risks involved and seek independent advice if necessary.
Disclaimer:
The above opinions given constitute general market commentary, and do not constitute the opinion or advice of IC Markets or any form of personal or investment advice.
Any opinions, news, research, analyses, prices, other information, or links to third-party sites contained on this website are provided on an "as-is" basis, are intended only to be informative, is not an advice nor a recommendation, nor research, or a record of our trading prices, or an offer of, or solicitation for a transaction in any financial instrument and thus should not be treated as such. The information provided does not involve any specific investment objectives, financial situation and needs of any specific person who may receive it. Please be aware, that past performance is not a reliable indicator of future performance and/or results. Past Performance or Forward-looking scenarios based upon the reasonable beliefs of the third-party provider are not a guarantee of future performance. Actual results may differ materially from those anticipated in forward-looking or past performance statements. IC Markets makes no representation or warranty and assumes no liability as to the accuracy or completeness of the information provided, nor any loss arising from any investment based on a recommendation, forecast or any information supplied by any third-party.
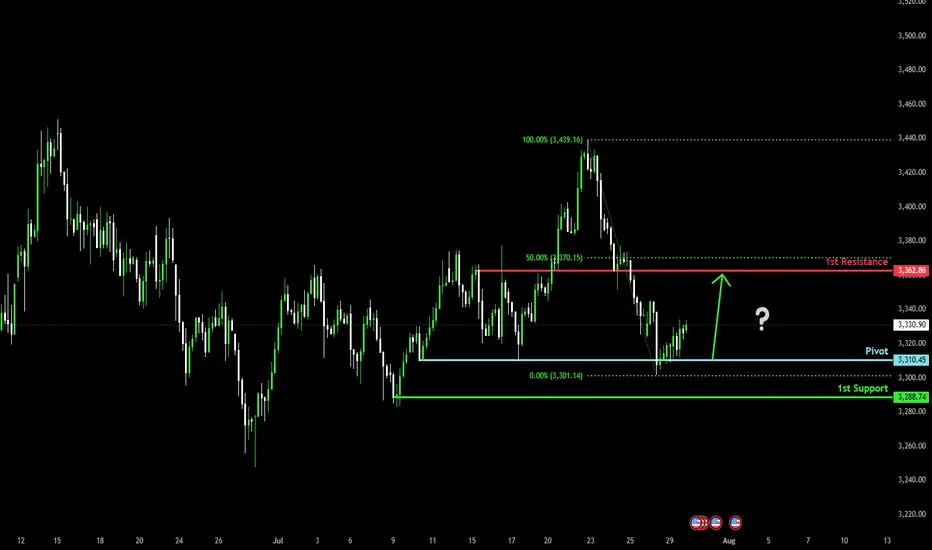
Bullish bounce off?The Gold (XAU/USD) has bounced off the pivot, which acts as a multi-swing low support and could rise to the 1st resistance, which is slightly below the 50% Fibonacci retracement.
Pivot: 3,310.45
1st Support: 3,288.74
1st Resistance: 3,362.86
Risk Warning:
Trading Forex and CFDs carries a high level of risk to your capital and you should only trade with money you can afford to lose. Trading Forex and CFDs may not be suitable for all investors, so please ensure that you fully understand the risks involved and seek independent advice if necessary.
Disclaimer:
The above opinions given constitute general market commentary, and do not constitute the opinion or advice of IC Markets or any form of personal or investment advice.
Any opinions, news, research, analyses, prices, other information, or links to third-party sites contained on this website are provided on an "as-is" basis, are intended only to be informative, is not an advice nor a recommendation, nor research, or a record of our trading prices, or an offer of, or solicitation for a transaction in any financial instrument and thus should not be treated as such. The information provided does not involve any specific investment objectives, financial situation and needs of any specific person who may receive it. Please be aware, that past performance is not a reliable indicator of future performance and/or results. Past Performance or Forward-looking scenarios based upon the reasonable beliefs of the third-party provider are not a guarantee of future performance. Actual results may differ materially from those anticipated in forward-looking or past performance statements. IC Markets makes no representation or warranty and assumes no liability as to the accuracy or completeness of the information provided, nor any loss arising from any investment based on a recommendation, forecast or any information supplied by any third-party.
Heading into 50% Fibonacci resistance?The Kiwi (NZD/USD) is rising towards the pivot, which is an overlap resistance that lines up with the 50% Fibonacci retracement and could reverse to the 1st support.
Pivot: 0.5999
1st Support: 0.5941
1st Resistance: 0.6030
Risk Warning:
Trading Forex and CFDs carries a high level of risk to your capital and you should only trade with money you can afford to lose. Trading Forex and CFDs may not be suitable for all investors, so please ensure that you fully understand the risks involved and seek independent advice if necessary.
Disclaimer:
The above opinions given constitute general market commentary, and do not constitute the opinion or advice of IC Markets or any form of personal or investment advice.
Any opinions, news, research, analyses, prices, other information, or links to third-party sites contained on this website are provided on an "as-is" basis, are intended only to be informative, is not an advice nor a recommendation, nor research, or a record of our trading prices, or an offer of, or solicitation for a transaction in any financial instrument and thus should not be treated as such. The information provided does not involve any specific investment objectives, financial situation and needs of any specific person who may receive it. Please be aware, that past performance is not a reliable indicator of future performance and/or results. Past Performance or Forward-looking scenarios based upon the reasonable beliefs of the third-party provider are not a guarantee of future performance. Actual results may differ materially from those anticipated in forward-looking or past performance statements. IC Markets makes no representation or warranty and assumes no liability as to the accuracy or completeness of the information provided, nor any loss arising from any investment based on a recommendation, forecast or any information supplied by any third-party.

Potential bullish reversal?The Aussie (AUD/USD) has bounced off the pivot, which is a swing low support, and could rise to the 1st resistance, which acts as a pullback resistance.
Pivot: 0.6502
1st Support: 0.6468
1st Resistance: 0.6558
Risk Warning:
Trading Forex and CFDs carries a high level of risk to your capital and you should only trade with money you can afford to lose. Trading Forex and CFDs may not be suitable for all investors, so please ensure that you fully understand the risks involved and seek independent advice if necessary.
Disclaimer:
The above opinions given constitute general market commentary, and do not constitute the opinion or advice of IC Markets or any form of personal or investment advice.
Any opinions, news, research, analyses, prices, other information, or links to third-party sites contained on this website are provided on an "as-is" basis, are intended only to be informative, is not an advice nor a recommendation, nor research, or a record of our trading prices, or an offer of, or solicitation for a transaction in any financial instrument and thus should not be treated as such. The information provided does not involve any specific investment objectives, financial situation and needs of any specific person who may receive it. Please be aware, that past performance is not a reliable indicator of future performance and/or results. Past Performance or Forward-looking scenarios based upon the reasonable beliefs of the third-party provider are not a guarantee of future performance. Actual results may differ materially from those anticipated in forward-looking or past performance statements. IC Markets makes no representation or warranty and assumes no liability as to the accuracy or completeness of the information provided, nor any loss arising from any investment based on a recommendation, forecast or any information supplied by any third-party.

Bearish drop?The Swissie (USD/CHF) has rejected off the pivot and could potentially drop to the 50% Fibonacci support.
Pivot: 0.8070
1st Support: 0.7988
1st Resistance: 0.8128
Risk Warning:
Trading Forex and CFDs carries a high level of risk to your capital and you should only trade with money you can afford to lose. Trading Forex and CFDs may not be suitable for all investors, so please ensure that you fully understand the risks involved and seek independent advice if necessary.
Disclaimer:
The above opinions given constitute general market commentary, and do not constitute the opinion or advice of IC Markets or any form of personal or investment advice.
Any opinions, news, research, analyses, prices, other information, or links to third-party sites contained on this website are provided on an "as-is" basis, are intended only to be informative, is not an advice nor a recommendation, nor research, or a record of our trading prices, or an offer of, or solicitation for a transaction in any financial instrument and thus should not be treated as such. The information provided does not involve any specific investment objectives, financial situation and needs of any specific person who may receive it. Please be aware, that past performance is not a reliable indicator of future performance and/or results. Past Performance or Forward-looking scenarios based upon the reasonable beliefs of the third-party provider are not a guarantee of future performance. Actual results may differ materially from those anticipated in forward-looking or past performance statements. IC Markets makes no representation or warranty and assumes no liability as to the accuracy or completeness of the information provided, nor any loss arising from any investment based on a recommendation, forecast or any information supplied by any third-party.

Bullish bounce off an overlap support?USD/JPY is falling towards the pivot, which has been identified as an overlap support and could bounce to the 1st resistance, which acts as a swing high resistance.
Pivot: 147.67
1st Support: 146.99
1st Resistance: 149.04
Risk Warning:
Trading Forex and CFDs carries a high level of risk to your capital and you should only trade with money you can afford to lose. Trading Forex and CFDs may not be suitable for all investors, so please ensure that you fully understand the risks involved and seek independent advice if necessary.
Disclaimer:
The above opinions given constitute general market commentary, and do not constitute the opinion or advice of IC Markets or any form of personal or investment advice.
Any opinions, news, research, analyses, prices, other information, or links to third-party sites contained on this website are provided on an "as-is" basis, are intended only to be informative, is not an advice nor a recommendation, nor research, or a record of our trading prices, or an offer of, or solicitation for a transaction in any financial instrument and thus should not be treated as such. The information provided does not involve any specific investment objectives, financial situation and needs of any specific person who may receive it. Please be aware, that past performance is not a reliable indicator of future performance and/or results. Past Performance or Forward-looking scenarios based upon the reasonable beliefs of the third-party provider are not a guarantee of future performance. Actual results may differ materially from those anticipated in forward-looking or past performance statements. IC Markets makes no representation or warranty and assumes no liability as to the accuracy or completeness of the information provided, nor any loss arising from any investment based on a recommendation, forecast or any information supplied by any third-party.

Bullish reversal off pullback support?The Fiber (EUR/USD) has bounced off the pivot, which is a pullback support, and could rise to the 1st resistance, which is a pullback resistance.
Pivot: 1.1537
1st Support: 1.1456
1st Resistance: 1.1659
Risk Warning:
Trading Forex and CFDs carries a high level of risk to your capital and you should only trade with money you can afford to lose. Trading Forex and CFDs may not be suitable for all investors, so please ensure that you fully understand the risks involved and seek independent advice if necessary.
Disclaimer:
The above opinions given constitute general market commentary, and do not constitute the opinion or advice of IC Markets or any form of personal or investment advice.
Any opinions, news, research, analyses, prices, other information, or links to third-party sites contained on this website are provided on an "as-is" basis, are intended only to be informative, is not an advice nor a recommendation, nor research, or a record of our trading prices, or an offer of, or solicitation for a transaction in any financial instrument and thus should not be treated as such. The information provided does not involve any specific investment objectives, financial situation and needs of any specific person who may receive it. Please be aware, that past performance is not a reliable indicator of future performance and/or results. Past Performance or Forward-looking scenarios based upon the reasonable beliefs of the third-party provider are not a guarantee of future performance. Actual results may differ materially from those anticipated in forward-looking or past performance statements. IC Markets makes no representation or warranty and assumes no liability as to the accuracy or completeness of the information provided, nor any loss arising from any investment based on a recommendation, forecast or any information supplied by any third-party.

Bearish reversal?The US Dollar Index (DXY) is rising towards the pivot and could reverse to the 1st support.
Pivot: 99.24
1st Support: 98.27
1st Resistance: 99.97
Risk Warning:
Trading Forex and CFDs carries a high level of risk to your capital and you should only trade with money you can afford to lose. Trading Forex and CFDs may not be suitable for all investors, so please ensure that you fully understand the risks involved and seek independent advice if necessary.
Disclaimer:
The above opinions given constitute general market commentary, and do not constitute the opinion or advice of IC Markets or any form of personal or investment advice.
Any opinions, news, research, analyses, prices, other information, or links to third-party sites contained on this website are provided on an "as-is" basis, are intended only to be informative, is not an advice nor a recommendation, nor research, or a record of our trading prices, or an offer of, or solicitation for a transaction in any financial instrument and thus should not be treated as such. The information provided does not involve any specific investment objectives, financial situation and needs of any specific person who may receive it. Please be aware, that past performance is not a reliable indicator of future performance and/or results. Past Performance or Forward-looking scenarios based upon the reasonable beliefs of the third-party provider are not a guarantee of future performance. Actual results may differ materially from those anticipated in forward-looking or past performance statements. IC Markets makes no representation or warranty and assumes no liability as to the accuracy or completeness of the information provided, nor any loss arising from any investment based on a recommendation, forecast or any information supplied by any third-party.

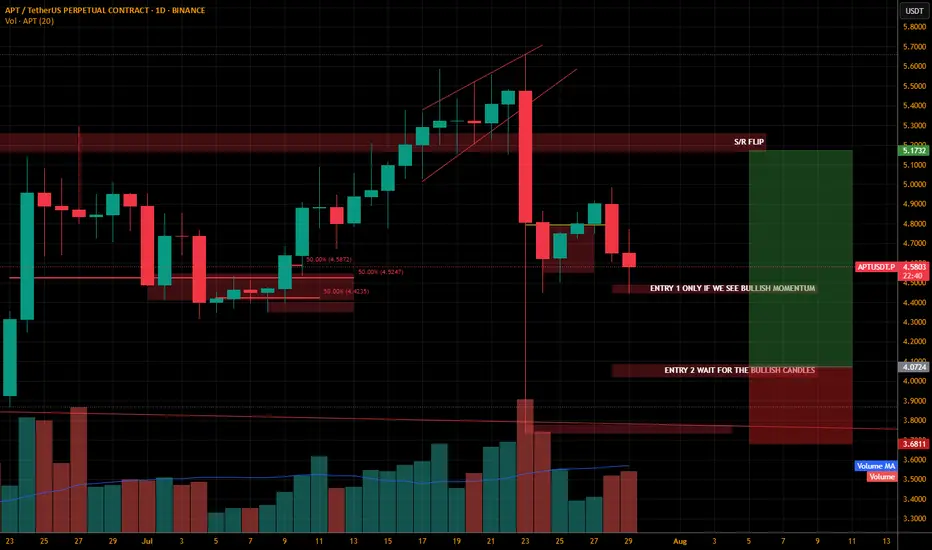
APTUSDT.PThis coin is also sleeping can be the bottom of the coin.
Lets wait for the bullish confirmation always wait.. patience is the game changer. Always wait for the confirmation on the entry level. Just dont take trade as soon the price touches the level we need to wait for the confirmation ALWAYS..
If entry 1 is solid i will update and tell you guys the t.p and s.l accordingly.
Entry 2 will be sure shot as soon we will see some bullish momentum.
Follow me guys support me to post more and more.
RONINUSDT.PAs i promised the more you follow the more analysis ill post here.
If you want to buy now you can this is a swing trade,, Buy now, hold and manage.
The price will likely to make a inverse head and shoulder.
I am not setting any target for this.. or s.l
This might be risky.. so only buy if you want to.
I will buy and suggest you to by only after trendline breakout with a strong volume and candles..
Just preparing you guys for the alts bull run.. one day we will wake up and see huge green day..
Follow me and support me..

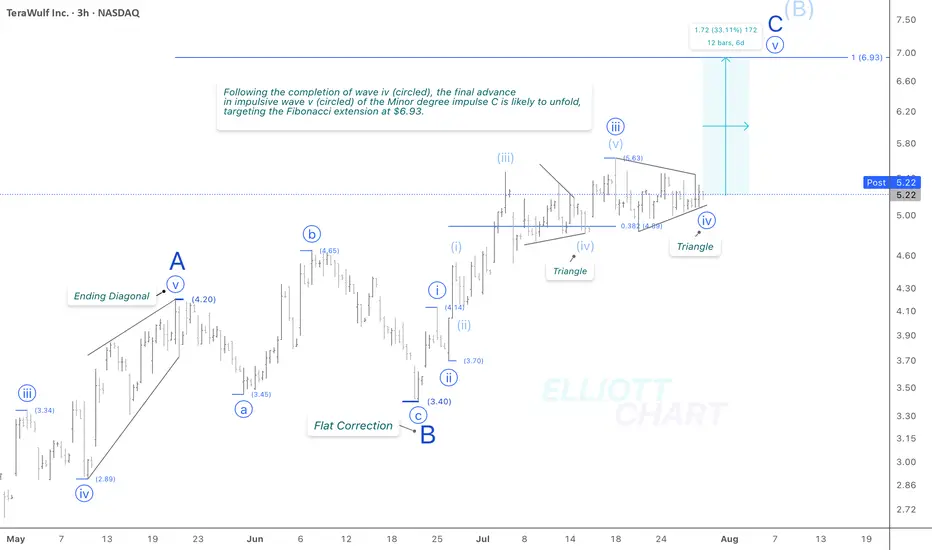
WULF / 3hNASDAQ:WULF continued to consolidate sideways today, in line with expectations, with no material change to the broader outlook. The narrowing price action supports the current wave structure—specifically, a completed triangle in wave iv (circled), likely preceding the anticipated final advance of approximately 33% in wave v (circled) of the ongoing Minor degree wave C.
The Fibonacci extension target at 6.93 remains valid.
Trend Analysis >> Upon completion of Minor degree wave C, the countertrend advance of Intermediate degree wave (B), which has been unfolding since April 9, is likely to give way to a decline in wave (C) of the same degree. This downtrend might begin in the coming days and potentially extend through the end of the year!!
NASDAQ:WULF CRYPTOCAP:BTC BITSTAMP:BTCUSD MARKETSCOM:BITCOIN
#CryptoStocks #WULF #BTCMining #Bitcoin #BTC
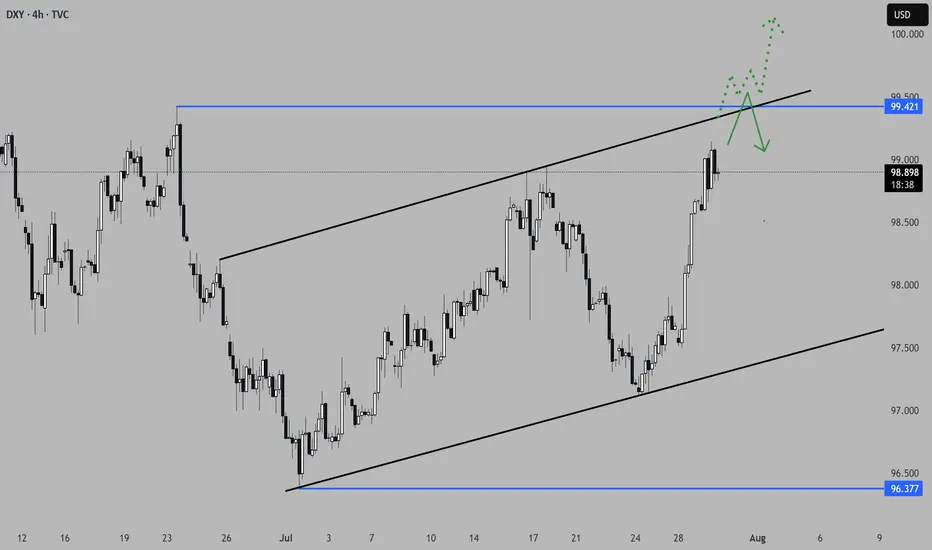
Interesting few days ahead... USD pairs approaching key levelsDXY is finishing a HTF consolidation and is approaching medium-term key areas. Other USD pairs are also in areas where they could aggressively turn around. EURUSD just finished a H4 3-touch continuation flag and is starting to stall on the 3rd touch, suggesting indecision in the markets.
Considering the news events in the next 3 days, starting today with USD advanced GDP data, we could see volatility kicking in on these key levels. We do need a catalyst to push price into a larger directional move, and we are prime positioned for the next leg. Technically, a breakout in both directions would make sense in these areas. Time to set alarms and be vigilant but not jump into trades too early, considering NFP on Friday as well.
*** **** ****
📈 Simplified Trading Rules:
> Follow a Valid Sequence
> Wait for Continuation
> Confirm Entry (valid candlestick pattern)
> Know When to Exit (SL placement)
Remember, technical analysis is subjective; develop your own approach. I use this format primarily to hold myself accountable and to share my personal market views.
The pairs I publish here are usually discussed in detail in my Weekly Forex Forecast (WFF) and are now showing further developments worth mentioning.
⚠ Ensure you have your own risk management in place and always stick to your trading plan.
*** **** ****
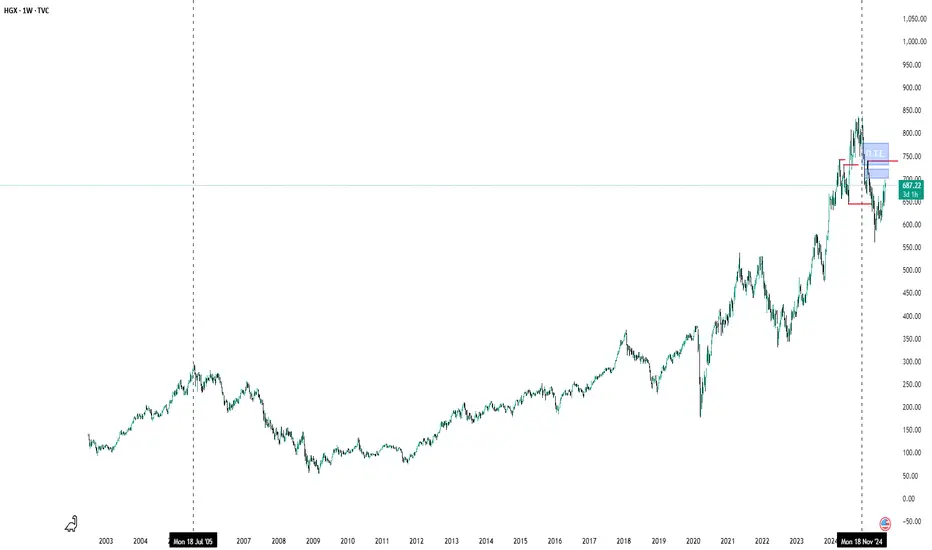
Housing Index, That There Look Identical Weak housing sector looking to return to Optimal trade Entry and then giving up the ghost.
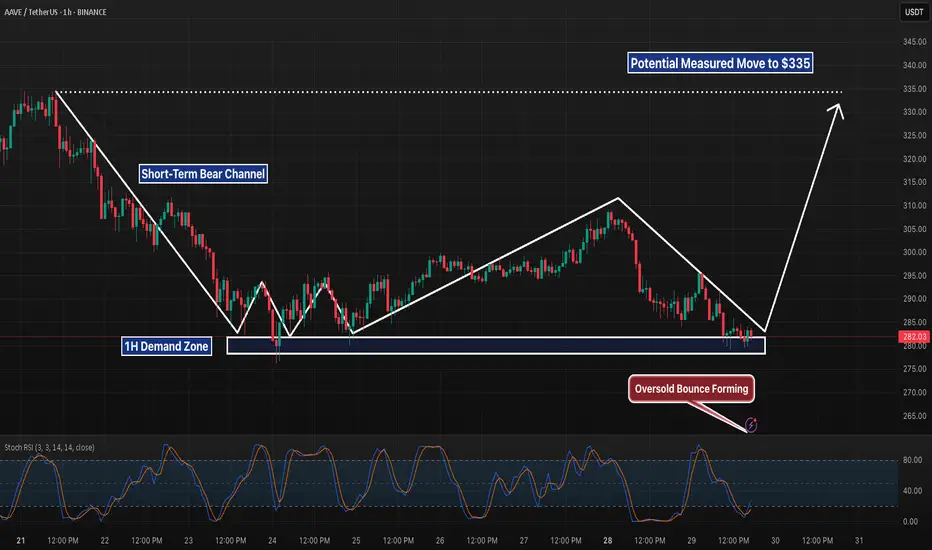
AAVE 1H – Triple Tap Support + Bullish Divergence Incoming?AAVE is painting a compelling reversal setup on the 1H timeframe. After a sharp selloff last week, price has tapped the $278–282 demand zone multiple times — each time printing higher local lows on the Stochastic RSI and showing signs of exhaustion from sellers.
This zone has now been tested three separate times, forming what looks like a triple-bottom structure. During the latest retest, Stochastic RSI is deeply oversold and beginning to curl up — suggesting that momentum may shift in favor of the bulls soon.
We’re also approaching the apex of a descending trendline, meaning compression is reaching its limit. A clean break and reclaim above $290 could be the first real sign of trend reversal, with a potential target near the previous range highs around $335 if momentum follows through.
📊 Why This Setup Matters:
– Strong historical support zone with visible reactions
– Repeated seller failure to break the zone cleanly
– RSI bullish divergence building beneath structure
– Clear invalidation level below support
– Risk-reward skewed in favor of a bounce play
This isn’t confirmation yet — but it’s definitely a chart worth watching closely over the next session. If bulls step in with volume, this could catch momentum fast.
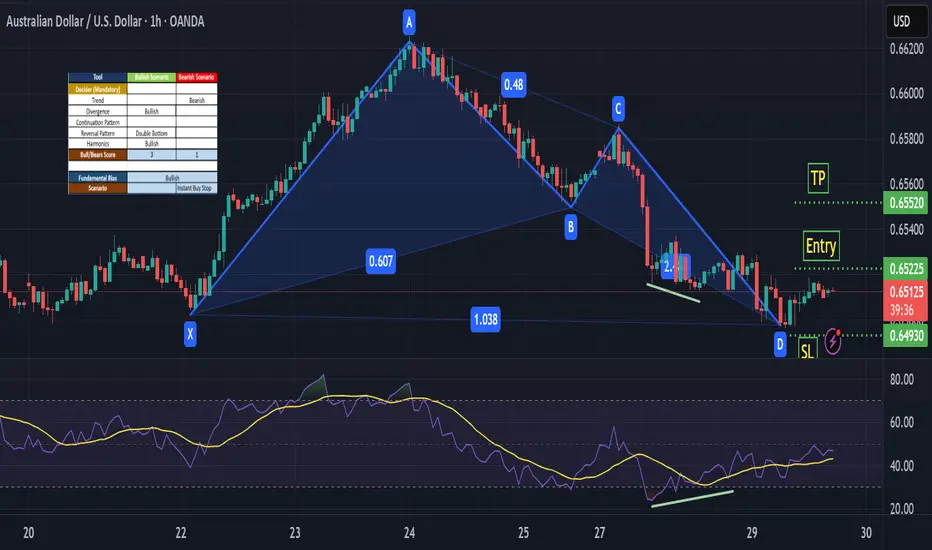
AUDUSD - BullishAUDUSD is Bullish on Fundamental Bias and Seasonal aslo support long position. Divergence can also be observed on RSI. Forming an Harmonic pattern so it looks like buyers are in a strong position
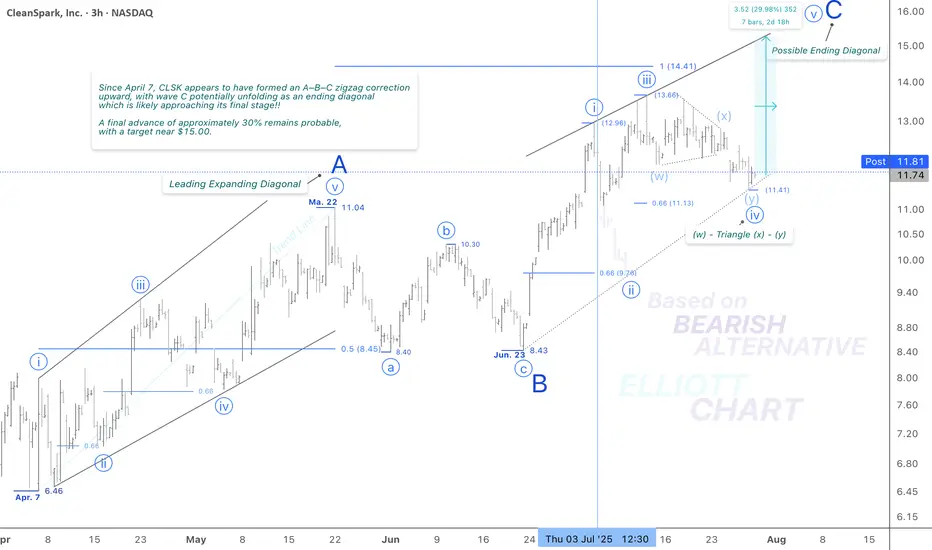
CLSK / 3hThe modest and unexpected 2.5% decline in NASDAQ:CLSK today suggests a potential shift in the wave iv (circled) corrective structure—from the previously identified to a more complex combination.
This adjustment still fits within the context of the ending diagonal pattern in Minor wave C and reflects a deeper, yet corrective, move down. The overall outlook and wave structure remain unchanged.
Wave Analysis >> As illustrated in the 3h-frame above, Minor wave C—completing the corrective upward move of wave (B)—appears to be unfolding as an ending diagonal, now likely in its final stages. Within this structure, the Minute wave iv (circled) has formed a correction. A final push higher in Minute wave v (circled) is now expected, which would complete the ending diagonal pattern of wave C, and in turn, conclude the countertrend advance of wave (B).
Trend Analysis >> Upon completion of the potential ending diagonal in Minor wave C, the broader trend is anticipated to reverse to the downside, initiating the final decline in Intermediate wave (C). This bearish phase may extend through the remainder of the year.
#CryptoStocks #CLSK #BTCMining #Bitcoin #BTC
NASDAQ:CLSK CRYPTOCAP:BTC BITSTAMP:BTCUSD MARKETSCOM:BITCOIN
XRP should be PumpedXRP pullback is ending. If the price does not break above $3, growth is likely go to 4$.

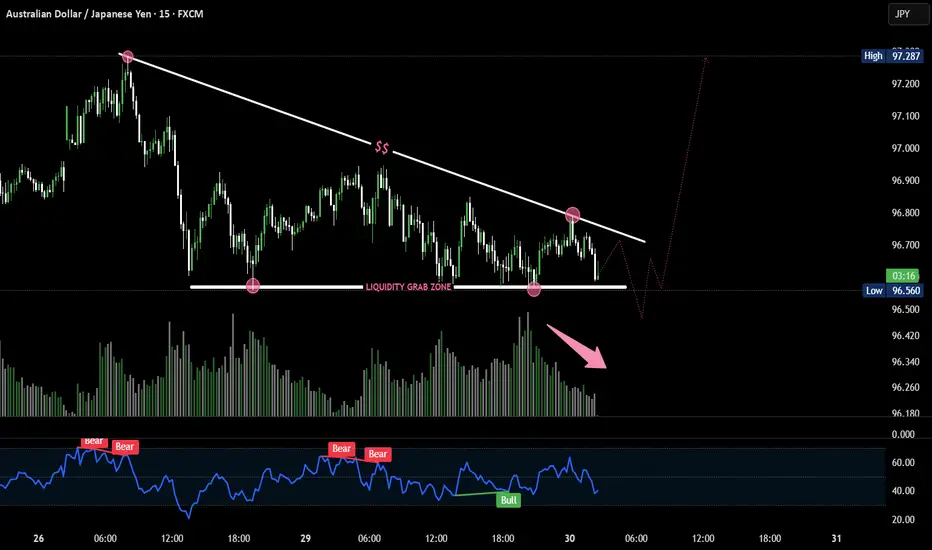
AUD/JPY Poised for Breakout After Liquidity Trap? 🔍 Key Observations:
🔻 Trendline resistance holding strong, forming lower highs.
📉 Sell-side liquidity resting just below horizontal support (marked zone).
💧 Price dipped into liquidity grab zone twice — sign of stop hunt.
🔁 Classic accumulation schematic forming — repeated sweeps before potential breakout.
📊 Volume divergence: Selling pressure weakening while liquidity is swept.
📉 RSI shows bullish divergence (price making lower lows, RSI making higher lows).
🔁 Rejection at RSI 40-level could indicate a bounce.
📈 Expectation:
One more fake breakdown below 96.500 could trigger aggressive buying — setting up a potential parabolic move toward 97.200+ if breakout occurs.
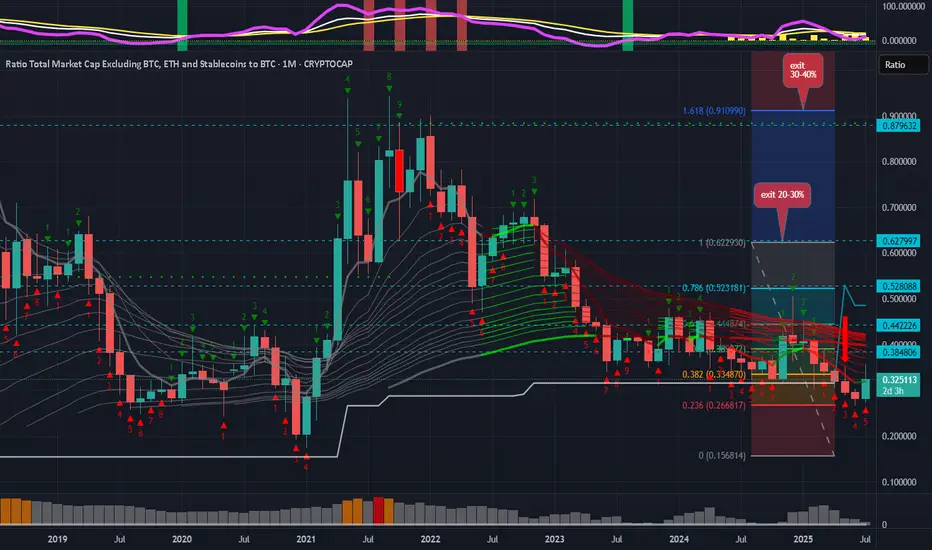
ALT-COINS MOST IMPORTANT CHART -2027-2028Hi
Not many charts out there about watch the total3 versus bitcoin
but this chart had signaled the last 2021 boom for altcoins
this could happen again into the following years to come
this is a long ride
for the patient
and the active trader or investor manager
yes retail at some point will be very small comparing to institutional smart money inflows
into some top 100 altcoins from 2030-2040
but
we don t know for now what altcoins will perform long term
we may guess the winners more than the losers hopefully
the first sign would be ETH outperforming BTC
i may update this chart in the next 6mo- to see the reversal signal -into the bullmarket
territory possible sooner than later could be q42025 or early 2026
i anticipate a cycle peak around mid 2027 thro early 2028
also a prolonged cycle could emerge and take us thro 2031
each of the fib target on this chart may experience a bigger or lager pullback
that is why a win win could be to sell something on each target and DCA back into alts later
smart money may also rotate from traditional market like Sp500 and from safe heaven assets risk off into more volatile beta assets with risk on tags. as long as they dont break ATHs again