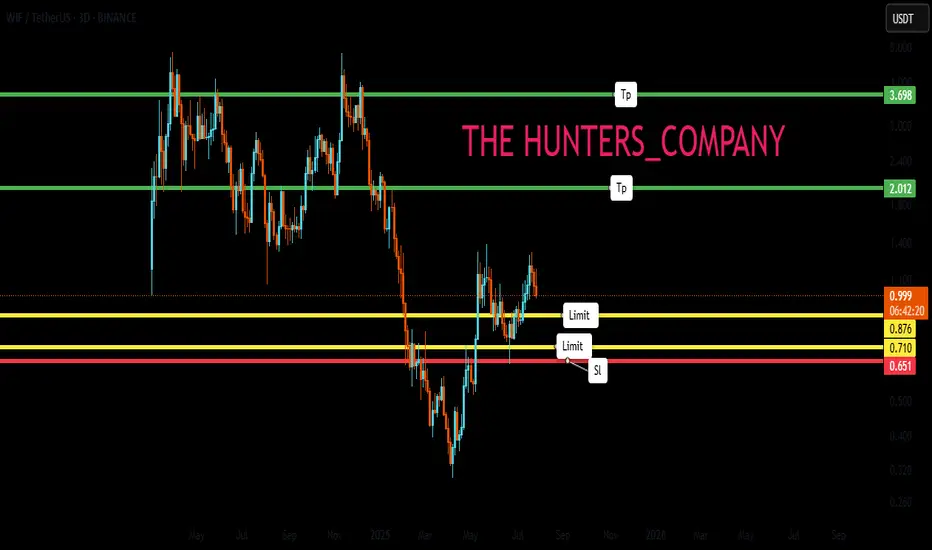
The meme coin you must haveHello friends🙌
Given the decline we had, you can see that the price has exited the descending channel and entered the ascending channel. Now we can buy in steps with capital and risk management.
Follow us for more signals🔥
*Trade safely with us*
Harmonic Patterns
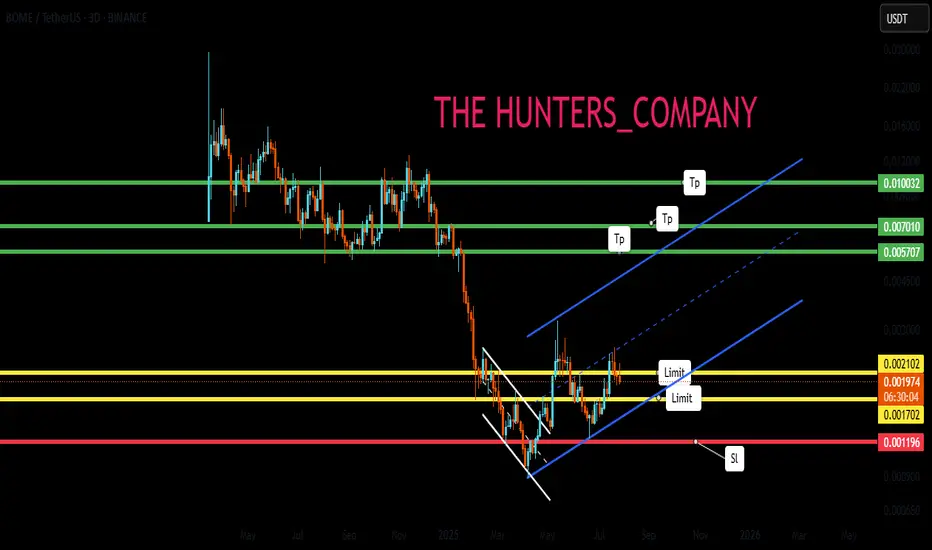
Memecoin is risky but profitable...Hello friends🙌
Given the channel's failure on the weekly time frame, there is now a good opportunity to buy in the price reversal or price correction, of course, with capital and risk management.
🔥Follow us for more signals🔥
*Trade safely with us*
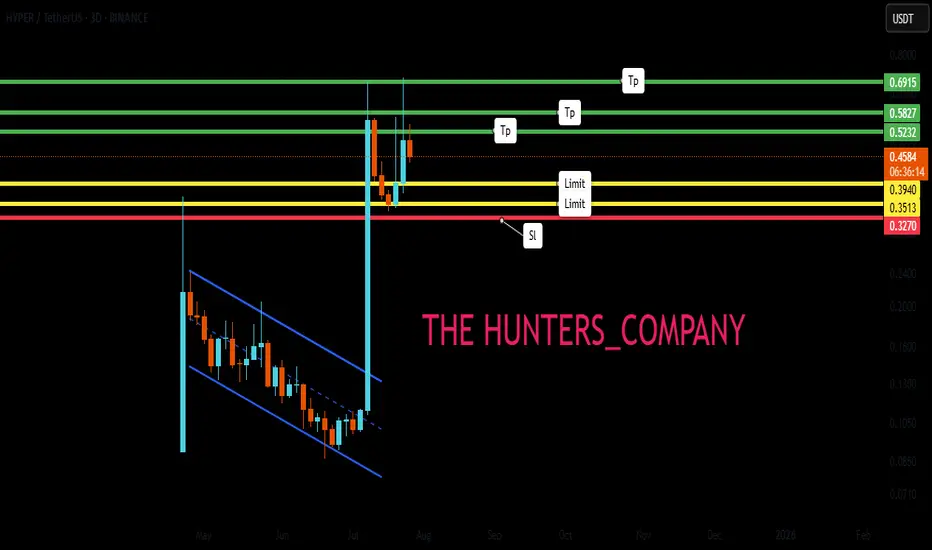
Memecoin with potential for purchase.Hello friends🙌
Considering the decline we had in the weekly timeframe, you can now see that with the good growth we had, it gives us a good signal to buy, of course in a stepwise manner and with capital and risk management.
🔥Follow us for more signals🔥
*Trade safely with us*
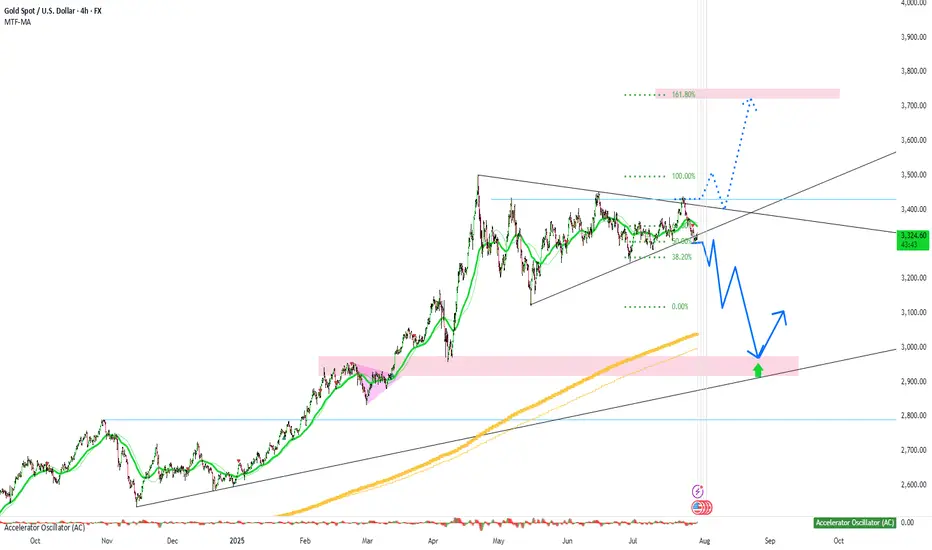
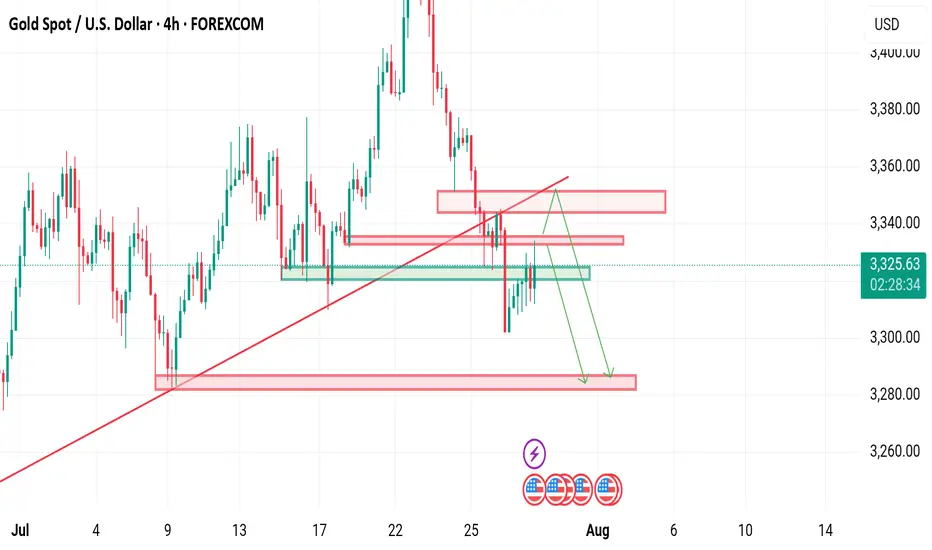
gold 4hour say: put sellstop in lowpersonaly i predict mini crash on gold and waiting for it , now we have powerfull 3angel pattern we must put sellstop in last low , buystop on last high
sellstop stoploss = last high
if sellstop open like new traders , dont close it soon , wait minimum 2 week ,understand?
ALERT= if gold can break last high , it can start new up trend, wave , so if you have old sells ,you must put SL or hedge buystop in last low
if sell
wishhhhhhhhhhhhhh youuuuuuuuuuuuuuuu win
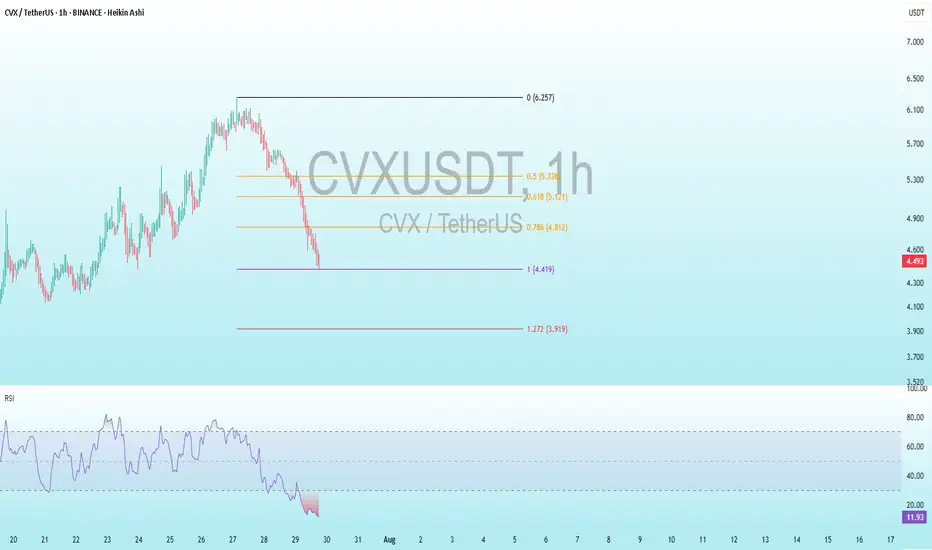
CVX Bullish DivergenceBINANCE:CVXUSDT
Trade Setup:
Target 1: 4.812 (0.786 Fibonnaci Golden Zone).
Target 2: 5.121 (0.618 Fibonnaci Golden Zone).
Target 3: 5.338 (0.5 Fibonnaci Golden Zone).
Target 4: 6.257 (0 Fibonnaci).
Stop Loss: 3.919 (above recent high, ~25% above current price).
RSI Analysis: The RSI is showing a bullish divergence, suggesting potential bullish momentum. The current RSI is around 11.86, approaching oversold territory, so caution is advised.
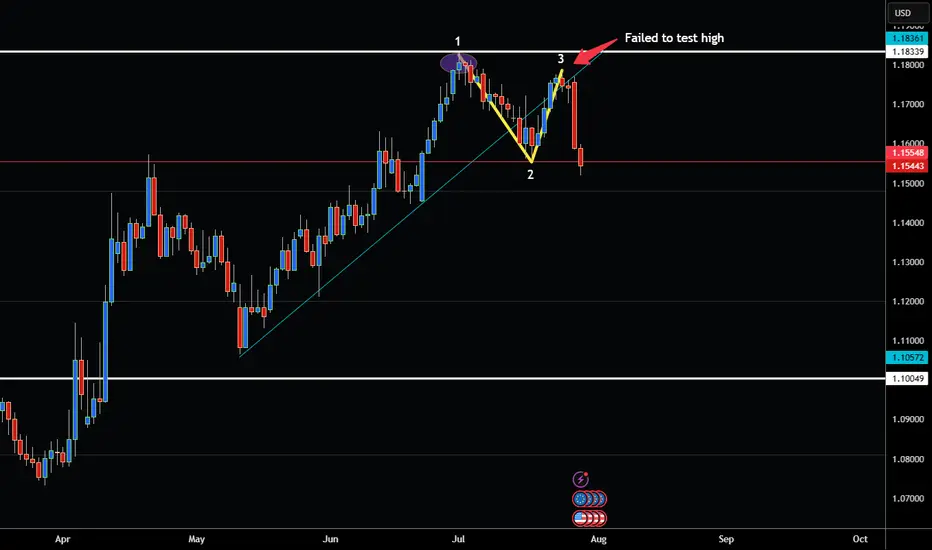
EUR/USD SHOWING SIGNS OF WEAKNESS AND NEW TOP FORMATION!Hey traders so looking at the EUR/USD today and wow what a difference a day makes!
Just the other day I was Bullish this pair and was reccommending buying on pullback. All of sudden in the blink of an eye market completely flips over on a dime due to tariffs. Thats life in the big city of trading. 😁
If you are new to trading remember this you can't ever lose by taking profits. No matter how large or how small which is why in the last post I reccommended moving that stop up to 3 days behind the market because as you can see the market is unpredictable.
Ok so where does that leave us now well as a technical analyst I look for trading the trend or changes in the trend and now that I see what is a completed 123 top formation on the Euro. That is a significant sign that the market has almost changed from uptrend to downtrend imo. Look at the resistance 1.1833 then look at the failed rally that only made it to 1.1783 that is a sign that a top has now formed.
Therefore if the US Dollar is bottoming I would not reccommend EUR/USD longs anymore. So I am watching for a break below support at 1.1500. If market can close below that level on a daily close. Then I would look to sell the a rally back to resistance.
However if bullish would not consider buying unless market breaks above resistance at 1.1833 that way you know for sure the trend has resumed!
Good Luck & Always use Risk Management!
(Just in we are wrong in our analysis most experts recommend never to risk more than 2% of your account equity on any given trade.)
Hope This Helps Your Trading 😃
Clifford
Gold prices under pressure: $3,330-3,350Gold prices under pressure: $3,330-3,350
Upward momentum: Gold could break through $3,330 if the Federal Reserve hints at a September rate cut or the EU economy deteriorates.
Downside risks: Gold could fall below $3,300 if strong US economic data (such as GDP and PCE figures) are released.
Optimistic scenario: If the Fed cuts rates in September and global stagflation risks increase, gold could reach $3,400.
Pessimistic scenario: If the US economy experiences a soft landing, rising real interest rates could push gold prices down to $3,200.
Key Technical Levels:
Support: $3,300
Resistance: $3,330/$3,350
Aggressive Strategy:
Sell Price: $3,325-$3,330
Stop Loss: $3,335
Target Price: $3,310
Conservative Strategy:
Sell Price: $3,340-$3,350
Stop Loss: $3,355
Target Price: $3,330-$3,310
Bottom Picking Strategy:
Buy Price: $3,300-$3,310
Stop Loss: $3,290
Target Price: Above $3,350/$3,400
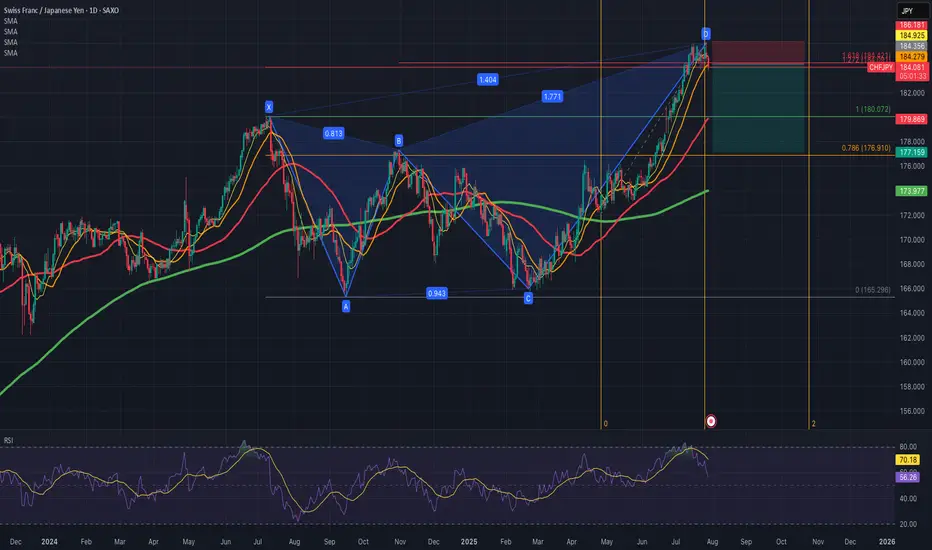
CHFJPY - Bearish Butterfly Pattern - Price got to the D point of the Bearish Butterfly Pattern
- Price crossed SMA10 and and is now testing SMA20
- JP10Y-CH10Y spread keeps going up and reached 1.2% now
BTCUSD : Key levelsI added meaningful levels to my past forecast (I can't add a link to my last forecast by the way, because as it turns out I have to actively participate in other people's discussions, which I am unlikely to do. And if I do, then to be able to add links to my predictions. So you have to check my prev forecast in the my profile overview).
So far, all levels are inactive except for the ~116,600 level. It's still in play.

SUN Bearish DivergenceBINANCE:SUNUSDT
Trade Setup:
Target 1: 0.01978 (0.50 Fibonnaci Golden Zone).
Target 2: 0.01883 (0.618 Fibonnaci Golden Zone).
Target 3: 0.01747 (0.786 Fibonnaci Golden Zone).
Target 4: 0.01574 (1 Fibonnaci).
Stop Loss: 0.02382 (above recent high, ~25% above current price).
RSI Analysis: The RSI shows a bullish divergence (price making lower lows while RSI makes higher lows), suggesting potential upward momentum. Current RSI is around 82.23, nearing overbought territory (>70), so caution is advised.

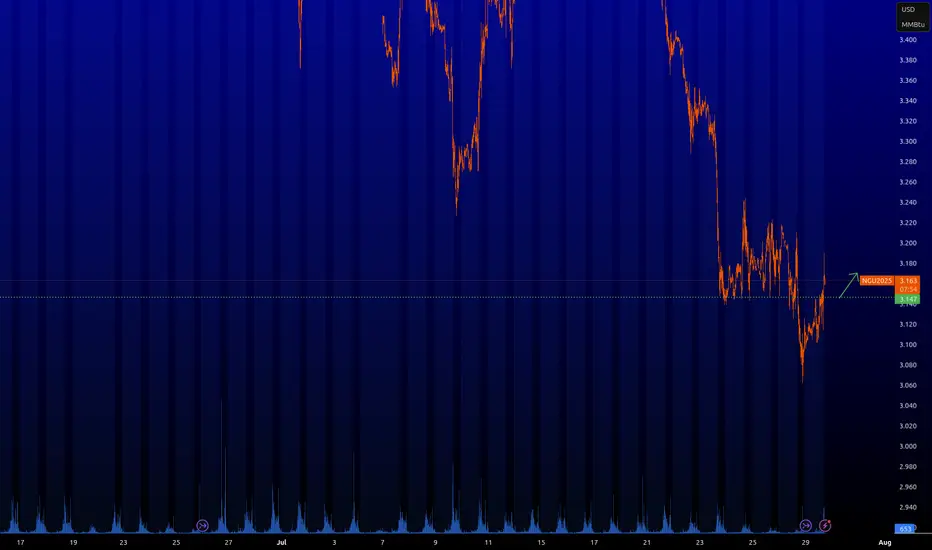
NG : Long-term longFrom this level we can look for longs. But one should not expect a pullback from it during significant news.
But in normal time it will work.
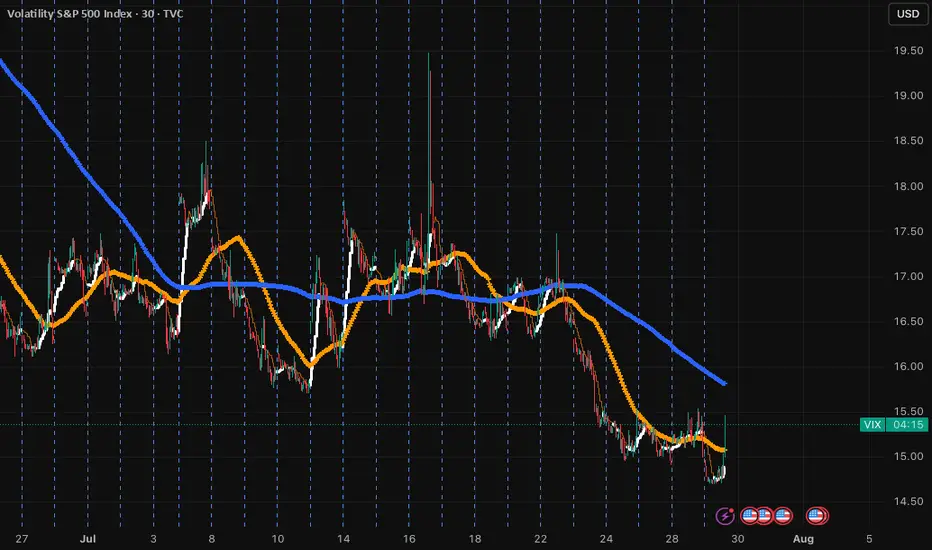
I told you so....VIX is the golden goose! All this fake pump in the market was just not sustainable. It is very clear that there are holes and the money printing can't last forever. The S&P fake pumps, and artificial tariffs (which Americans pay 90%) are created out of thin air. The reality is that defaults are very high across the board for most debt classes, VIX is at a YEAR LOW (doesn't happen to often, signaling massive complacency), and now the song will end and all the retailers will be holding the bag! Learn how to trade the VIX! DM me for details.
Always do your own due diligence, but historically this is a good time to get out :) You need to see and take action when you see red flags....
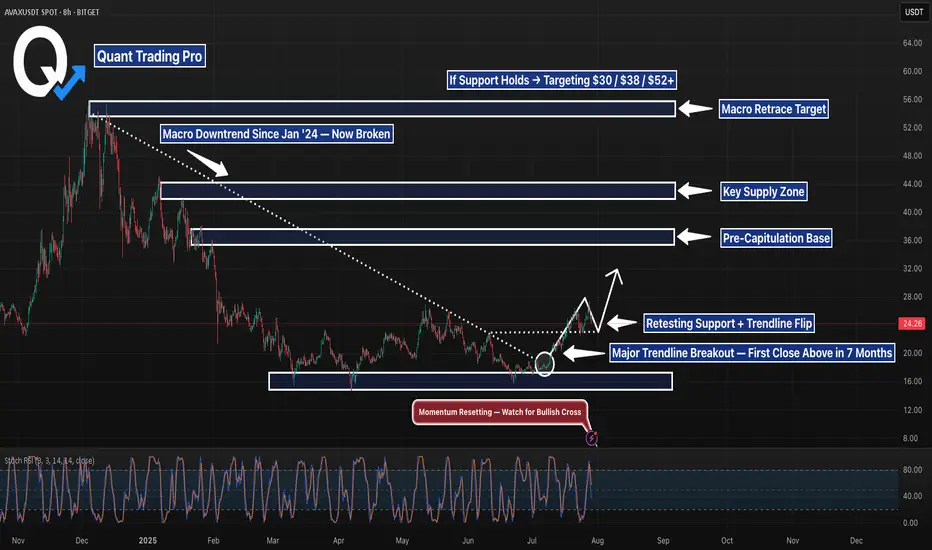
AVAXUSDT 8H — Trendline Break Confirmed, Retest in ProgressAVAX just closed above a 7-month macro downtrend and is now pulling back into a high-confluence retest zone. With the prior trendline now acting as potential support — and price holding above a multi-tap demand level — this is a high-stakes inflection point.
📊 Technical Breakdown:
Breakout:
The descending trendline that defined AVAX’s entire bear structure since January has finally broken. A clean candle close above that line marked a shift in control from sellers to buyers.
Retest Zone:
Price is now sitting directly on top of the broken trendline and the horizontal demand zone that’s held since Q1. This dual-level confluence offers a high-probability bounce area — or a decisive invalidation if lost.
Momentum Check:
Stochastic RSI is resetting — not overbought — giving bulls room to push higher if this retest holds.
Targets to the Upside:
$30 – Local breakdown zone from late Jan
$38 – Pre-capitulation base (March)
$44 – Major structural resistance
$52–53 – Full retracement target from the December high
🧠 Trade Context & Bias:
Bullish case:
A bounce here with strong volume confirms the trendline flip and opens the door for midterm continuation toward the $38–$44 zones.
Bearish case:
If AVAX breaks below $22 with momentum, this would invalidate the breakout structure and shift bias back toward range-bound or bearish continuation.
This is where structure meets opportunity. A successful retest could place AVAX at the front of the next altcoin rotation — but only if buyers defend this level with conviction.
Please check how to trade later.Since the release of the trading strategy, I have been able to accurately predict market trends. I am also grateful to so many brothers for following me. My premium privileges are about to expire. I will put the subsequent trading content in the group. If any brothers are interested, they can find me through 🌐. As for how to deal with the future market, I have stated the extraordinary situation and will patiently wait for the rebound of gold. At the same time, I will pay attention to the impact of the Sino-US trade talks.

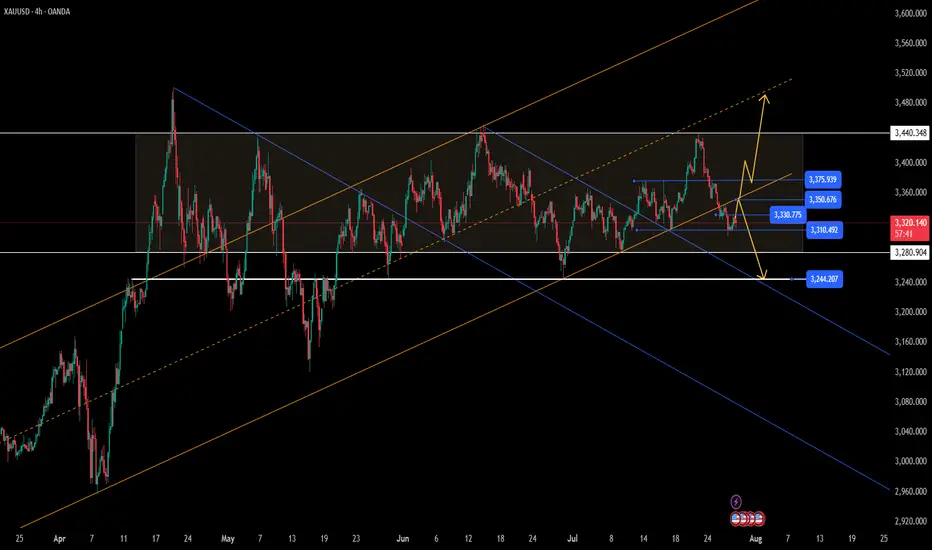
XAUUSD is still bearish Gold is currently below rising channel and holding the Range of 3320-3335,although yesterday implusive drop is incompleted without testing 3290-3280
What's possible scanarios we have?
▪️I'm still on bearish side till 3345 is invalidated and candle flips above. I open sell trades at 3332 again and holds it .
if H4 & H1 candle close above 3345 I will not hold or renter sell.
▪️Secondly if H4 candle closing above 3345 this down move will be invalid and Price-action will reached 3370.
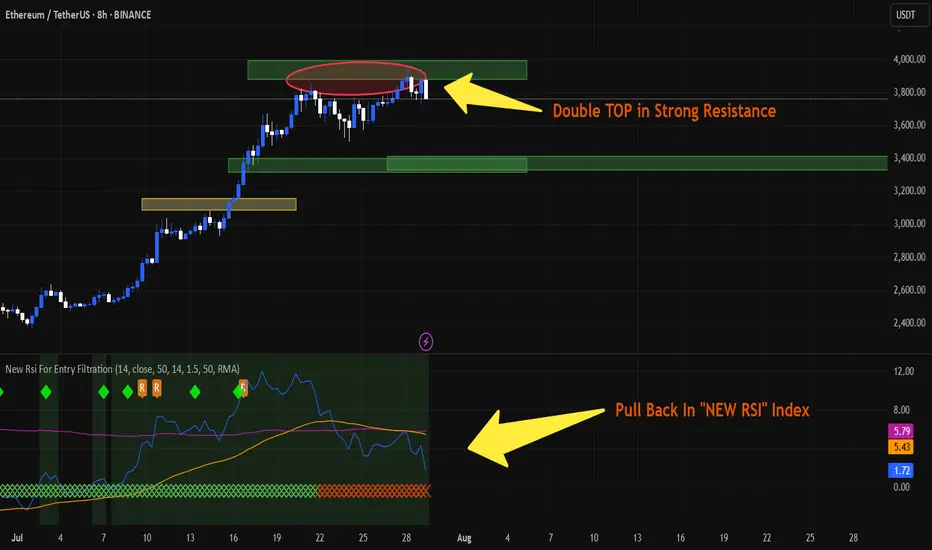
ETH is PullbackingAs I said befor, a double top has formed at around $4,000 and I guess we have a pullback to around $3,500. The "new RSI Index" is showing a pullback and strong divergence. If ETH breaks $4,000, this analysis will be rejected.
"IT is NOT a commercial advice. you may lose all your money in crypto Specially in FUTURE trading."
Act Bust on My Radar: Long-Term Vision, Short-Term Target!Hey folks 👋
I’ve put together a solid analysis for a promising token: **Act Bust**.
Whether it hits my entry level or not, I’ll be holding this token long-term.
Right now, the target is set at **0.10146**—once we get there, I’ll update you all.
Stay tuned, and trade smart 💼🚀

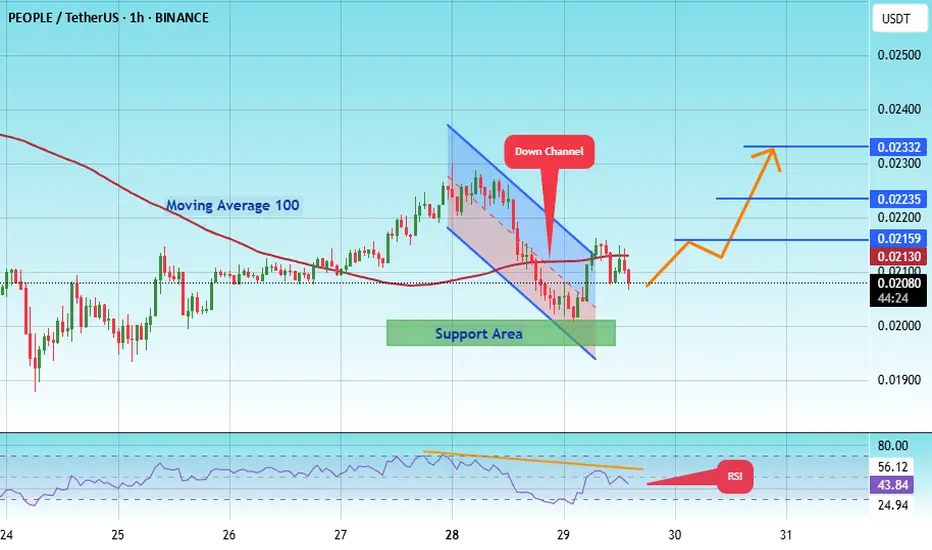
#PEOPLE/USDT Breakout in Action !#PEOPLE
The price is moving within an ascending channel on the 1-hour frame, adhering well to it, and is poised to break it strongly upwards and retest it.
We have support from the lower boundary of the ascending channel, at 0.01972.
We have a downtrend on the RSI indicator that is about to break and retest, supporting the upward move.
There is a key support area (in green) at 0.02000, which represents a strong basis for the upward move.
Don't forget one simple thing: ease and capital.
When you reach the first target, save some money and then change your stop-loss order to an entry order.
For inquiries, please leave a comment.
We have a trend of stability above the Moving Average 100.
Entry price: 0.02070
First target: 0.02160
Second target: 0.02235
Third target: 0.02332
Don't forget one simple thing: ease and capital.
When you reach the first target, save some money and then change your stop-loss order to an entry order.
For inquiries, please leave a comment.
Thank you.
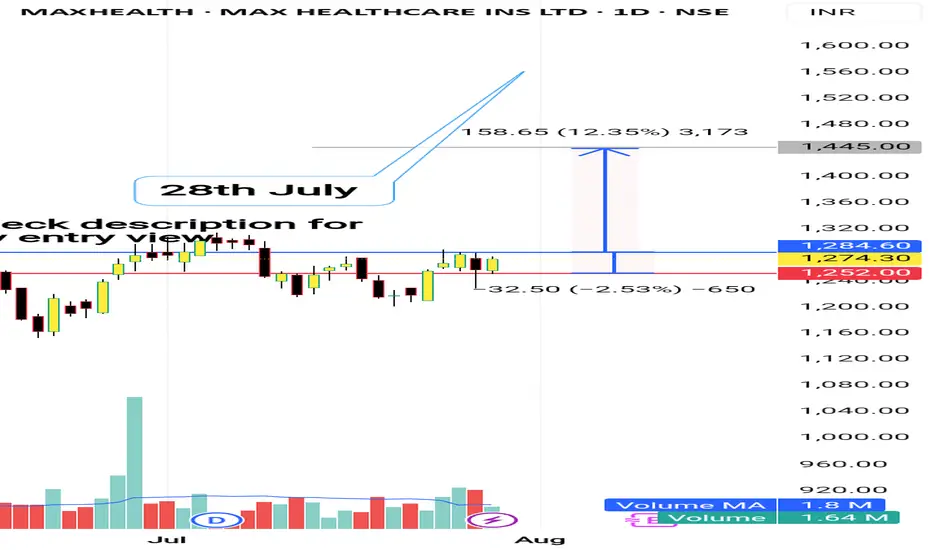
MAX HEALTH
I'm not a SEBI REGISTERED ANYLISIS
just for learning purpose
above the blue line close in D chart candle i will buy and put strictly SL to below red line...once candle close below Red line in D chart...i will close the Trade...
Note: 1
Breakout candle should close time..3.25pm..and 6 or below 6 points I will buy same day or I will wait for the blue line price to re-trace)
Note:2
If previous volume is buyers(for ex 10k) Breakout candle volume should be low in present day with buyers volume(below 10k for example 9k like this)
check the video for more details in playlist
target check the chart
WAIT FOR ENTRY......then after
WAIT FOR TARGET...... or
WAIT FOR STOPLOSS
educational purpose only
oits simple ORB WITH VOLUME BREAKOUT STRATEGY...with small condition apply for selecting the stocks
owt not response for your profit and loss
Under Article 19(1)(a) of the Indian Constitution, this content is an exercise of the fundamental right to freedom of speech and expression. It is for informational purposes only and should not be interpreted as professional financial advice or an endorsement of any strategy or approach.
harmonic idea of eth/btc to up trend A harmonic idea for an ETH/BTC uptrend involves identifying specific **bullish harmonic patterns** on the ETH/BTC price chart. These patterns, like the Gartley, Bat, Butterfly, or Crab, are characterized by precise **Fibonacci ratio relationships** between their price swings (labeled X, A, B, C, D).
The "idea" is that if an ETH/BTC chart forms one of these bullish harmonic patterns, it suggests a high probability that the ETH/BTC ratio (meaning ETH's value relative to BTC's) will **reverse upwards** from a specific "Potential Reversal Zone" (PRZ), which is calculated using the Fibonacci extensions and retracements of the pattern's legs. This implies that ETH is likely to outperform BTC in the near future, making a long position on ETH/BTC potentially profitable.
Traders look for confirmation of the reversal at the PRZ using price action (e.g., bullish candlesticks) or other indicators before entering a long trade.

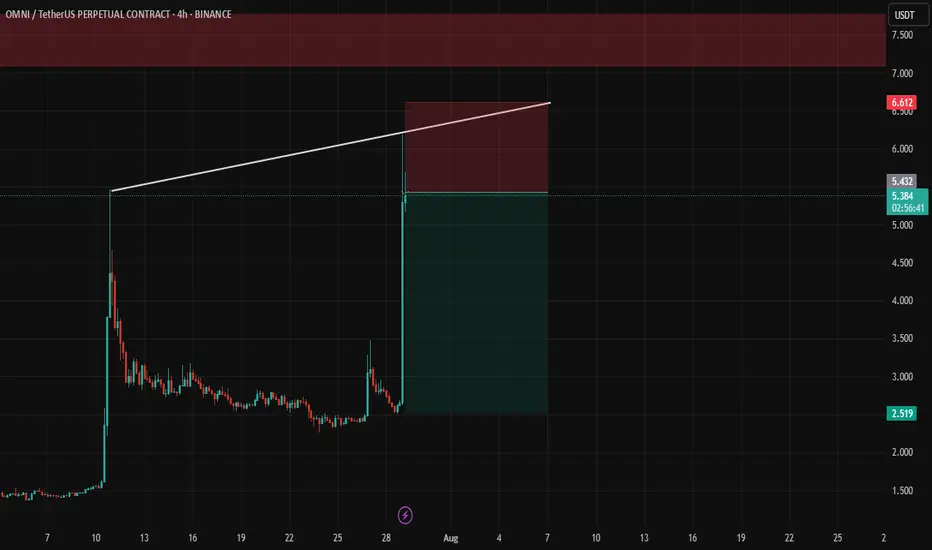
OMNI ShortShort Bias Active Now — but only with strict stop-loss near $6.35.
📌 Short Entry: $5.30–5.60
📌 Stop-Loss: $6.35
📌 Targets:
TP1: $4.60
TP2: $4.00
TP3: $3.50
PYPL LOOKING BULLISH JULY 29 2025Pypl is lloking good to go long. Whenever I trade at current price rule is clear that you manage your risk and quantities properly. Dont blindly trade in a hope to make quick money. Pypl looking good to go to $85 soon

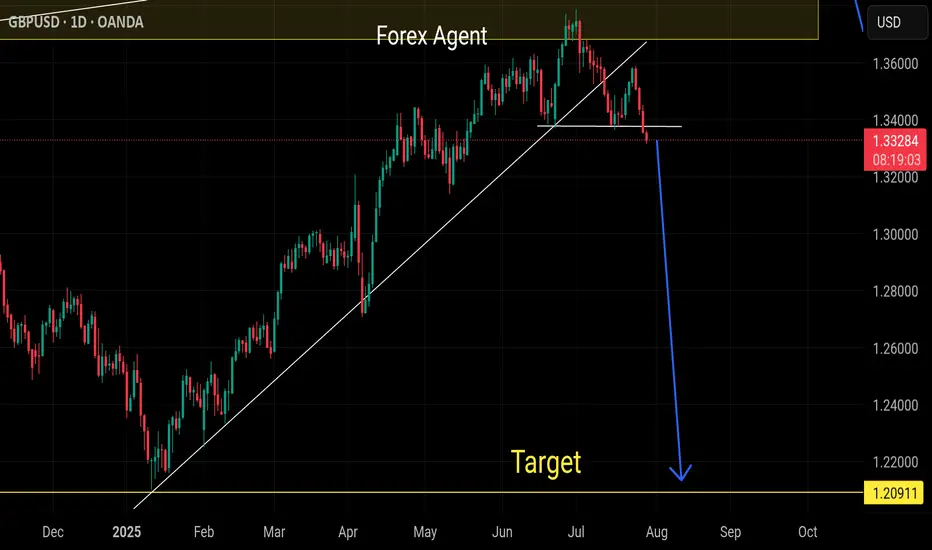
Sell gbpusdOur last selling idea already running 500+ pips in selling
More drop expected as USD gonna stronger all cross pairs
Daily support already breaks and also breaks the lower higher low