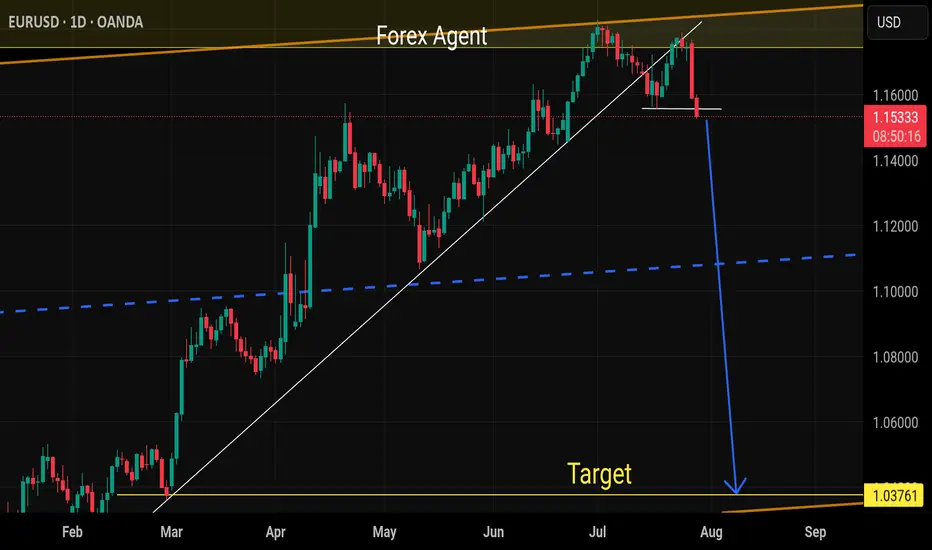
Sell eurusdOur last selling idea already running 300+ pips now
Still monthly overbought
Euro remains weak among all cross pairs
Daily buy trend already breaks and also lower high
Harmonic Patterns
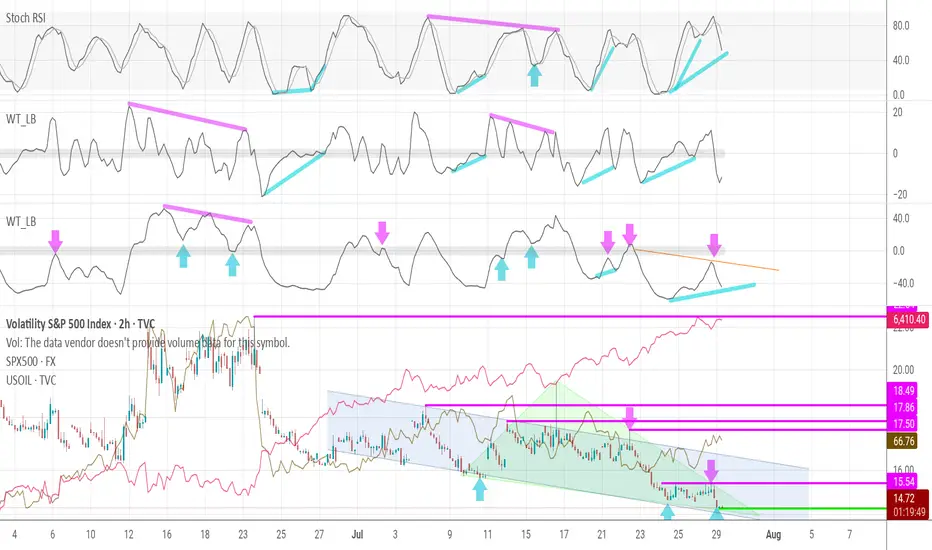
The VIX will be soon very positive.Fasten seatbelts!!!
As you can see:
Triangle pattern.
Indikator divergencys.
Greed maxium.
Eyes on the Break USDJPY Approaches Key Resistance with Bullish.USDJPY Technical Outlook Bullish Momentum Gaining Strength
USDJPY is currently displaying a strong bullish structure, having taken a clean bounce from the ascending trendline support. This upward movement was further validated as the pair successfully broke through a significant resistance level, triggering a Market Structure Shift (MSS) a clear signal that the prior trend has potentially reversed or evolved.
Following the MSS, a Break of Structure (BoS) to the upside has confirmed the continuation of this bullish momentum. The price action is now navigating above the previous demand zone, indicating strong buying interest in that area.
Notably, the market retraced slightly to retest the bullish engulfing zone, reinforcing the strength of buyers at that level. After this healthy retest, price action is once again pushing upward.
Now, all eyes are on the next key resistance zone. If USDJPY manages to decisively break above this level and prints a valid bullish confirmation (such as another structure break, strong candlestick pattern, or liquidity sweep followed by a reversal), it would open the door for an extended upside move, potentially targeting higher time frame liquidity pools.
Traders should closely monitor price behavior around this resistance zone. A confirmed breakout with volume or institutional candle formations could provide an excellent opportunity for continuation buys, in alignment with the prevailing bullish sentiment.

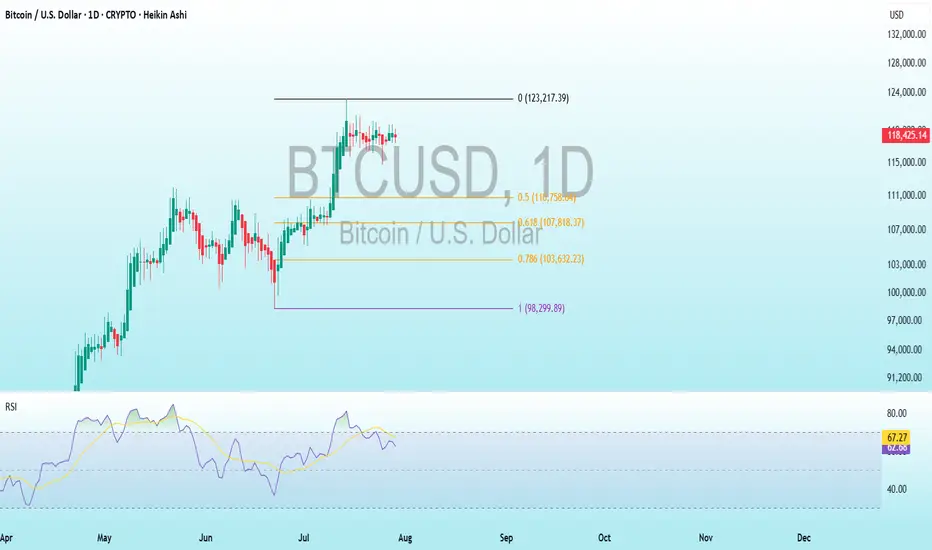
BTC Bearish DivergenceBINANCE:BTCUSDT
Rezistance Levels: 123,217.39.
Support: 98,299.89
Trade Setup:
Target 1: 110,758.64 (0.50 Fibonnaci Golden Zone).
Target 2: 107,818.37 (0.618 Fibonnaci Golden Zone).
Target 3: 103,632.23 (0.786 Fibonnaci Golden Zone).
Target 3: 98,299.89 (1 Fibonnaci).
Stop Loss: 123,217.39 (above recent high, ~25% above current price).
RSI Analysis: The RSI shows a bullish divergence (price making lower lows while RSI makes higher lows), suggesting potential upward momentum. Current RSI is around 62.80, nearing overbought territory (>70), so caution is advised.
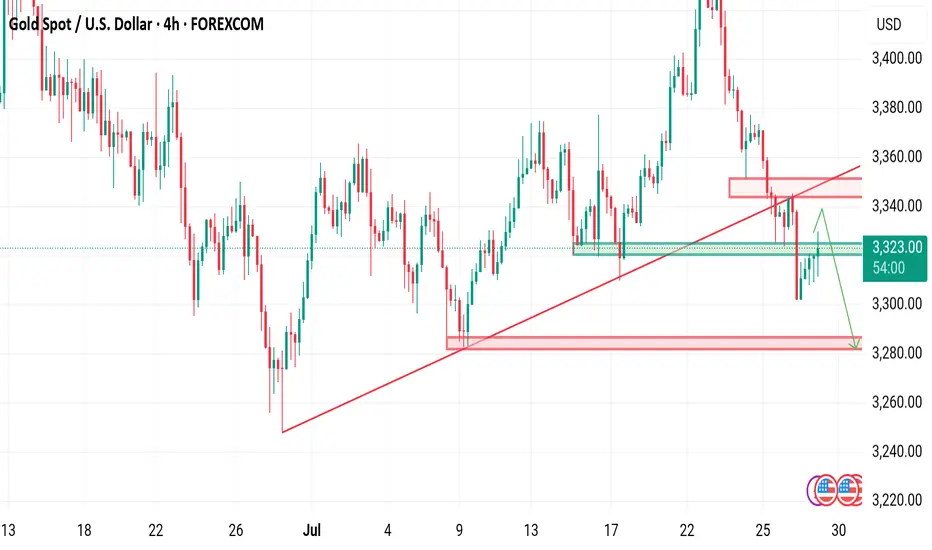
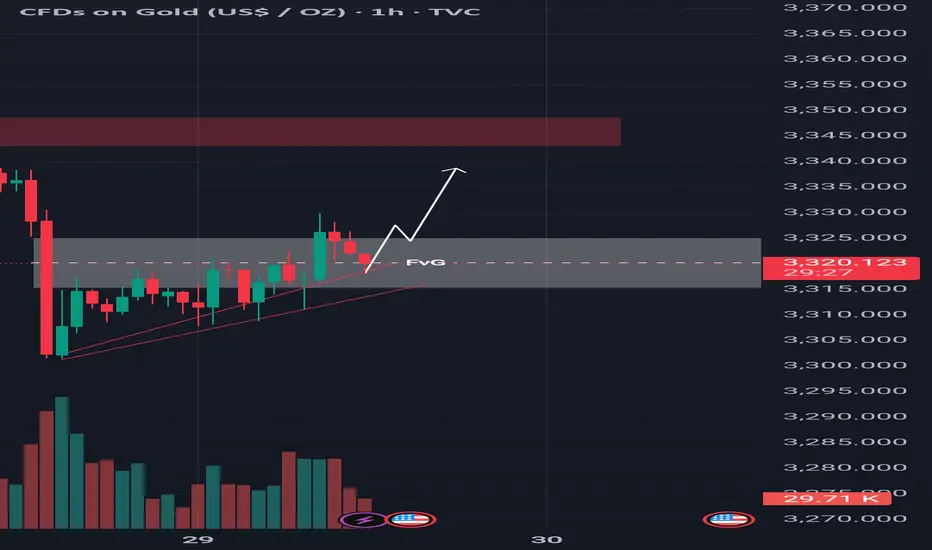
Technical Shift FVG Break and Retest Hints at Further Upside!Gold is currently showing strength after taking support from the trendline, indicating buyers are stepping in around that level. Moreover the price has successfully broken above the 4-hour bearish Fair Value Gap (FVG), which suggests a shift in market sentiment. This FVG zone has now transitioned into an inversion level meaning what was once a resistance area could now act as support. At the moment, the market is pulling back, likely to retest this newly flipped zone. If buyers defend this area on the retest, it could provide the base for a potential bullish continuation. From this zone, we may witness a strong upward move, with the next target likely being the liquidity resting above key resistance levels. As always, it’s important to conduct your own analysis and manage risk accordingly (DYOR).
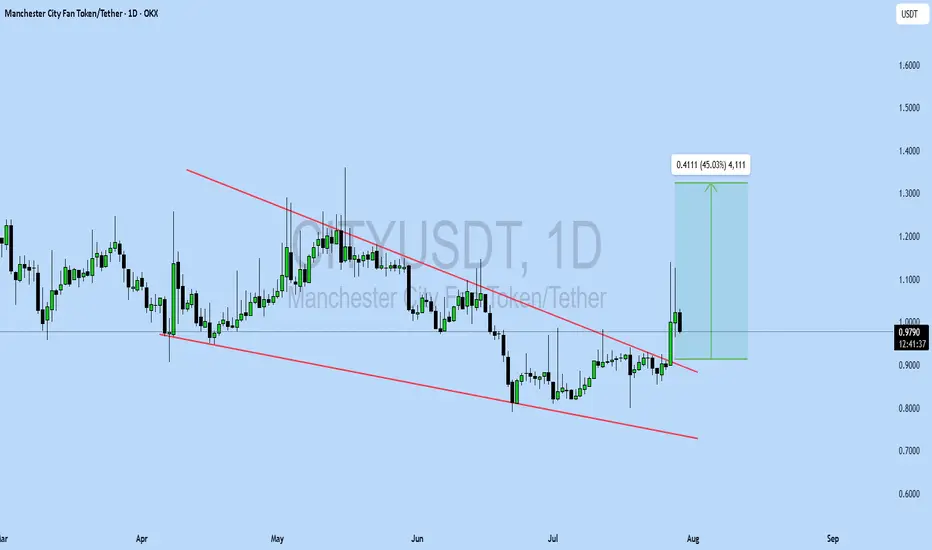
CITYUSDT UPDATE
Pattern: Falling Wedge Breakout
Current Price: \$0.9778
Target Price: \$1.39
Target % Gain: 45.03%
Technical Analysis: CITYUSDT has broken out of a falling wedge pattern on the 1D timeframe, confirming a bullish reversal. Strong bullish candles and increased volume support further upside toward the target.
Time Frame: 1D
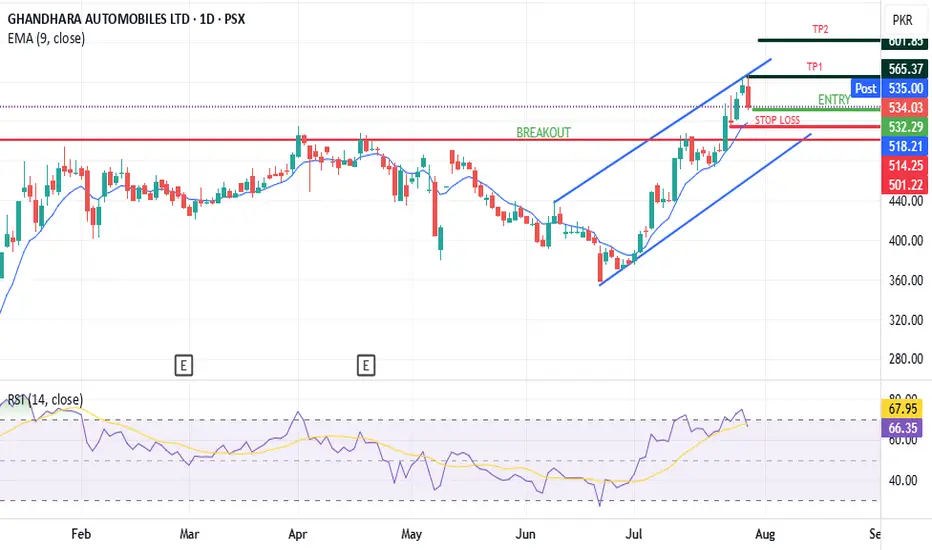
GAL on the rise after breakoutgal is rising after submitting breakout on daily charts, currently price has taken a correction which makes it attractive for buying at current price.
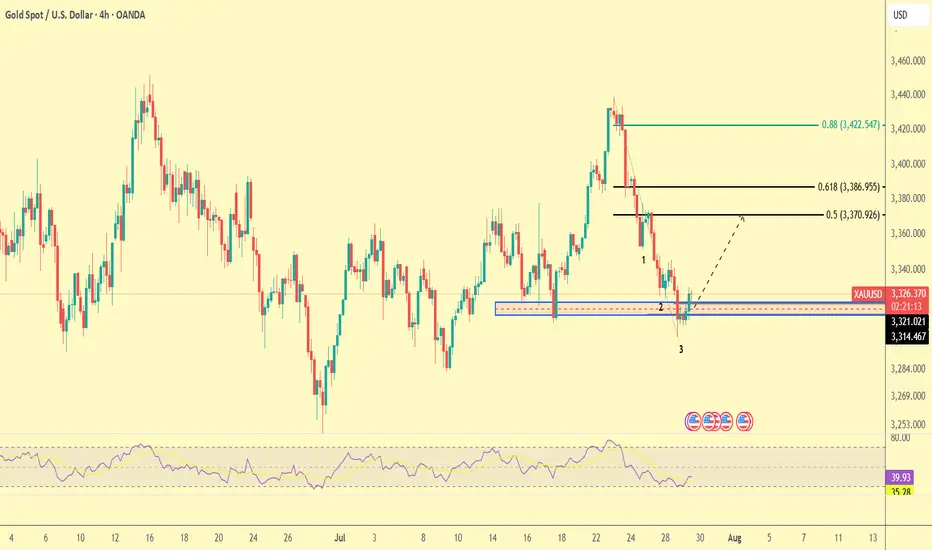
Gold Trade Plan 29/07/2025Dear Traders,
it time to recover Gold after Deep Correction ,
i expect price will be continue upward movement
with Target 1 : 3339
Target 2 : 3351
Target 3 : 3370
Regards,
Alireza!
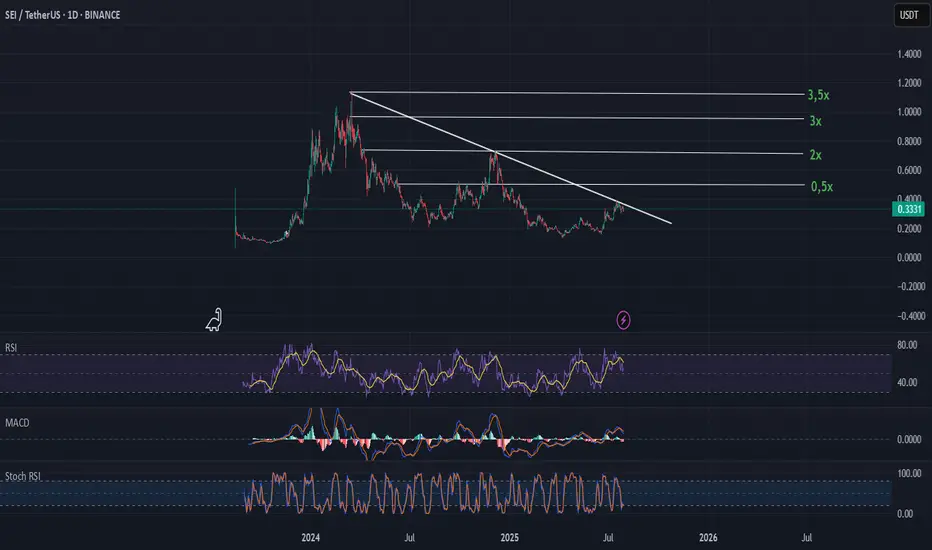
SEI $0.33 back to ath?SEI since December bearish momentum to June.
Around June the bullish momentum started.
We´re looking for NYSE:SEI to continue and break through support at $0.34.
Macd = Avg Bullish
Rsi = Avg Bullish
Stoch Rsi = Bullish
If this zone holds, the risk/reward setup favors bulls with clear upside targets.
Chart is based on rsi, macd, stoch rsi
#crypto #cryptocurrency #altcoins
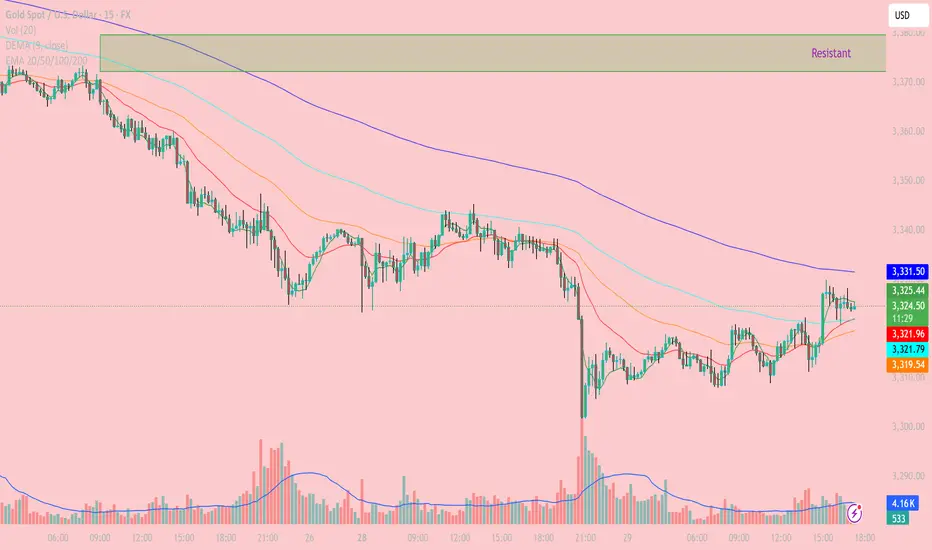
XAUUSD – Gold Intraday Technical Analysis (15-Min Chart) - July Current Price: 3,323.93 USD
Timeframe: 15 minutes
Last update: 17:14 UTC+7
- Trend Overview:
The 15-minute chart shows a minor recovery after a sharp drop in gold prices. However, overall pressure remains bearish as price continues to trade below all key EMAs (50–100–200), and the bulls have yet to break through significant resistance above.
- Key Technical Zones:
Nearby Resistance:
3,331.57 (EMA200): dynamic resistance, repeatedly tested but not broken
3,340 – 3,350: supply zone + 0.618 Fibonacci retracement
3,360 – 3,375: strong resistance zone (purple box), previous major rejection area
Nearby Support:
3,321.70 – 3,319.34 (EMA50 – EMA100): also aligns with 0.382 Fibonacci support
3,309 – 3,310: previous low, potential demand zone on deeper pullback
- Technical Analysis:
EMA & Structure:
Price is testing EMA200 (3,331.57) – a key level to watch for confirmation of any trend reversal. However, the larger trend remains bearish as long as this resistance holds.
EMA9 and EMA20 have crossed above EMA50, suggesting short-term bullish momentum, though not yet strong enough to confirm a full reversal.
Volume Analysis:
Recent bullish candles were supported by higher volume, but the current rally is weakening in volume – a sign of fading buying pressure.
RSI (not shown but recommended):
Watch for RSI break above 60 to signal potential continuation toward higher resistance levels.
- Trading Strategies:
Scenario 1 – Sell at Resistance (Sell on Rally):
Entry zone: around 3,330 – 3,335
Stop loss: above 3,340
Targets: 3,320 → 3,310
Rationale: Price is testing EMA200 and resistance; no confirmed breakout yet
Scenario 2 – Short-Term Buy on Dip:
Entry zone: 3,319 – 3,321 (EMA50/100 confluence)
Stop loss: below 3,308
Targets: 3,330 – 3,335
Rationale: Minor support holding, potential short bounce if price stabilizes
- Conclusion:
Gold is attempting a short-term rebound, but the broader trend remains bearish unless price breaks above 3,340 – 3,350 resistance. For now, focus on short setups at resistance and scalping small bounces from strong support zones.
Follow to receive more daily strategies – and don’t forget to save this if you find it useful.
Got a different view on gold today? Let’s discuss it in the comments!
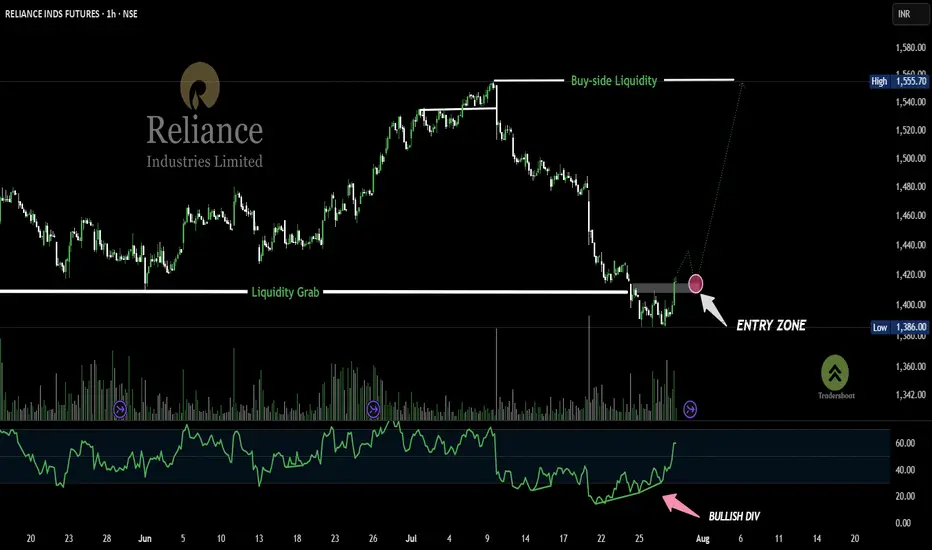
RELIANCE-1H Smart Money Strikes AgainThis 1H chart of RELIANCE INDS FUTURES shows a classic Smart Money Reversal Setup.
Price first executes a sweep of sell-side liquidity (marked "SWEEP") and then confirms strength with a bullish divergence in RSI 📈.
A possible retracement into the demand zone (highlighted pink circle) could offer a high-probability long entry, targeting the previous high (Buy-side Liquidity Zone).
Volume spike + RSI trend breakout = institutional accumulation signs.
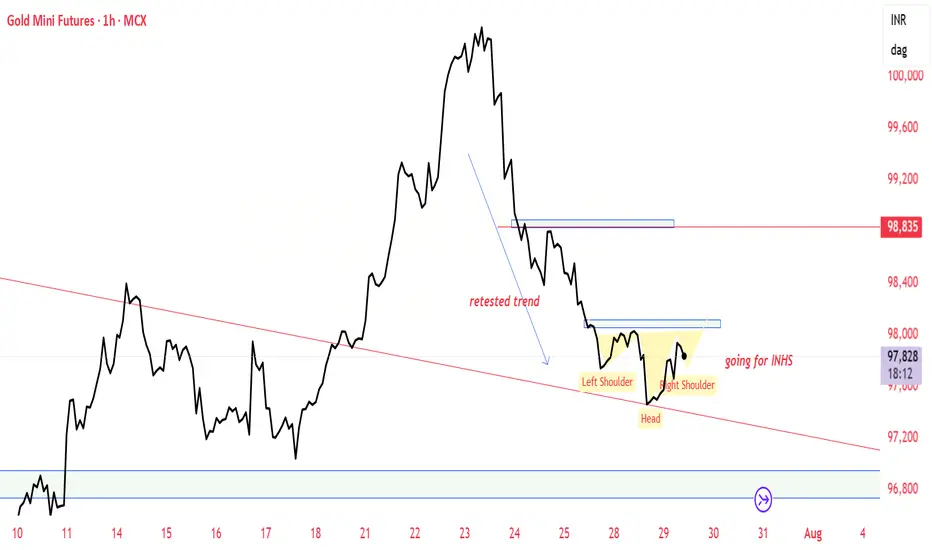
GOLD MCX BULLISH VIEWAfter 4 days continuous down side Some pullback relief expected till 99000. Tested trendline near support zone of 96900 and supply zone near 98200-98500-99000
Please do your own research before taking any trading decisions
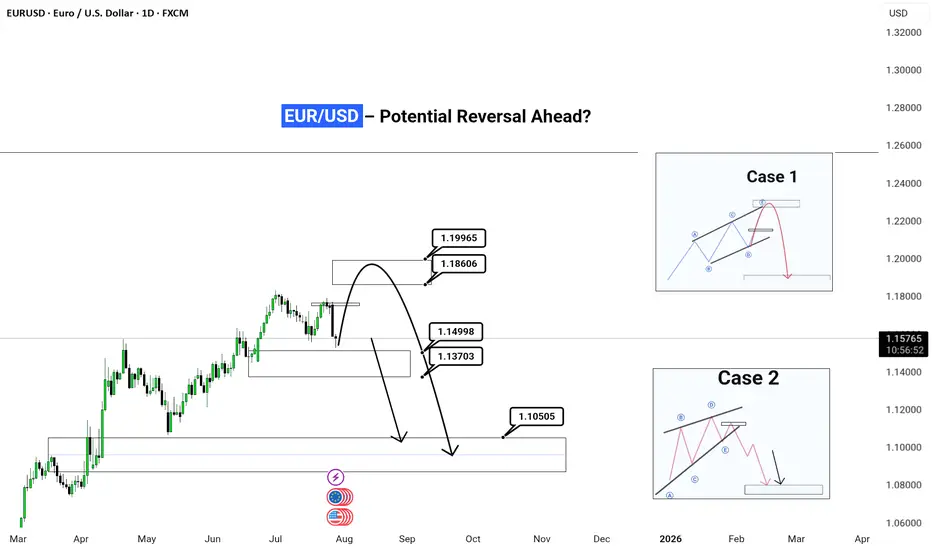
EUR/USD – Potential Reversal Ahead?| Daily Timeframe | Outlook (Published July 29, 2025)
⚠️ Setup Summary:
This chart is highlighting a critical juncture for EUR/USD, where price is nearing a major decision zone. Based on price action and wave structure, there are two likely scenarios unfolding. Let’s break it down simple .
EUR/USD has seen a strong bullish rally from March to July, but current price action suggests momentum exhaustion. Now, we’re watching for signs of a reversal or deeper correction in the coming weeks.
📊 Two Probable Scenarios:
✅ Case 1 – Simple Corrective Wave (ABC Pattern)
Expected Move:
Price may spike up into the 1.186–1.199 zone (final bull trap/liquidity grab)
Followed by a sharp bearish move (impulse C wave) towards 1.10505 zone
This reflects a clean correction before possible reaccumulation
📌 This is often seen after retail traders get caught chasing highs late in a move.
---
✅ Case 2 – Complex Corrective Wave (ABCDE Flat/Running Triangle)
Expected Move:
A longer, more sideways and choppy correction into Q1 2026
Price forms a distribution pattern under resistance
After a breakout below the structure, a sharp drop to 1.10505 zone (or deeper)
📌 This is a slower bleed-out pattern before continuation lower. Often traps both buyers and sellers in the chop.
---
🎯 Current Price: 1.15756
We are in a decision zone, and watching the reaction around 1.165–1.186 will be crucial to validate either Case 1 or Case 2.
---
💡 My View:
> Wait for confirmation at the 1.186 zone.
If price rejects strongly from there, Case 1 is in play. 👈❤️
If price chops sideways and holds higher for weeks, expect Case 2 structure.
---
🚨 Reminder for Traders:
Don’t chase moves — let the market show its hand
Use proper risk management
Combine this structure with session timing, liquidity sweeps, and fundamental events
---
💬 Drop a comment if you're seeing similar setups in other majors!
🧠 Follow for real-time updates & actionable setups.
#EURUSD #ForexAnalysis #WaveTheory #SmartMoney #OrderBlock #LiquidityHunt #ForexStrategy #ElliottWave #PriceAction #FXTrader #TradingView
---
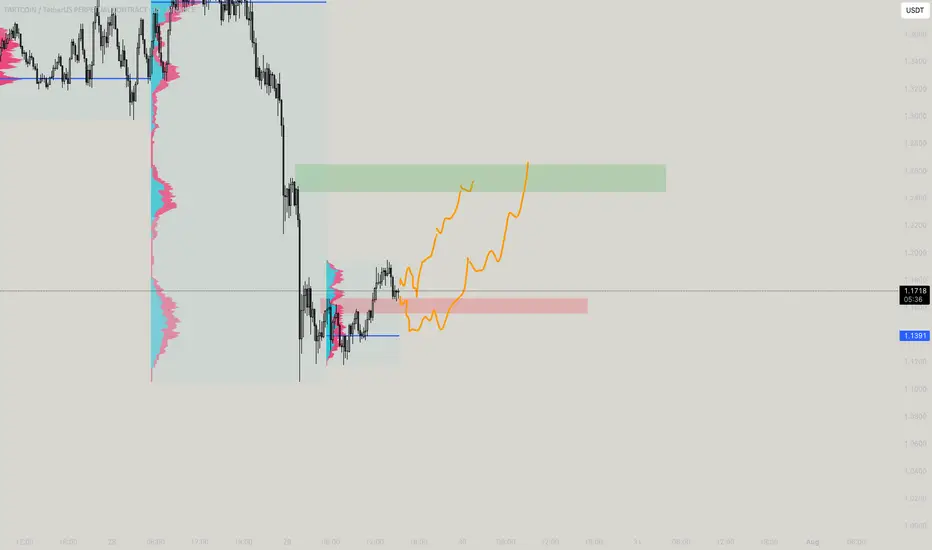
Silent and Mega FartsSo silent farts will fall and go back and mega will directly blow the top off hahahaha
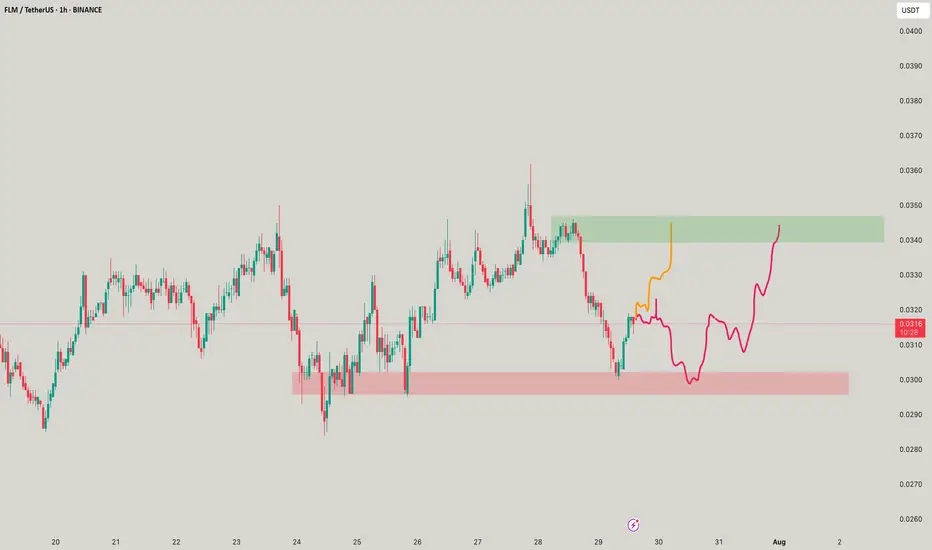
Mlem mlem - FLM USDTFLMUSDT if luck is lucly then u see orange or if not so lucky so the red ones happen!
EPICUSDT.P LONGThe price broke down the symmetrical triangle but we will not plan for short as we are already long biased so we will only look a good place to buy. Until the price retest the triangle bottom with a bearish candle and strong volume.
Why I planned this trade? As we all know we are already in a kind of bull run and this is most probably a fakeout and i think price will bounce back from our entry point.
Lets wait and watch only trade when see any bullish candle and bullish momentum at our entry level.
Follow me and support me please.

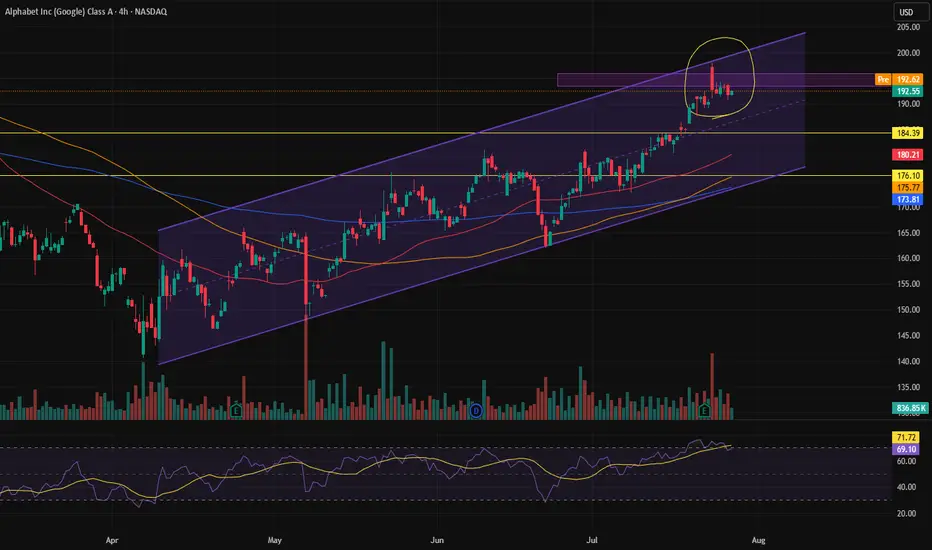
Waiting for a buy trigger.Google stock is at a good spot where it could make a strong upward move. At this price level, we see multiple confluences both in terms of trend and from the perspective of indicators and oscillators. So, if it manages to break through this level, the price could move nicely.

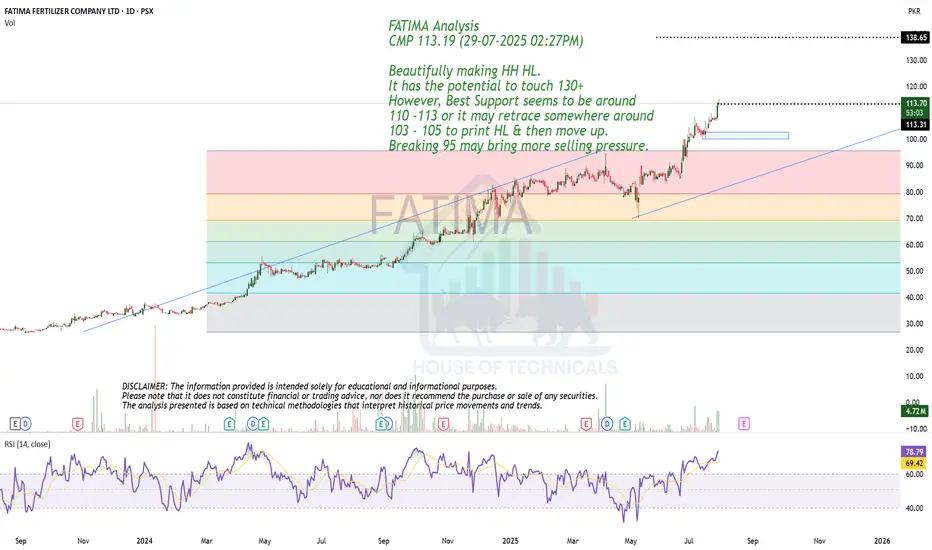
Beautifully making HH HL.FATIMA Analysis
CMP 113.19 (29-07-2025 02:27PM)
Beautifully making HH HL.
It has the potential to touch 130+
However, Best Support seems to be around
110 -113 or it may retrace somewhere around
103 - 105 to print HL & then move up.
Breaking 95 may bring more selling pressure.
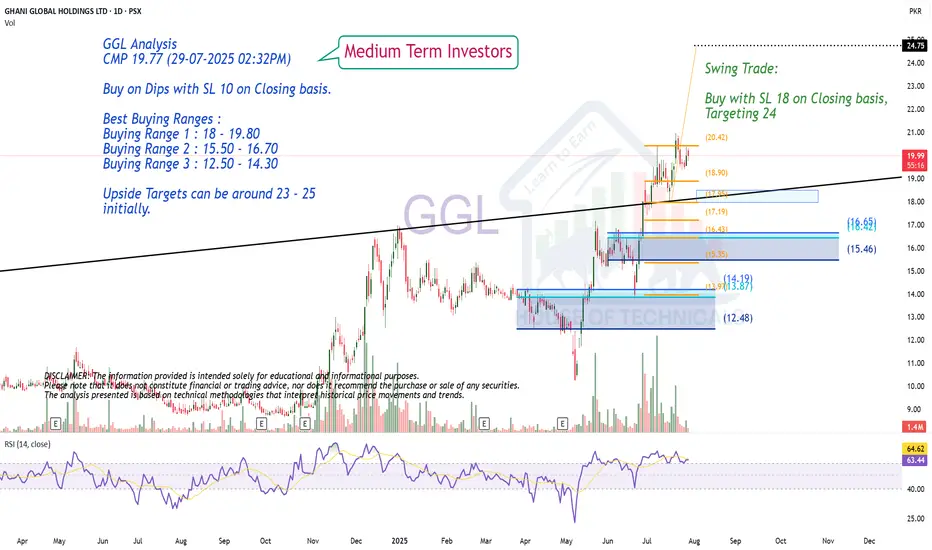
Buy on Dips with Proper SLGGL Analysis
CMP 19.77 (29-07-2025 02:32PM)
Buy on Dips with SL 10 on Closing basis.
Best Buying Ranges :
Buying Range 1 : 18 - 19.80
Buying Range 2 : 15.50 - 16.70
Buying Range 3 : 12.50 - 14.30
Upside Targets can be around 23 - 25
initially.
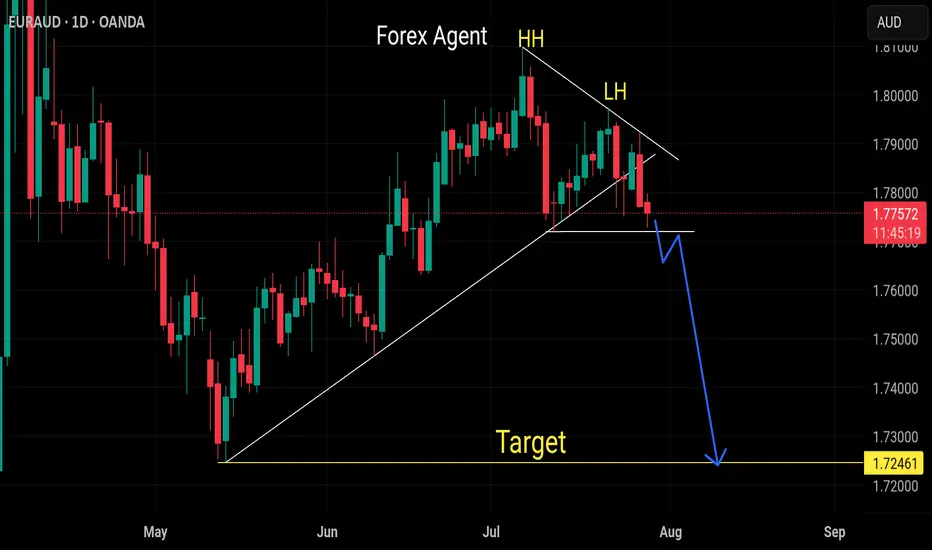
Sell euraud Our last selling ieea already running 400+ pips
Now wait to breaks the previous lower high then sell witb confirmation
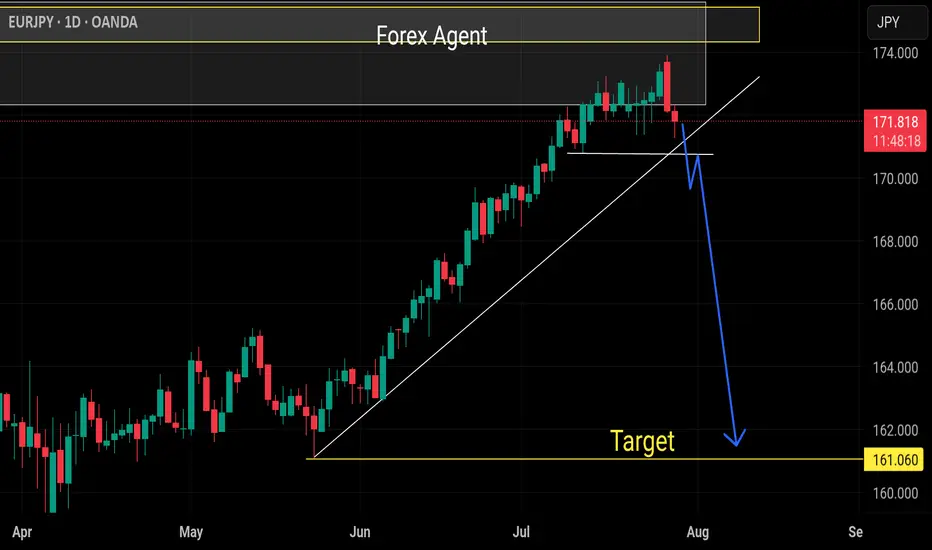
Sell eurjpyOur last selling idea already running 200+ pips
More selling expected, just wait to break this weak trend then sell again with confirmation
XAUUSD on Bearish values and volume Gold is currently below rising channel and holding the Range of 3320-3335,although yesterday implusive drop is incompleted without testing 3290-3280
Eyes on DXY
What's possible scanarios we have?
▪️I will wait next for my sell trades at 3338-3345 area but what we have to watch during that time H4 candle closing.if H4 & H1 candle close above I will not hold or renter sell also below 3320 we have implusive drop.
▪️Secondly if H4 candle closing above 3345 this down move will be invalid and Price-action will reached 3370.
#XAUUSD