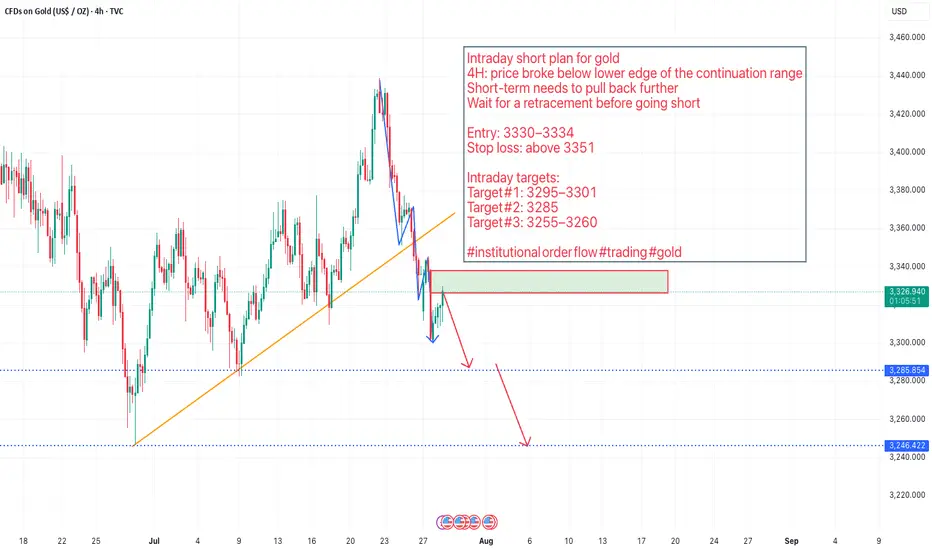
Short Gold! Intraday short plan for gold
4H: price broke below lower edge of the continuation range
Short‑term needs to pull back further
Wait for a retracement before going short
Entry: 3330–3334
Stop loss: above 3351
Intraday targets:
Target #1: 3295–3301
Target #2: 3285
Target #3: 3255–3260
#institutional order flow #trading #gold
Harmonic Patterns
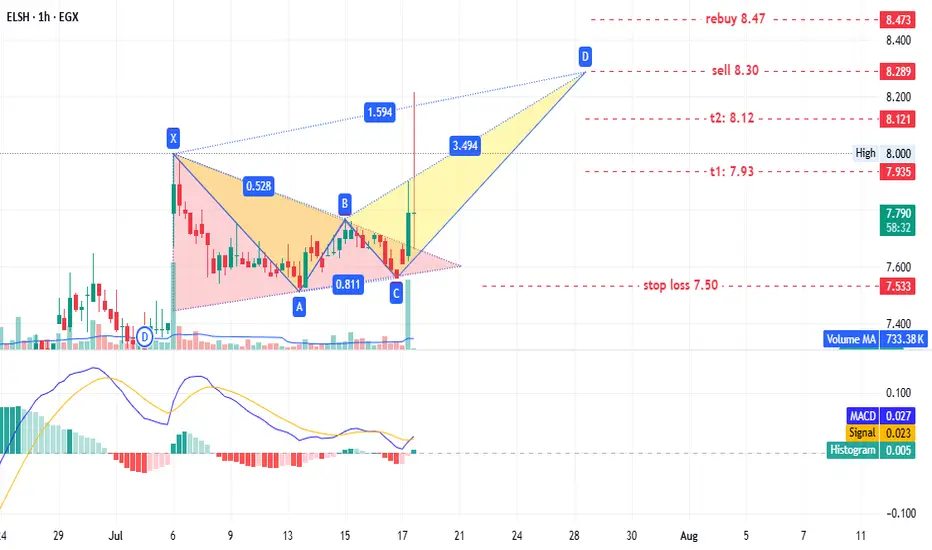
ELSH - old player EGX:ELSH timeframe: 1 hour.
A triangle pattern was identified, targeting 8.20. No new entry is recommended for shareholders, but if prices retest the triangle pattern at 7.65–7.60, it could present a low-risk entry opportunity.
This may also form a potential bearish Gartley pattern with targets:
- T1: 7.93
- T2: 8.12
- T3: 8.30 (sell point)
Stop loss: 7.50.
If prices continue rising and close above 8.47, consider rebuying what was sold at 8.30.
Disclaimer: This is not financial advice, only our analysis based on chart data. Consult your account manager before investing.
Good luck!
Head and shorder Head and shorder
Conformation on three time frame
Take sell on the second shorder formation
Target 1:3
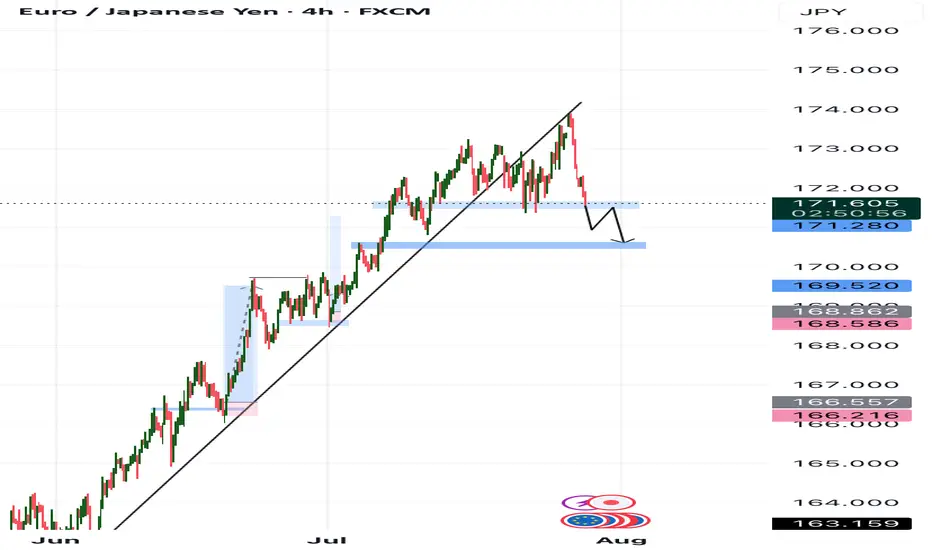
EURJPY Bearish! Short EURJPY
We see a verg bearish weekly BAT!
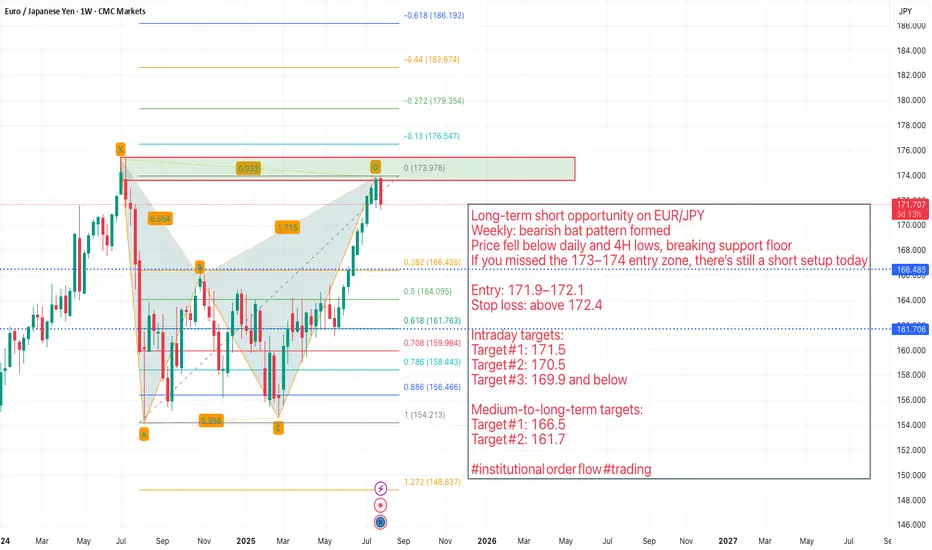
Long‑term short opportunity on EUR/JPY
Weekly: bearish bat pattern formed
Price fell below daily and 4H lows, breaking support floor
If you missed the 173–174 entry zone, there’s still a short setup today
Entry: 171.9–172.1
Stop loss: above 172.4
Intraday targets:
Target #1: 171.5
Target #2: 170.5
Target #3: 169.9 and below
Medium‑to‑long‑term targets:
Target #1: 166.5
Target #2: 161.7
#institutional order flow #trading
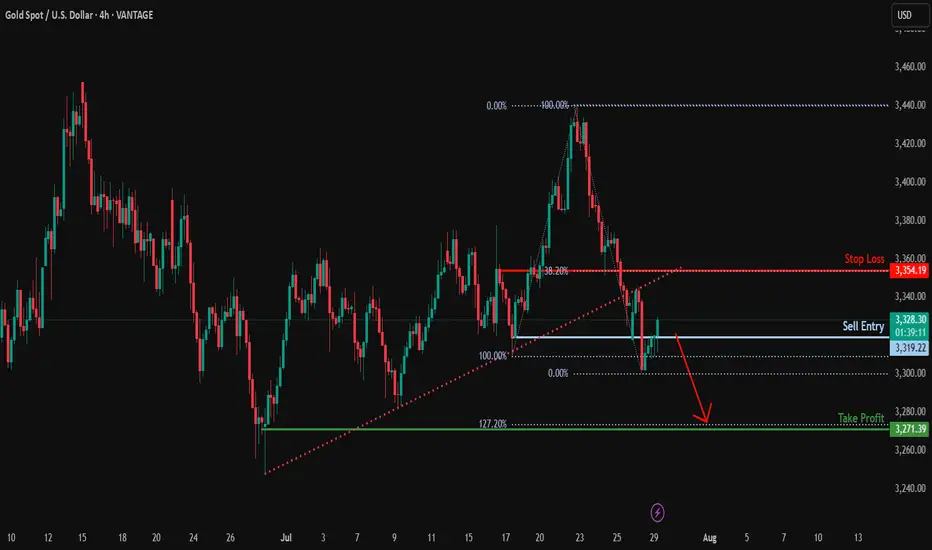
XAUUSD-Bearish reversal?XAU/USD is rising towards the resistance level, which serves as a pullback resistance and could drop from this level to our take-profit target.
Entry: 3,319.22
Why we like it:
There is a pullback resistance.
Stop loss: 3,354.19
Why we like it:
There is a pullback resistance that aligns with the 38.2% Fibonacci retracement.
Take profit: 3,271.39
Why we like it:
There is a swing low support that lines up with the 127.2% Fibonacci extension.
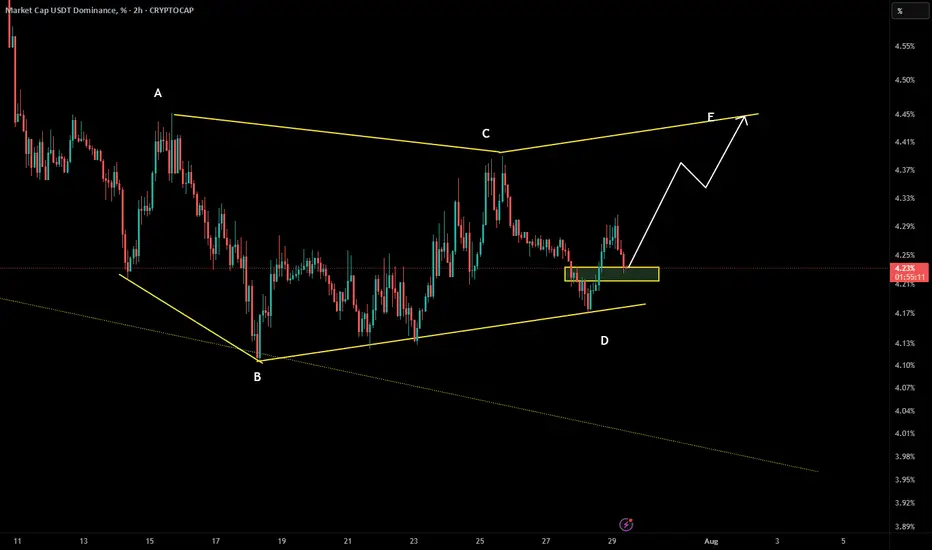
USDT Dominance – Updated Elliott Wave & ICT AnalysisYesterday, we anticipated a bullish reaction from the 4.20%–4.22% support zone, and the market followed through perfectly. The current structure is forming a contracting triangle (ABCDE), and we are now likely heading into wave E.
🔹 Wave Structure (NeoWave View):
Wave D has reacted sharply from the expected support.
Wave E is now in progress, targeting the 4.42%–4.44% resistance zone.
This could complete the triangle structure and signal a potential trend reversal.
🔸 From ICT/Smart Money Perspective:
The market tapped into a clean bullish Order Block.
Below the support zone, there was clear liquidity sweep followed by a strong BOS (Break of Structure) upward.
All signs point to short-term strength in USDT.D.
📌 Scenarios:
Bullish case (primary): Wave E completes around 4.43%–4.44%, followed by possible reversal.
Invalidation: A break below 4.20% with no bullish defense would invalidate this triangle and require reassessment.
🧠 Takeaway:
This structure could mark a temporary market top for altcoins as USDT.D pushes higher. Keep an eye on the 4.43% level.
📡 Analysis by CryptoPilot – navigating the market with precision.
#CryptoPilot #USDT.D #Elliot #NeoWave #MarketStructure #TrendChannel #BOS #Altcoins #CryptoTrading
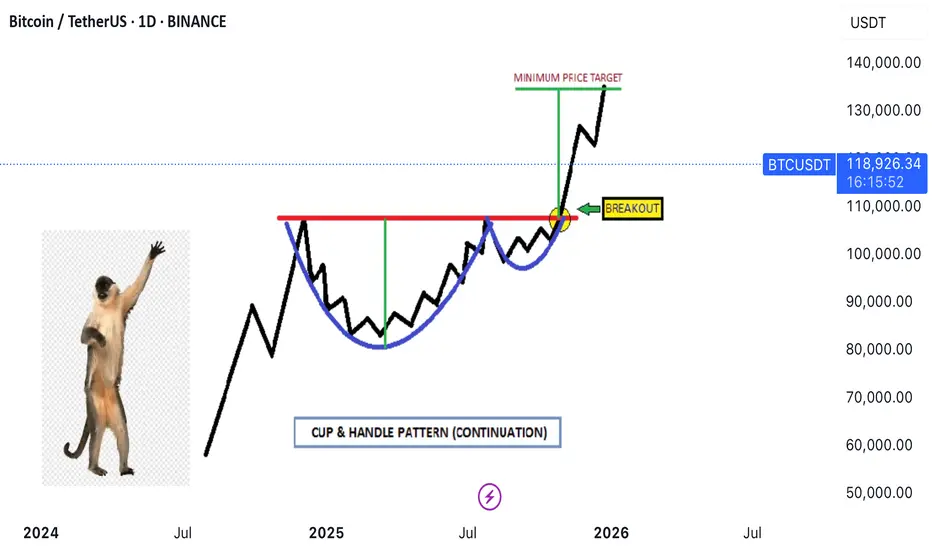
Thea **Cup and Handle** pattern✨ **Imagine the market serving profits in a teacup!**
Thea **Cup and Handle** pattern isn’t just a technical term—it’s the market whispering, *“Get ready for liftoff!”* Let’s break it down in an engaging way:
### ☕ The Cup
- Picture a graceful drop in price that curves back up, forming a U-shape.
- It’s like the market takes a sip, then refills—symbolizing recovery and building strength.
### 🛠️ The Handle
- After the cup fills, the price dips slightly again, forming a small slope downward.
- This is the “handle”—a moment of consolidation, often with lower trading volume.
- It’s the calm before the bullish storm.
### 💡 Bullish Signal
- When the price **breaks above the handle’s resistance**, it’s like the market pulls the trigger.
- This signals a potential buying opportunity as the trend resumes upward.
### 📆 Duration
- The cup can take weeks or even months to form, while the handle is shorter and more subtle.
- Patience pays off, as the breakout often leads to explosive momentum.
---
🏆 *Want proof?* Check the comments—one of our past trades using this exact pattern scored a massive win of **100,000 pips**! 🚀
Technical analysis isn’t just charts and numbers—it’s decoding the market’s rhythm.
Option Chain AnalysisTable of Contents
Introduction to Option Chain
What Is an Option Chain?
Key Components of an Option Chain
Call vs. Put Options in the Chain
How to Read an Option Chain
Open Interest (OI) Analysis
Implied Volatility (IV) Analysis
Strike Price Selection
Support and Resistance Levels from Option Chain
Option Chain for Intraday & Swing Trading
1. Introduction to Option Chain
In the world of options trading, success is not just about buying calls or puts randomly—it’s about understanding market data. One of the most important tools for analyzing this data is the Option Chain. Whether you're a beginner or an advanced trader, mastering option chain analysis can help you identify market sentiment, key levels, and trading opportunities.
2. What Is an Option Chain?
An Option Chain, also known as an Options Matrix, is a tabular representation of all available option contracts (both Call and Put) for a particular underlying asset—like Nifty, Bank Nifty, Reliance, TCS, etc.—for a specific expiry date.
It shows:
Strike prices
Premiums (Prices)
Open interest (OI)
Volume
Implied volatility (IV)
Bid/ask prices
Think of it like a menu card for options, showing all the possible trades you can take, and key stats about each.
3. Key Components of an Option Chain
✅ Strike Price:
The price at which you can buy (Call) or sell (Put) the underlying asset.
✅ Premium (LTP):
The last traded price (LTP) of the option.
✅ Open Interest (OI):
The number of open contracts for a strike price. Indicates trader interest.
✅ Change in OI:
The change in open positions compared to the previous day.
✅ Volume:
The number of contracts traded in the current session.
✅ Implied Volatility (IV):
Market's expected volatility of the underlying asset.
4. Call vs. Put Options in the Chain
In every option chain, you’ll see two sections:
Call Options (Left side) Put Options (Right side)
Bullish expectation Bearish expectation
Buy if expecting upside Buy if expecting downside
Sell if expecting sideways/down Sell if expecting sideways/up
Usually, the middle column contains strike prices, with Call data on the left and Put data on the right.
5. How to Read an Option Chain
Let’s take an example:
Assume Nifty is trading at 22,200. You look at the Nifty option chain.
You’ll see multiple rows of strike prices (e.g., 22,000, 22,100, 22,200…) and for each, data like LTP, OI, IV.
Look for:
ATM (At-the-money): Closest strike to the current price (22,200).
ITM (In-the-money): For calls, strikes < spot; for puts, strikes > spot.
OTM (Out-of-the-money): For calls, strikes > spot; for puts, strikes < spot.
Example:
22,200 is ATM.
22,100 Call is ITM.
22,300 Call is OTM.
6. Open Interest (OI) Analysis
OI is one of the most powerful indicators in option chain analysis. It shows where traders are placing their bets.
✔️ What to Look For:
High OI = Strong interest at that strike.
Increase in OI = New positions being added.
Decrease in OI = Positions being closed.
✔️ Interpretations:
High OI in Call → Resistance level.
High OI in Put → Support level.
Let’s say:
22,500 Call has 30 lakh OI → Strong resistance.
22,000 Put has 35 lakh OI → Strong support.
This gives you the trading range of Nifty: 22,000 to 22,500.
7. Implied Volatility (IV) Analysis
IV represents the market's future expectations of volatility. Higher IV means higher premiums.
✔️ Why IV Matters:
When IV is high, options are expensive.
When IV is low, options are cheaper.
✔️ Practical Use:
Sell options when IV is very high (premium is inflated).
Buy options when IV is low (premium is cheap).
8. Strike Price Selection
Choosing the right strike is key for successful trading.
✔️ For Buying Options:
Buy slightly ITM for better delta and time value.
ATM works for short-term, fast movements.
✔️ For Selling Options:
Sell OTM options with high OI and low IV.
✔️ Tip:
Always check the OI and IV before choosing a strike. Avoid illiquid strikes (with low OI or volume).
9. Support and Resistance Levels from Option Chain
You can spot support and resistance based on OI data.
✔️ Support:
Strike where Put OI is highest.
E.g., 22,000 Put with highest OI = Support zone.
✔️ Resistance:
Strike where Call OI is highest.
E.g., 22,500 Call with highest OI = Resistance zone.
This helps you create a trading range.
10. Option Chain for Intraday & Swing Trading
✅ Intraday Trading:
Watch change in OI during live market.
Spike in Call OI → Possible resistance forming.
Spike in Put OI → Possible support forming.
✅ Swing Trading:
Analyze overall OI trend.
Look at monthly expiry data.
Identify positional buildup or unwinding.
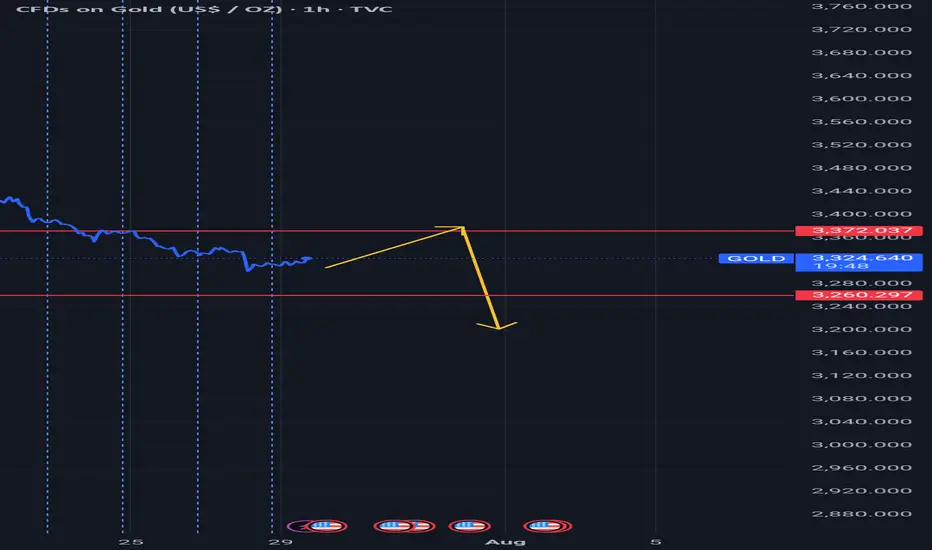
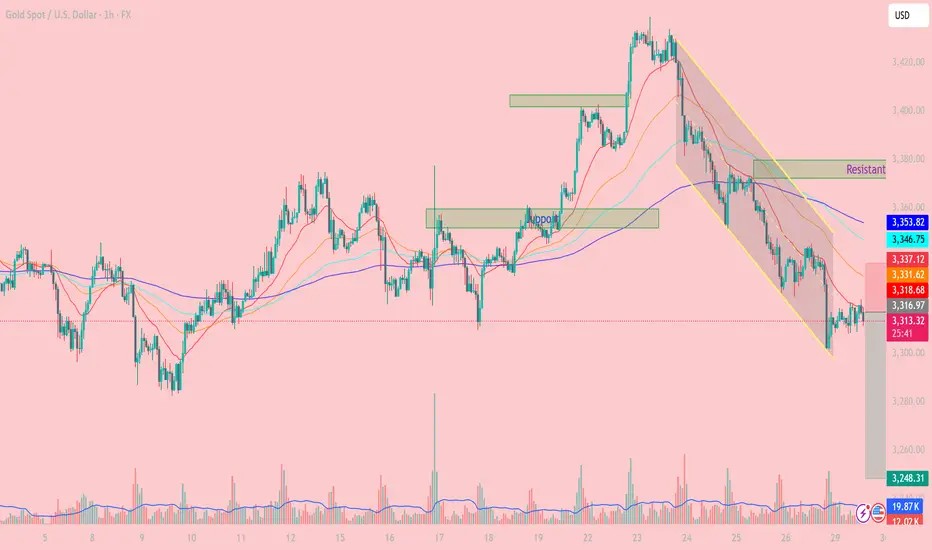
Downward Pressure Resumes After Channel BreakdownXAUUSD OANDA:XAUUSD – Downward Pressure Resumes After Channel Breakdown: Key Levels and Strategy for Today
As of the July 29 session, gold (XAUUSD) remains under short-term bearish pressure, having broken below the descending price channel on the 1H timeframe. The market structure confirms a dominant bearish trend as price continues to trade below the EMAs cluster.
1. Price Action and Market Behavior
XAUUSD is forming a clear sequence of lower highs and lower lows, confirming a short-term downtrend.
Price is currently hovering around $3,316 after breaking below the lower boundary of the channel, signaling potential continuation of the sell-off.
2. Key Resistance and Support Levels
Immediate resistance: 3,337 – 3,346 USD (aligned with EMA20, EMA50 and prior channel resistance).
Major resistance: 3,378 – 3,385 USD (confluence of Fibo and former high).
Near-term support: 3,300 USD (psychological level).
Major support: 3,248 USD (projected target based on measured move from channel height).
3. Technical Indicators
EMA20 and EMA50 are both below EMA200, forming a classic “death cross” – a strong bearish signal.
Volume increased on the breakdown, reinforcing the strength of bearish momentum.
RSI remains below 50, indicating weak bullish retracements and room for further downside.
4. Trading Strategy
Primary Strategy: Sell on Rally
Ideal entry zone: 3,331 – 3,346 USD.
Stop Loss: Above 3,353 USD (above key resistance zone).
TP1: 3,300 USD.
TP2: 3,248 USD (extended target based on breakout structure).
Alternative Strategy: Countertrend Long
Only consider buy setups if strong reversal candles and bullish RSI divergence appear near 3,248 USD.
XAUUSD continues to face downside risk after the channel breakdown. Unless bulls reclaim the 3,337 – 3,346 zone, price is more likely to drift lower toward 3,300 and potentially 3,248. Traders should remain patient and wait for clean setups around these key zones.
Follow for more strategies and remember to save this post if you found it helpful.
Let me know if you'd like a short version for the TradingView caption or hashtags suggestion.
Options Trading Strategies: From Simple to AdvancedPart 1: The Basics of Options
Before diving into strategies, let’s review the two core types of options:
1. Call Option (CE)
Gives the buyer the right (but not the obligation) to buy an underlying asset at a predetermined price (strike price) within a specific time period.
Bullish in nature.
2. Put Option (PE)
Gives the buyer the right (but not the obligation) to sell an underlying asset at a predetermined price within a specific time period.
Bearish in nature.
Each option has a premium (price you pay to buy the option), and that’s the maximum loss a buyer can face. Sellers (or writers), on the other hand, receive the premium but take on higher risk.
Part 2: Simple Options Strategies
These are basic strategies suitable for new traders.
1. Buying a Call Option (Long Call)
When to Use: If you expect the stock/index to rise significantly.
Risk: Limited to the premium paid.
Reward: Unlimited potential profit.
Example:
Stock XYZ is trading at ₹100. You buy a 105 Call Option at ₹2 premium.
If stock moves to ₹115:
Intrinsic Value = ₹10
Profit = ₹10 - ₹2 = ₹8 per share
Why It’s Good: Cheap entry, high upside.
2. Buying a Put Option (Long Put)
When to Use: If you expect the stock/index to fall.
Risk: Limited to the premium paid.
Reward: High if stock crashes.
Example:
You buy a 95 PE when stock is at ₹100, and premium is ₹3.
If stock falls to ₹85:
Intrinsic Value = ₹10
Profit = ₹10 - ₹3 = ₹7 per share
Why It’s Good: Good for bearish bets or portfolio hedging.
3. Covered Call
When to Use: You own the stock and expect neutral to moderately bullish movement.
Risk: Limited upside potential.
Reward: Premium + stock movement (if not called away).
Example:
You own 100 shares of XYZ @ ₹100.
You sell 110 CE for ₹5.
If stock rises to ₹110, you sell at that level and keep ₹5 premium.
If it stays below ₹110, you keep the shares + premium.
Why It’s Good: Generates income from stocks you hold.
4. Protective Put
When to Use: You own a stock and want downside protection.
Risk: Limited downside.
Reward: Unlimited upside.
Example:
Own 100 shares of XYZ @ ₹100.
Buy a 95 PE at ₹3.
If stock drops to ₹85, your put becomes worth ₹10, offsetting losses.
Why It’s Good: Acts like insurance on your holdings.
Part 3: Intermediate Strategies
Once you’re comfortable with buying/selling calls and puts, it’s time to explore neutral and range-bound strategies.
5. Bull Call Spread
When to Use: You expect a moderate rise in the stock/index.
Risk: Limited.
Reward: Limited.
Structure:
Buy 100 CE at ₹5
Sell 110 CE at ₹2
Net Cost: ₹3
Max Profit: ₹10 - ₹3 = ₹7
Max Loss: ₹3
Why It’s Good: Lower cost than buying a call outright.
Part 4: Risk Management Tips
Never deploy a strategy you don’t understand.
Use stop-loss and position sizing to avoid blowing up capital.
Be aware of Greeks (Delta, Theta, Vega) — they drive profits/losses.
Avoid naked options selling unless you have enough margin and experience.
Always review IV (Implied Volatility) before placing straddles or condors.
Understand expiry effects — options lose value faster as expiry nears.
Part 5: Real-Life Example
Let’s say Nifty is trading at 22,000. You expect no major movement till expiry. You execute an Iron Condor:
Sell 22100 CE at ₹100
Buy 22300 CE at ₹40
Sell 21900 PE at ₹90
Buy 21700 PE at ₹30
Net Credit = ₹100 - ₹40 + ₹90 - ₹30 = ₹120
Max Loss = Spread width (200) - Net Credit = ₹80
If Nifty stays between 21900 and 22100 — all options expire worthless and you earn full ₹120.
Conclusion
Options trading is like a chess game — it's not only about direction, but also timing, volatility, and strategy structure. Simple strategies like buying calls and puts are perfect for starters, but intermediate and advanced strategies allow you to profit in any kind of market — bullish, bearish, or neutral.
The key lies in choosing the right strategy for the right market condition, managing risks, and being patient.
Whether you're hedging your portfolio, generating income, or speculating on big market moves, options provide the tools — but it’s your responsibility to use them wisely.
If you’d like charts, payoff diagrams, or examples using live data (like Bank Nifty or stocks), let me know and I can include those too!
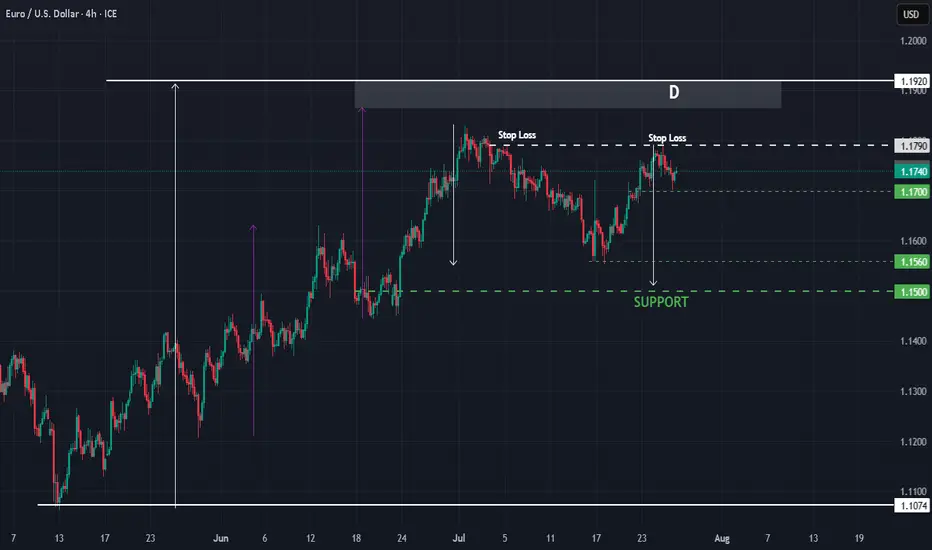
EURUSD : Status @ 25/7Direction: Sell
Signal triggered: 25/7/2025
Stop when:
a) Stop Loss @ 1.1790; or if
b) Buy signal triggered
Action:
Sell the rally
Good luck.
P/S: It seems that 1.1790 is a good resistance line as anticipated. The price may reach as low as 1.1500, which will serve as the next support level. Then we wait there for the next sell or maybe buy signal!
And a BIG congratulation to those who sold @ D - 1.1780 :-)
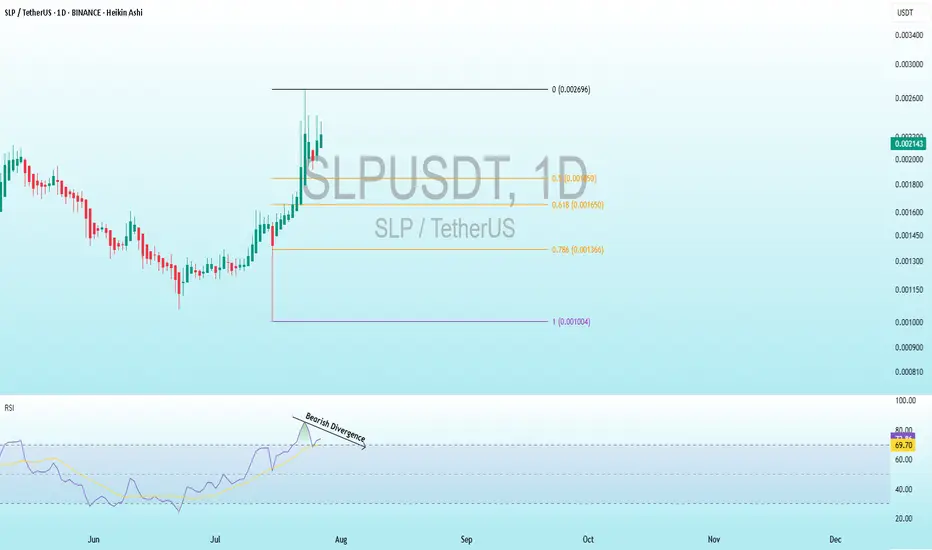
SLP Bearish DivergenceBINANCE:SLPUSDT
Support Levels: 0.001650 (recent low, first target for a drop).
0.001004 (deeper support, longer-term target).
Resistance: 0.002696 (recent high, potential stop loss level).
Trade Setup:
Target 1: 0.001650 (short-term, ~25% drop).
Target 2: 0.001004 (long-term, ~50% drop if bearish trend strengthens).
Stop Loss: 0.002696 (above recent high, ~25% above current price).
RSI Analysis: The RSI shows a bullish divergence (price making lower lows while RSI makes higher lows), suggesting potential upward momentum. Current RSI is around 69.70, nearing overbought territory (>70), so caution is advised.
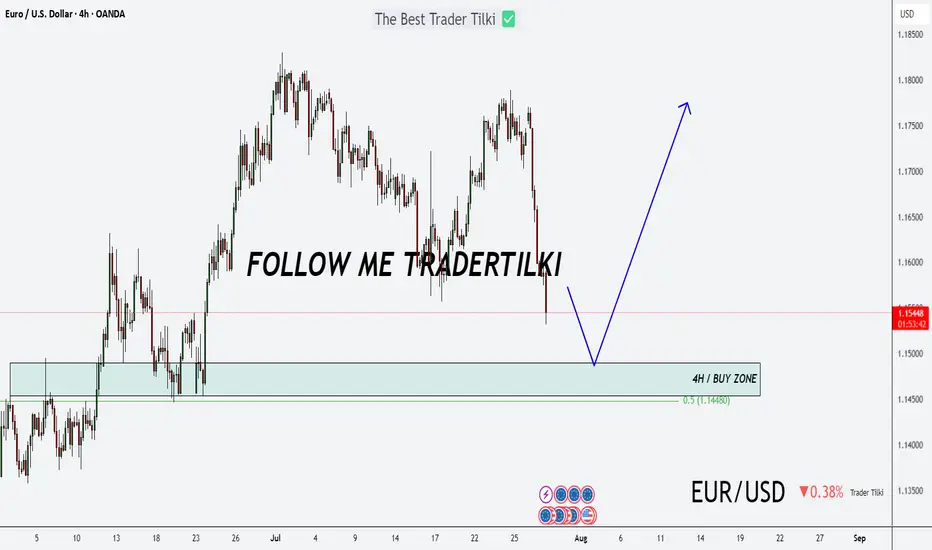
Major U.S. News Ahead—Will EURUSD Pivot?Good morning, my friends 👋
Here’s my EURUSD market analysis 📉
Currently, the pair is in a downtrend. I expect this downward move to end around 1.14899 or 1.14536, where a potential buying opportunity may emerge. I personally plan to enter a buy position once price reaches those zones 💼
Also, keep an eye on major U.S. economic reports being released today—they could trigger increased volatility 🔔
Every like you send is a huge source of motivation for me to keep sharing high-quality analysis 🙏 Thanks to everyone supporting the channel 💙
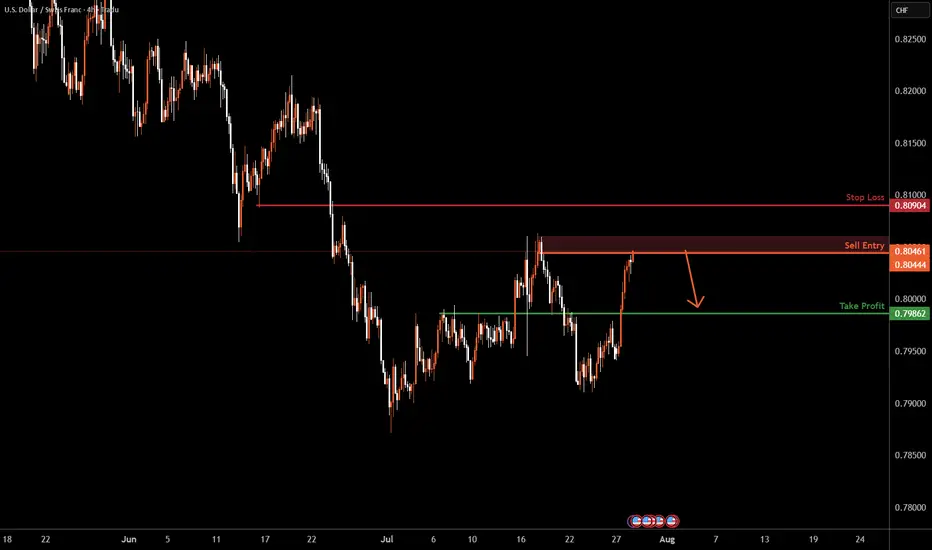
USDCHF SELL 0.8175On the 4-hour chart, USDCHF has stabilized and rebounded from its lows, forming a potential double bottom pattern in the short term. In the short term, USDCHF may continue to rise, with an upside target of around 0.8175, which is a potential short position for a bearish bat pattern and is within the previous supply zone.

USDCHF H4 I Bearish Drop Based on the H4 chart analysis, we can see that the price is entering our sell zone of 0.8404 - 0.8061.
Our take profit will be at 0.7986, a pullback support level.
The stop loss will be placed at 0.8090, a pullback resistance.
High Risk Investment Warning
Trading Forex/CFDs on margin carries a high level of risk and may not be suitable for all investors. Leverage can work against you.
Stratos Markets Limited (tradu.com ):
CFDs are complex instruments and come with a high risk of losing money rapidly due to leverage. 65% of retail investor accounts lose money when trading CFDs with this provider. You should consider whether you understand how CFDs work and whether you can afford to take the high risk of losing your money.
Stratos Europe Ltd (tradu.com ):
CFDs are complex instruments and come with a high risk of losing money rapidly due to leverage. 66% of retail investor accounts lose money when trading CFDs with this provider. You should consider whether you understand how CFDs work and whether you can afford to take the high risk of losing your money.
Stratos Global LLC (tradu.com ):
Losses can exceed deposits.
Please be advised that the information presented on TradingView is provided to Tradu (‘Company’, ‘we’) by a third-party provider (‘TFA Global Pte Ltd’). Please be reminded that you are solely responsible for the trading decisions on your account. There is a very high degree of risk involved in trading. Any information and/or content is intended entirely for research, educational and informational purposes only and does not constitute investment or consultation advice or investment strategy. The information is not tailored to the investment needs of any specific person and therefore does not involve a consideration of any of the investment objectives, financial situation or needs of any viewer that may receive it. Kindly also note that past performance is not a reliable indicator of future results. Actual results may differ materially from those anticipated in forward-looking or past performance statements. We assume no liability as to the accuracy or completeness of any of the information and/or content provided herein and the Company cannot be held responsible for any omission, mistake nor for any loss or damage including without limitation to any loss of profit which may arise from reliance on any information supplied by TFA Global Pte Ltd.
The speaker(s) is neither an employee, agent nor representative of Tradu and is therefore acting independently. The opinions given are their own, constitute general market commentary, and do not constitute the opinion or advice of Tradu or any form of personal or investment advice. Tradu neither endorses nor guarantees offerings of third-party speakers, nor is Tradu responsible for the content, veracity or opinions of third-party speakers, presenters or participants.
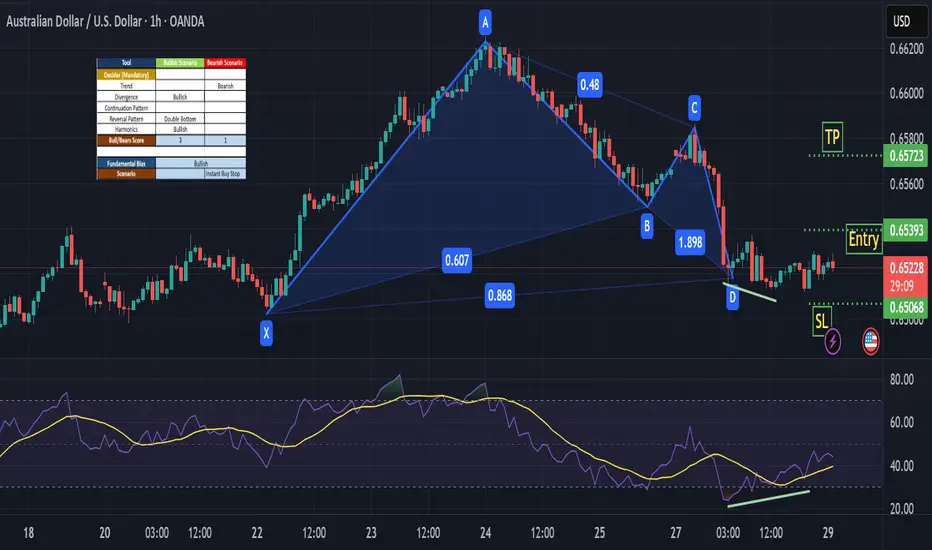
AUDUSD - BullishAUDUSD is Bullish on Fundamental Bias and Seasonal aslo support long position. Divergence can also be observed on RSI. Forming an Harmonic pattern so it looks like buyers are in a strong position
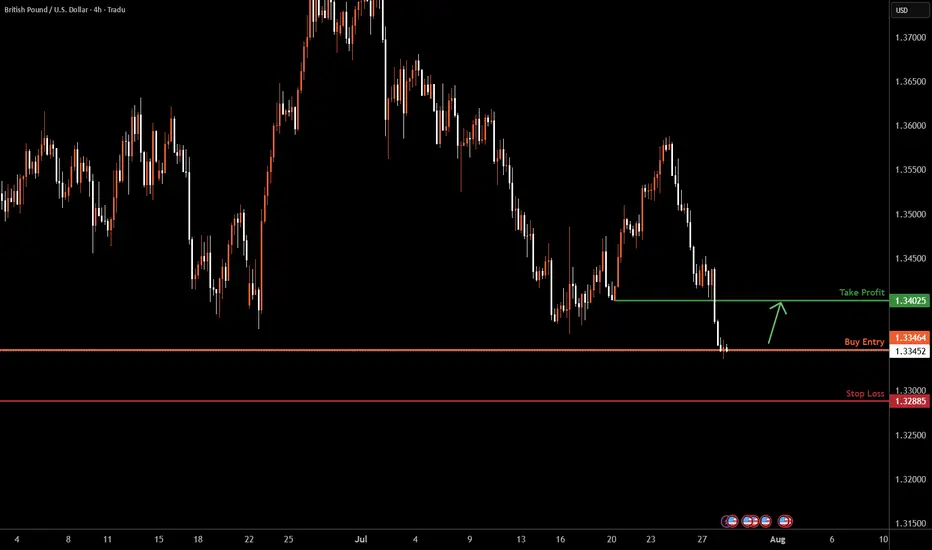
GBPUSD H4 I Bullish Rise toward the resistanceBased on the H4 chart analysis, we can see that the price is testing our buy entry at 1.3346, which is an overlap support.
Our take profit will be at 1.3402, which is a pullback resistance level.
The stop loss will be placed at 1.3288, a pullback support.
High Risk Investment Warning
Trading Forex/CFDs on margin carries a high level of risk and may not be suitable for all investors. Leverage can work against you.
Stratos Markets Limited (tradu.com ):
CFDs are complex instruments and come with a high risk of losing money rapidly due to leverage. 65% of retail investor accounts lose money when trading CFDs with this provider. You should consider whether you understand how CFDs work and whether you can afford to take the high risk of losing your money.
Stratos Europe Ltd (tradu.com ):
CFDs are complex instruments and come with a high risk of losing money rapidly due to leverage. 66% of retail investor accounts lose money when trading CFDs with this provider. You should consider whether you understand how CFDs work and whether you can afford to take the high risk of losing your money.
Stratos Global LLC (tradu.com ):
Losses can exceed deposits.
Please be advised that the information presented on TradingView is provided to Tradu (‘Company’, ‘we’) by a third-party provider (‘TFA Global Pte Ltd’). Please be reminded that you are solely responsible for the trading decisions on your account. There is a very high degree of risk involved in trading. Any information and/or content is intended entirely for research, educational and informational purposes only and does not constitute investment or consultation advice or investment strategy. The information is not tailored to the investment needs of any specific person and therefore does not involve a consideration of any of the investment objectives, financial situation or needs of any viewer that may receive it. Kindly also note that past performance is not a reliable indicator of future results. Actual results may differ materially from those anticipated in forward-looking or past performance statements. We assume no liability as to the accuracy or completeness of any of the information and/or content provided herein and the Company cannot be held responsible for any omission, mistake nor for any loss or damage including without limitation to any loss of profit which may arise from reliance on any information supplied by TFA Global Pte Ltd.
The speaker(s) is neither an employee, agent nor representative of Tradu and is therefore acting independently. The opinions given are their own, constitute general market commentary, and do not constitute the opinion or advice of Tradu or any form of personal or investment advice. Tradu neither endorses nor guarantees offerings of third-party speakers, nor is Tradu responsible for the content, veracity or opinions of third-party speakers, presenters or participants.
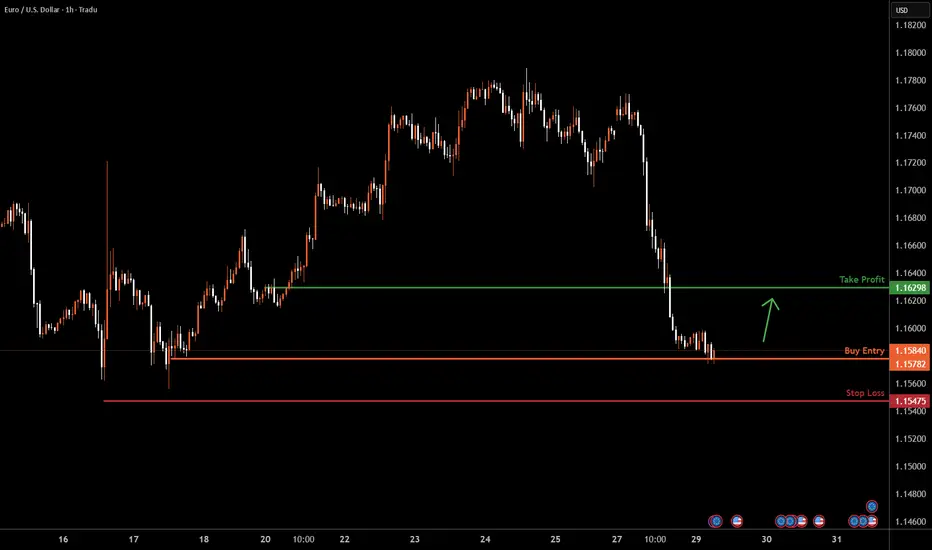
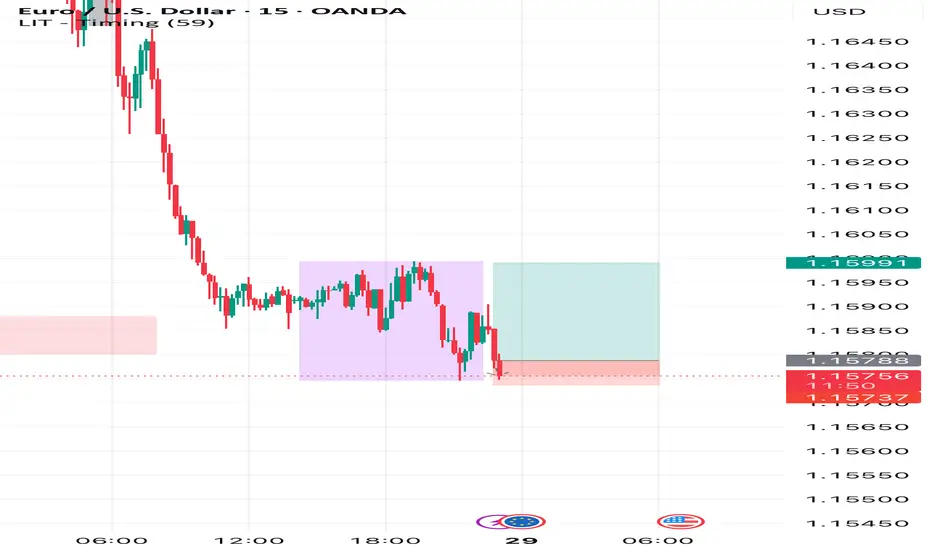
EURUSD H1 I Bullish Bounce Off Based on the H4 chart analysis, we can see that the price is testing our buy entry at 1.15782, which is a swing low support.
Our take profit will be at 1.1629, which is a pullback resistance level.
The stop loss will be placed at 1.1547, below the swing low support.
High Risk Investment Warning
Trading Forex/CFDs on margin carries a high level of risk and may not be suitable for all investors. Leverage can work against you.
Stratos Markets Limited (tradu.com ):
CFDs are complex instruments and come with a high risk of losing money rapidly due to leverage. 65% of retail investor accounts lose money when trading CFDs with this provider. You should consider whether you understand how CFDs work and whether you can afford to take the high risk of losing your money.
Stratos Europe Ltd (tradu.com ):
CFDs are complex instruments and come with a high risk of losing money rapidly due to leverage. 66% of retail investor accounts lose money when trading CFDs with this provider. You should consider whether you understand how CFDs work and whether you can afford to take the high risk of losing your money.
Stratos Global LLC (tradu.com ):
Losses can exceed deposits.
Please be advised that the information presented on TradingView is provided to Tradu (‘Company’, ‘we’) by a third-party provider (‘TFA Global Pte Ltd’). Please be reminded that you are solely responsible for the trading decisions on your account. There is a very high degree of risk involved in trading. Any information and/or content is intended entirely for research, educational and informational purposes only and does not constitute investment or consultation advice or investment strategy. The information is not tailored to the investment needs of any specific person and therefore does not involve a consideration of any of the investment objectives, financial situation or needs of any viewer that may receive it. Kindly also note that past performance is not a reliable indicator of future results. Actual results may differ materially from those anticipated in forward-looking or past performance statements. We assume no liability as to the accuracy or completeness of any of the information and/or content provided herein and the Company cannot be held responsible for any omission, mistake nor for any loss or damage including without limitation to any loss of profit which may arise from reliance on any information supplied by TFA Global Pte Ltd.
The speaker(s) is neither an employee, agent nor representative of Tradu and is therefore acting independently. The opinions given are their own, constitute general market commentary, and do not constitute the opinion or advice of Tradu or any form of personal or investment advice. Tradu neither endorses nor guarantees offerings of third-party speakers, nor is Tradu responsible for the content, veracity or opinions of third-party speakers, presenters or participants.
29.07.25 Morning ForecastPairs on Watch -
FX:EURGBP
FX:AUDUSD
FX:NZDUSD
A short overview of the instruments I am looking at for today, multi-timeframe analysis down to what I will be looking at for an entry. Enjoy!

EURUSD BuyPrice did a ‘LG’ off the ‘POI’(looking left). Daily cycle not fully complete. Price should take out asia high.
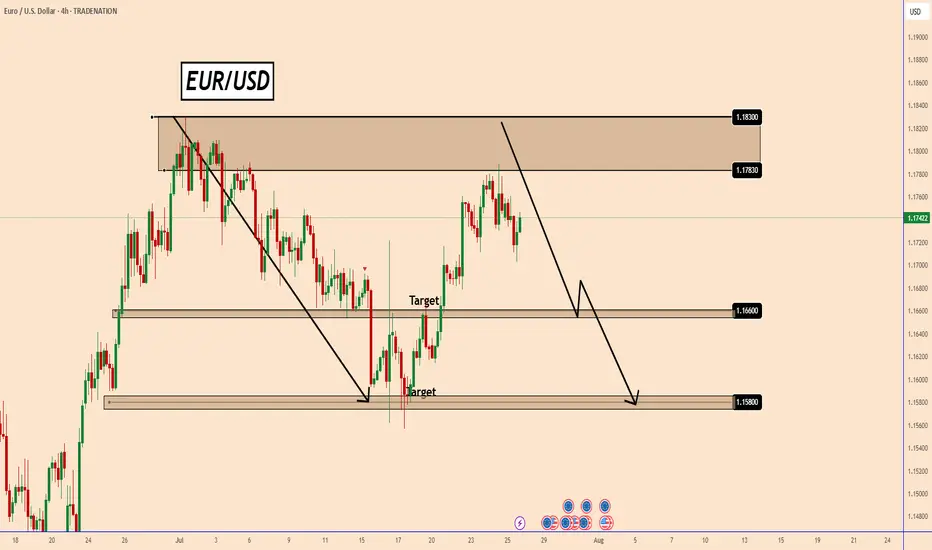
EURUSD may fall, but it's all about the FOMC DecisionEURUSD may fall, but it's all about the FOMC Decision
During the first 2 weeks of July, EURUSD fell from 1.18000 to 1.1550 and then the price rose again due to renewed tariffs.
Trump's comments regarding Powell and tariffs, according to which the EU and the US may reach an agreement soon, renewed the strength of EURUSD.
However, this time it is more related to the FOMC. If the FED cuts rates, EURUSD can drop further. When they didn't cut rates, the USD was weak or didn't move at all.
Let's see.
If Powell makes any surprises this time, EURUSD could fall, as shown in the chart, from 1.1800 to 1.1550, which is almost 250 pips lower.
Key support zones: 1.1660 and 1.1580
You may find more details in the chart!
Thank you and Good Luck!
PS: Please support with a like or comment if you find this analysis useful for your trading day
Disclosure: I am part of Trade Nation's Influencer program and receive a monthly fee for using their TradingView charts in my analysis.
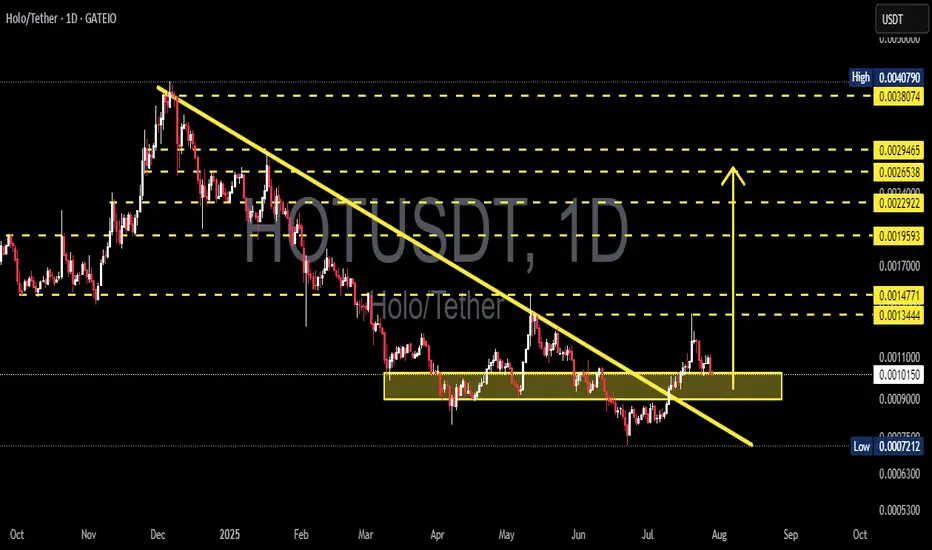
HOT/USDT Breakout Confirmation or Bull Trap? Critical Retest!🧠 In-Depth Technical Breakdown (Daily Timeframe):
HOT/USDT (Holo vs Tether) is currently at a crucial inflection point, following a confirmed breakout from a long-standing downtrend. The price is now retesting a major demand zone, and how it reacts here will determine its next big move.
Let’s dive deeper into the technical structure, chart patterns, and the possible bullish and bearish scenarios:
---
🔻 1. Trend Structure & Major Breakout
Since peaking in late December 2024, HOT/USDT was trapped in a descending trendline (yellow diagonal line).
In mid-July 2025, price successfully broke above this downtrend, signaling a potential trend reversal.
This breakout suggests a shift in market sentiment from bearish to neutral-to-bullish.
---
🟨 2. Retesting the Key Demand Zone (Support Flip)
Price is currently testing a critical demand/support zone between 0.00090 – 0.00110 USDT (highlighted in the yellow box).
This area served as a major consolidation base in the past and is now being tested as support after the breakout.
A successful retest will validate the breakout and could spark a continuation to the upside.
---
📐 3. Chart Pattern: Falling Wedge Breakout
Price action clearly formed a Falling Wedge pattern, typically a bullish reversal setup.
The breakout from the wedge confirms bullish momentum and the potential start of a new trend.
---
🔮 4. Price Scenarios Moving Forward
✅ Bullish Scenario:
If the price holds above the 0.00090–0.00100 zone:
1. Potential upside targets:
TP1: 0.00134 (minor resistance)
TP2: 0.00147 (key structural level)
TP3: 0.00159 (breakout continuation zone)
TP4: 0.00229 – 0.00246 (historical range highs)
TP5: 0.00380 – 0.00407 (major highs from previous cycle)
2. This structure could mark the beginning of a higher low + higher high uptrend, if confirmed.
❌ Bearish Scenario:
If the price breaks below 0.00090 with strong volume:
1. Likely a return to previous support at:
0.00072 USDT (historical low and major support level).
2. This would invalidate the breakout and possibly confirm a bull trap, resuming the downtrend.
---
🧩 Other Key Technical Notes (Not Shown in Chart but Useful):
Volume: Look for high volume on the breakout and retest to confirm validity.
RSI/Divergence: Check for hidden or bullish divergence on the last swing low.
EMA 50/200: If price crosses or holds above these EMAs, it adds further confirmation of trend reversal.
---
📊 Summary & Trading Strategy:
HOT/USDT is in a critical phase of retesting a major breakout, offering traders a great opportunity to either buy the dip or wait for confirmation.
Suggested Strategy:
Conservative Entry: Wait for a bullish candle close above 0.00100 with strong rejection from the support zone.
Aggressive Entry: Buy near 0.00090–0.00100 with a tight stop loss below 0.00087.
Use resistance levels for scaling out profits or setting targets.
#HOTUSDT #HoloToken #AltcoinAnalysis #CryptoBreakout #TechnicalAnalysis #ChartPattern #BullishReversal #FallingWedge #SupportZone #CryptoTA