NEIROUSDT: Critical Support Zone – Rebound or Breakdown Ahead?🔍 Price Structure & Pattern Formation
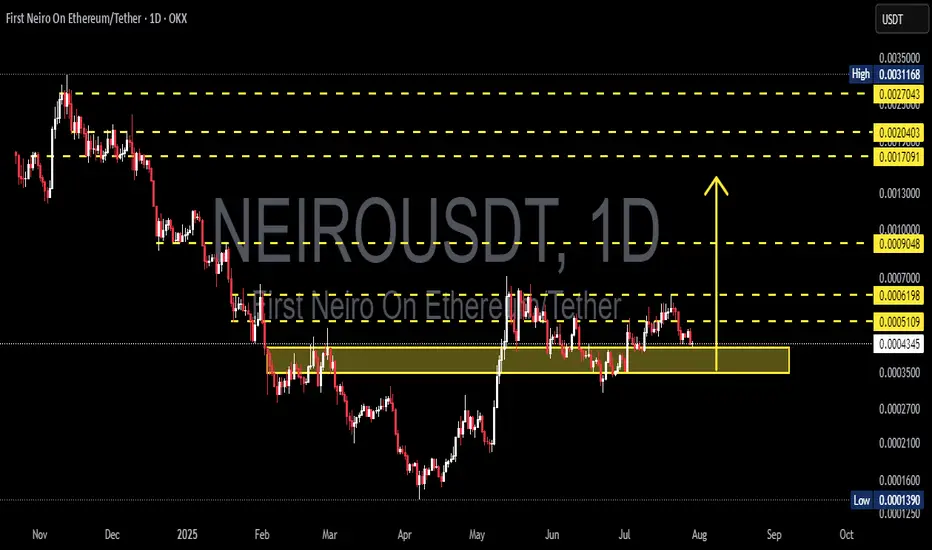
On the daily chart, NEIROUSDT is currently testing a major demand zone (highlighted in yellow) between 0.0004337 – 0.0003500 USDT. This area previously acted as a strong accumulation zone back in May and is now being retested as key support.
Price has entered a consolidation range after a short-term rally from April to May 2025.
Strong Support: 0.0004337 – 0.0003500
Nearest Resistance Levels: 0.0005109, 0.0006198
---
📈 Bullish Scenario
If the price holds above the demand zone and forms a valid bullish reversal pattern (e.g., bullish engulfing, pin bar), then a bullish move could follow.
Upside Targets (Resistance Levels):
1. 0.0005109
2. 0.0006198
3. 0.0009048
4. 0.0017091 (extended target)
5. 0.0020403
6. 0.0027043 (mid/long-term target)
Bullish Confirmation:
Daily close above 0.0006198
Increasing volume on bounce
Bullish candlestick formation in demand zone
---
📉 Bearish Scenario
If the price breaks below 0.0004337 and closes the day under it, it would indicate further downside potential.
Downside Targets (Support Levels):
1. 0.0003500 (bottom of demand zone)
2. 0.0002700
3. 0.0001600
4. 0.0001390 (previous major low)
Bearish Confirmation:
Strong daily close below 0.0004337
Retest of the zone fails as resistance
Bearish volume spikes
---
📐 Price Patterns
Potential Double Bottom: A bounce from this zone may form a double bottom pattern, with the neckline near 0.0006198.
Sideways Range / Accumulation: Price action since June indicates potential accumulation if the support holds.
---
🔑 Conclusion
NEIROUSDT is at a critical juncture — waiting for confirmation whether it will bounce from this strong demand zone or break down to continue the bearish trend. Key resistance and support levels are well-defined, providing clear strategies for breakout or rebound traders.
---
📌 Trading Suggestions
Aggressive Longs: Look for bullish signals inside the demand zone (0.00043 – 0.00035)
Conservative Longs: Wait for a breakout above 0.0006198 for trend reversal confirmation
Shorts: Enter if there's a confirmed breakdown below 0.0004337
#NEIROUSDT #CryptoAnalysis #TradingView #AltcoinWatch #SupportResistance #TechnicalAnalysis #BullishSetup #BearishScenario #CryptoTA #ChartUpdate #PriceAction
Harmonic Patterns
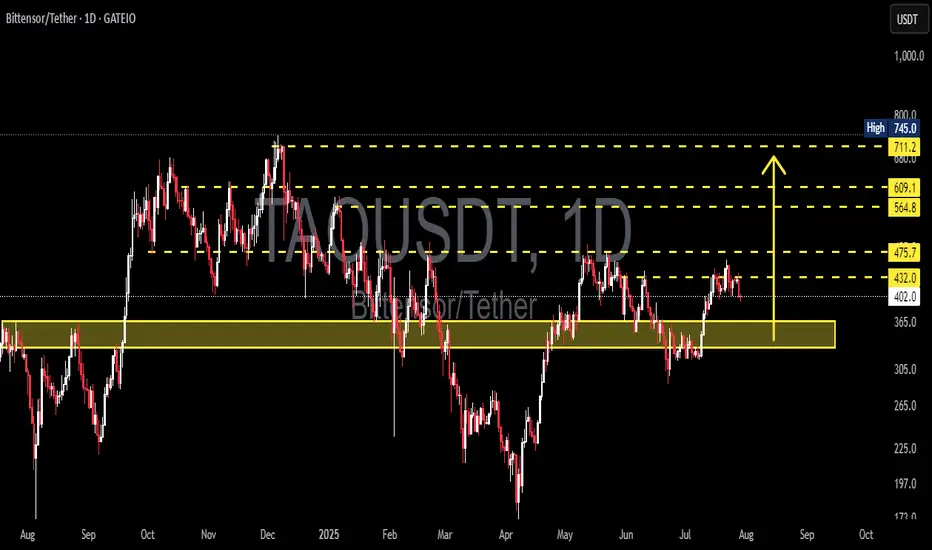
TAO/USDT: Price Likely to Retest Key Support Block 330–365 USDT?🟨 Key Zone: Yellow Support Block (330 – 365 USDT)
This zone has served as a major demand area since May 2025, acting as the base for the recent bullish move toward 475 USDT.
It represents a strong accumulation zone, where significant buying interest previously stepped in.
Given the current rejection from the 475 resistance, price is likely to revisit this block to test buyer interest and liquidity.
---
📉 Bearish Scenario: Breakdown Risk
After failing to break above 475.7 USDT, price shows signs of a short-term correction.
If bearish momentum continues:
🔽 A retest of the yellow support zone (330–365 USDT) is highly probable.
If this zone fails to hold:
📉 Next downside targets:
305 USDT – previous local low
265 USDT – next major demand level
A breakdown of the yellow block would invalidate the current bullish structure and open a new bearish leg.
---
📈 Bullish Scenario: Successful Retest and Bounce
If the price retests the yellow zone and forms a strong bullish reaction:
Confirmation signals:
Bullish reversal candles (hammer, bullish engulfing, etc.)
Increasing volume near the support zone
A successful retest could lead to:
✅ Continuation of the bullish trend
✅ Higher-low structure remains intact
Upside targets:
432 USDT – minor resistance
475.7 USDT – strong resistance zone
564.8, 609.1, and up to 711–745 USDT – extended targets
---
📌 Key Technical Levels:
Level Significance
330–365 USDT 🔲 Yellow Support Block / Demand Zone
432 USDT Minor Resistance / Previous Breakout
475.7 USDT Major Resistance (Recent Rejection)
564.8 USDT Mid-Term Resistance
609.1 USDT Next Key Resistance
711–745 USDT Long-Term Target / Supply Zone
305 USDT Support if Breakdown Happens
265 USDT Next Demand Zone Below
---
📊 Structure & Market Behavior:
No clear classic pattern (e.g., H&S or double bottom), but:
Current price is moving within a range-bound structure
Holding the 330–365 block would form a new higher low, strengthening the bullish outlook
Market is watching how price responds on retest of the yellow support
---
🧠 Notes for Traders:
Watch for volume and candle structure as price enters the 330–365 zone
This zone is a classic re-entry / reload area for institutional buyers
Conservative entry: Wait for bullish confirmation candle above 365
Aggressive entry: Ladder buys inside 330–365 with stop loss below 330
---
🏁 Conclusion:
TAO/USDT is undergoing a healthy pullback after rejection at 475.7 USDT. A retest of the yellow support zone (330–365 USDT) is highly likely. This area is crucial for the next move — either a bullish continuation with a strong bounce or a bearish breakdown signaling trend reversal.
#TAOUSDT #TAO #CryptoAnalysis #RetestSupport #DemandZone #BullishScenario #BearishScenario #AltcoinWatch #TechnicalAnalysis #PriceAction #TradingView #SupportAndResistance #GateIO #ReentryZone
RECTANGLE CHANNELHello awesome traders! 👋
Hope you’ve managed to grab some solid pips from the markets this week. As we head into the weekend, I’m wrapping things up by dropping a few clean chart setups for you to review and reflect on.
Enjoy the weekend, recharge well — and I’ll see you sharp and ready next week for more structure-led opportunities.
📌 Pattern Breakdown
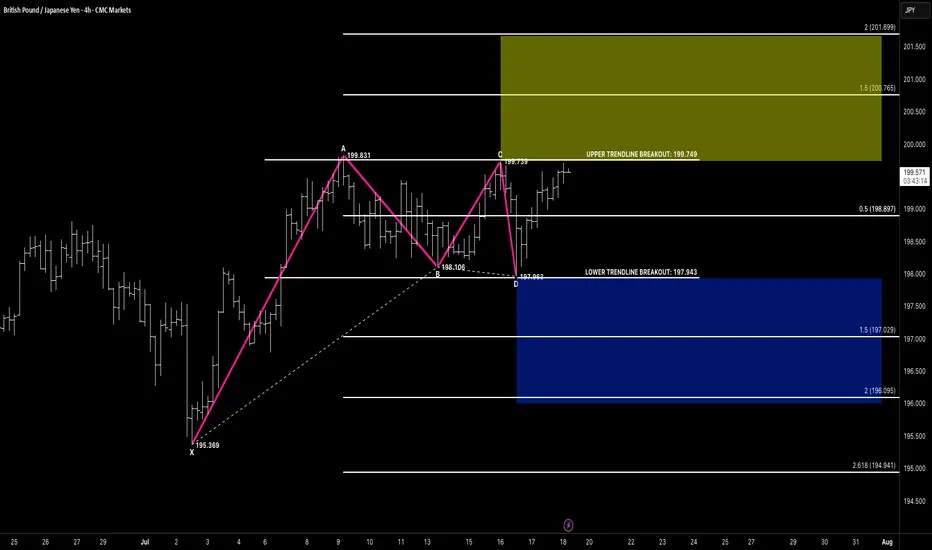
We’ve been tracking a developing rectangle channel between 197.94 (support) and 199.74 (resistance):
🔹 Price formed a clear 4-leg compression
🔹 CD leg bounced off lower support near 197.96
🔹 We’re now approaching the upper edge of the channel at 199.74
🔹 Compression structure suggests breakout potential is building
🚨 Breakout Setup in Focus
🔸 A breakout above 199.75 opens the door toward:
✅ Target 1 Zone:
• 1.5 extension = 200.76
✅ Target 2 Zone:
• 2.0 extension = 201.69
📌 Flip-side: A failed breakout and close back below 197.94 would shift structure toward:
🔻 Bearish Breakdown Targets:
• 1.5 = 197.02
• 2.0 = 196.09
• 2.618 = 194.94
We stay flexible — trade the breakout, not the anticipation.
🧠 Key Concepts in Play
✅ Rectangle consolidation
✅ Breakout-ready structure
✅ Defined upper/lower breakout levels
✅ Volume and reaction at edges = trigger
🗝 Final Thoughts
GBPJPY is boxed in tight — but momentum is clearly leaning bullish.
If we get that clean break above 199.75 with confirmation (volume, close, continuation), the 200.76+ range is firmly in sight. No breakout? No problem — structure has a plan either way.
“Boxes don’t trap the market — they build the tension. Breakouts reward the patient.”
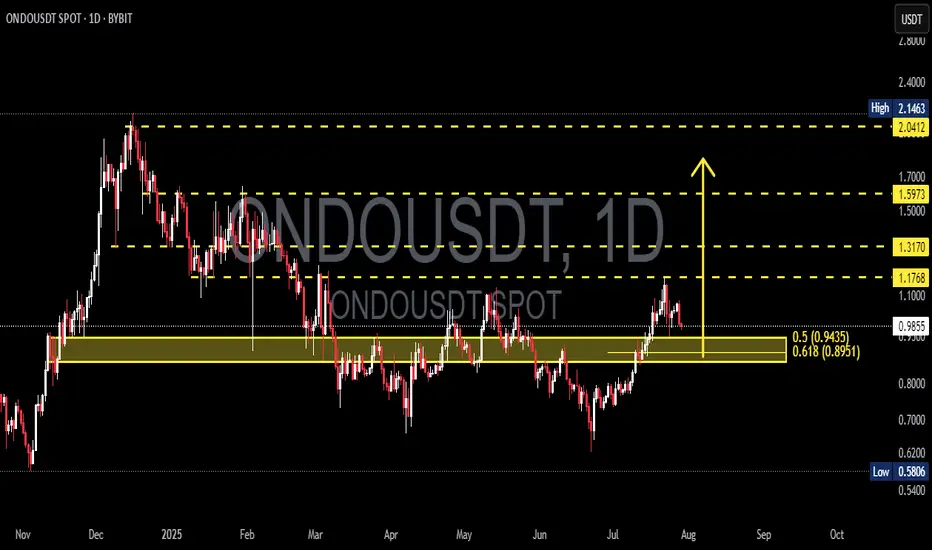
ONDOUSDT at a Critical Fibonacci Zone! Will Move Toward $2+?ONDOUSDT is currently trading at a critical technical zone — the Fibonacci Retracement Golden Pocket (0.5–0.618) — following a significant upward rally. Historically, this zone often acts as a high-probability reversal area, or at the very least, a zone for major consolidation before the next big move.
---
🧠 Market Structure & Price Action
After reaching a local high near $1.17, price retraced and is now approaching the key support zone between $0.9435 (Fib 0.5) and $0.8951 (Fib 0.618).
This zone also coincides with a previous strong resistance, which could now act as new support (role reversal).
Current price action shows selling pressure, but there is no confirmed breakdown from the Golden Pocket yet.
---
🧩 Pattern Recognition & Key Levels
Potential Reversal Pattern: Look for a bullish falling wedge or descending channel on lower timeframes as a signal for reversal.
Demand Zone (Yellow Box): The zone between $0.8951–$0.9435 is reinforced by horizontal price structure support.
Layered Resistance Levels:
$1.1768 → Recent swing high
$1.3170 → Mid-range resistance
$1.5973 → Psychological and retracement target
$2.0412 → Range top / full recovery zone
Minor Support: If the Golden Pocket fails, potential downside targets include $0.70 and the major low at $0.5806.
---
📈 Bullish Scenario
✅ Strong bounce from the Golden Pocket
✅ Bullish candlestick confirmation (e.g., bullish engulfing or pin bar)
✅ Rising volume showing buyer presence
✅ Break above $1.1768 would signal continuation toward:
🎯 Target 1: $1.3170
🎯 Target 2: $1.5973
🎯 Target 3: $2.0412 (full structural recovery)
---
📉 Bearish Scenario
❌ If price breaks below $0.8951 with a strong bearish candle and high volume:
The structure shifts bearish, increasing risk of a drop to $0.70 – $0.62
Worst-case scenario: retest of $0.5806, the major bottom
Bullish structure invalidated upon confirmed breakdown
---
🎯 Strategy & Takeaway
ONDOUSDT is currently in a "make or break" zone. The Golden Pocket between $0.895–$0.943 could either:
Act as a springboard for the next bullish leg,
Or fail, triggering a deeper correction.
Traders should wait for confirmation via:
Candlestick patterns
Volume breakout/inflow
Break above or below the key structure
This area offers a high-reward, controlled-risk setup for swing traders, with invalidation just below the Golden Pocket.
---
📌 Summary of Key Levels
Level Description
$0.9435 Fibonacci 0.5 (support)
$0.8951 Fibonacci 0.618 (Golden Pocket)
$1.1768 Minor resistance
$1.3170 Mid-level resistance
$1.5973 Bullish target
$2.0412 Major resistance / recovery top
$0.5806 Extreme support (macro low)
#ONDOUSDT #CryptoTechnicalAnalysis #GoldenPocket #FibonacciLevels #CryptoTrading #SupportResistance #BullishSetup #BearishScenario #SwingTrade #AltcoinAnalysis
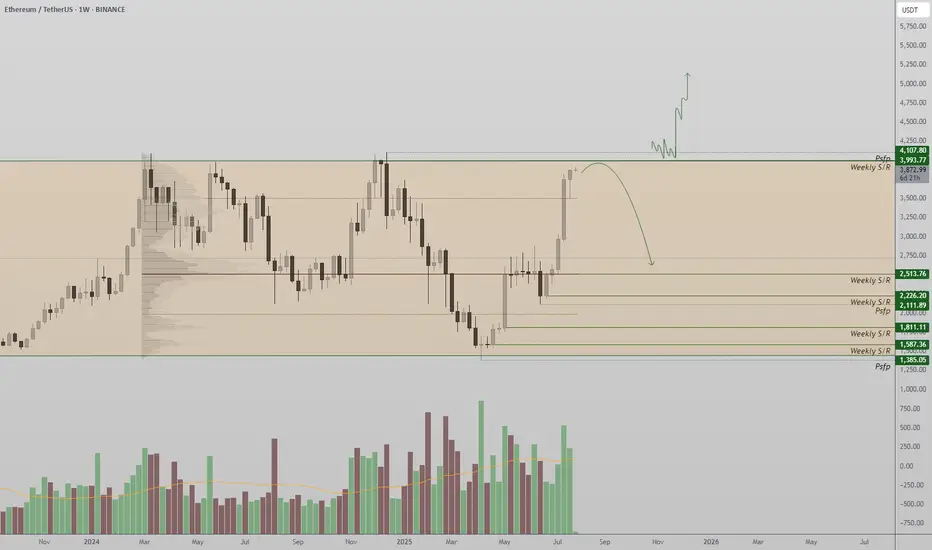
Ethereum at a Critical Crossroad: Will $4,000 Finally Break ?Ethereum is once again approaching the psychologically significant $4,000 resistance level, a high-timeframe barrier that has rejected price on multiple occasions. As the second-largest cryptocurrency by market cap pushes higher, traders are closely watching for signs of a breakout—or another range-bound rejection.
Ethereum has entered a decisive phase, with price action now testing the upper boundary of a long-standing trading range. After multiple failed attempts to breach the $4,000 mark, ETH is consolidating just below this level, creating an environment filled with both opportunity and risk. Whether Ethereum can break through or gets rejected again will shape its mid- to long-term outlook.
Key Technical Points:
- Major Resistance at $4,000: A psychologically important level and long-time price cap on high timeframes
- Defined Trading Range: ETH has remained range-bound between $1,300 and $4,000 for an extended period
- Critical Candle Closes Needed: Breakout requires strong daily or weekly closes above $4,000 to confirm
Ethereum’s price is hovering just under the $4,000 resistance zone, which has acted as a ceiling for price action since early 2022. From a high time frame perspective, ETH has been range-bound, trading between $1,300 as the range low and $4,000 as the range high. Each visit to this upper boundary has led to a rejection and a subsequent rotation back toward mid-range or lower levels.
Now, with momentum building and bullish sentiment returning across the crypto market, Ethereum finds itself at another pivotal moment. The key technical requirement for a confirmed breakout will be a decisive daily or weekly close above the $4,000 level. Without this confirmation, any temporary push above the resistance could result in a fakeout and trap late long entries.
Volume behavior around this zone remains mixed. While there is some bullish buildup in recent sessions, there has not yet been a significant influx in volume to confirm conviction from buyers. This aligns with the historical pattern of Ethereum trading at resistance before eventually pulling back, suggesting caution is still warranted.
However, should ETH close decisively above $4,000 and turn this level into support, it would mark the first major break of this range since its inception. This would likely trigger a wave of bullish momentum, possibly sending Ethereum to new yearly highs, with $4,500–$5,000 being the next logical resistance zones based on historical price pivots and Fibonacci extensions.
What to Expect in the Coming Price Action
Ethereum’s price action is currently neutral-bullish but hinges entirely on its interaction with the $4,000 resistance. A confirmed breakout could usher in a powerful rally toward new highs, while another rejection would likely continue the long-standing range between $1,300 and $4,000. Until a decisive move occurs, traders should remain cautious and reactive rather than overly anticipatory.
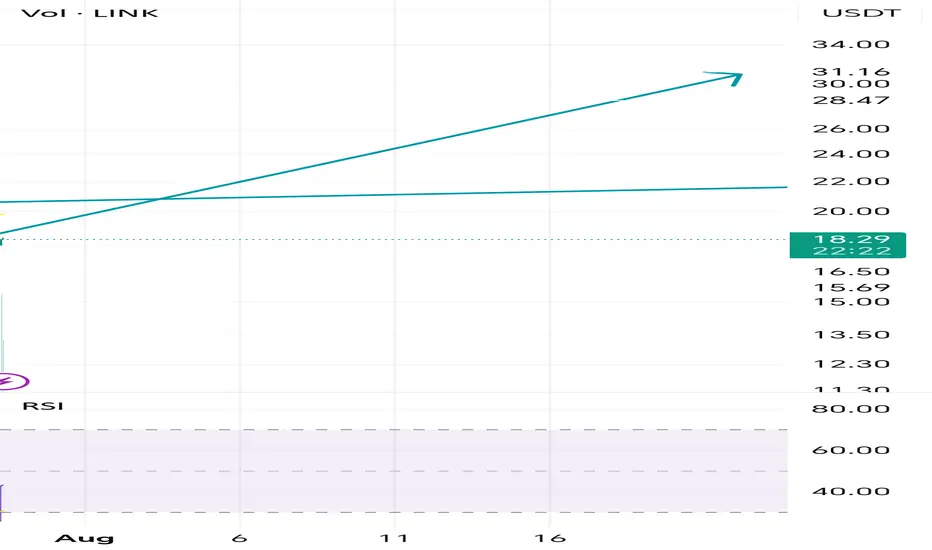
LinkOn the higher TF Link is breaking out from its structure, my first target is 21.5
2nd target 28
3rd 30
Good luck
MY idea
Gold: This Week's Analysis & StrategyThis week, the fluctuations have clearly moderated📉. Focus on a strategy of buying at lows and selling at highs as much as possible📈. Currently, the resistance around 3350 is prominent🚧, and 3300 acts as support below🛡️. If the decline continues, it may reach around 3285👇
We successfully took short positions last week 📉, and this week I recommend going long at lower levels 📈. Over the long term, gold remains in a bull market 🐂, but it will not repeat the frenzy seen in April; instead, it will maintain a steady upward pace ⬆️.
Market expectations for Fed rate cuts have been volatile so far this year 📊. At the start of the year, as Trump-related developments unfolded, market optimism faded 😐. Meanwhile, the de-dollarization trend fueled growing expectations of Fed rate cuts 💹. By early April, Trump’s reciprocal tariff measures—far more aggressive than expected—roiled global financial markets 🌍, triggering a surge in concerns about a U.S. recession ⚠️. Markets thus anticipated that the Fed would cut rates quickly to shore up the economy, with expectations for rate cuts within the year once exceeding 100 basis points 📉. However, shortly after, Trump announced a 90-day extension of the reciprocal tariffs, easing market pessimism 😌 and driving a strong rebound in U.S. stocks 📈. At this point, markets began worrying that his tariff policies could spark an inflation rebound 🔥, leading to a steady decline in rate cut expectations—currently, expectations for rate cuts this year have dropped to fewer than two 🔄.
Risk Warning ⚠️
Event Sensitivity: Outcomes of China-U.S. trade talks 🤝, the Fed’s statements , and nonfarm payroll data 📊 may trigger one-sided volatility. Positions should be adjusted promptly to avoid risks 🛡️
⚡️⚡️⚡️ XAUUSD ⚡️⚡️⚡️
🚀 Buy@ 3300 -3310
🚀 TP 3320 - 3330 - 3340
🚀 Sell@ 3350 -3340
🚀 TP 3330 - 3320 - 3310
Daily updates bring you precise trading signals 📊 When you hit a snag in trading, these signals stand as your trustworthy compass 🧭 Don’t hesitate to take a look—sincerely hoping they’ll be a huge help to you 🌟 👇
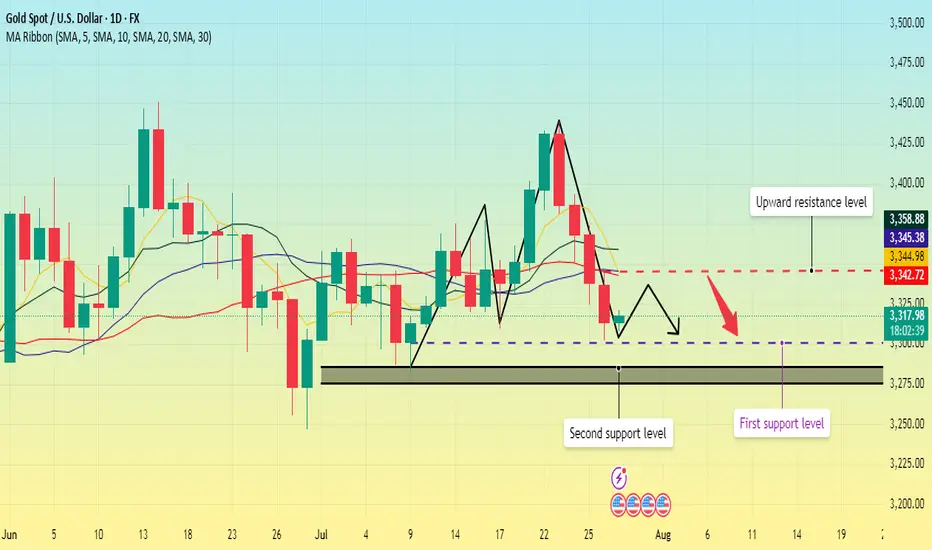
Gold repeatedly tested lows. Will it break through?On Monday, the Asian market opened low and rose in the early trading. In the European trading, it rose to around 3345. The European trading was under pressure and fluctuated. The US trading began to accelerate its decline, and the lowest point reached around 3302. Then it continued to fluctuate in the range of 3300-3320.
On July 27, the United States and the European Union reached a framework trade agreement; the agreement reduced market concerns about the global economic recession, promoted the attractiveness of risky assets, and boosted the stock market and the US dollar. Although Trump has repeatedly pressured for a substantial interest rate cut, the market has strong expectations for a September interest rate cut. The current expectation of maintaining a stable interest rate dominates the market, coupled with the strength of the US dollar, which puts gold prices under downward pressure in the short term.
Gold opened low in the early trading on Monday and then rebounded to recover the losses, but then fell below the low again, and the daily line closed in the negative, and now it has formed a four-day negative decline. MA5 and 10-day moving averages form a dead cross, and there is a downward turn.
The focus on the upper side is around Monday's high of 3345, which is also near the current position of MA5, 20, and 30-day moving averages. Below this position, gold is weak; if it breaks upward, it is necessary to prevent the possibility of a rebound correction.
The lower support first focuses on the 3300 integer mark; secondly, focus on the area around 3285-3275.
Operation strategy:
Short near 3340, stop loss 3350, profit range 3320-3300;
Long near 3300, stop loss 3290, profit range 3320-3340.
Before the release of US data on Tuesday, you can maintain this operation strategy; after the data is released, adjust the strategy based on the impact of the data.
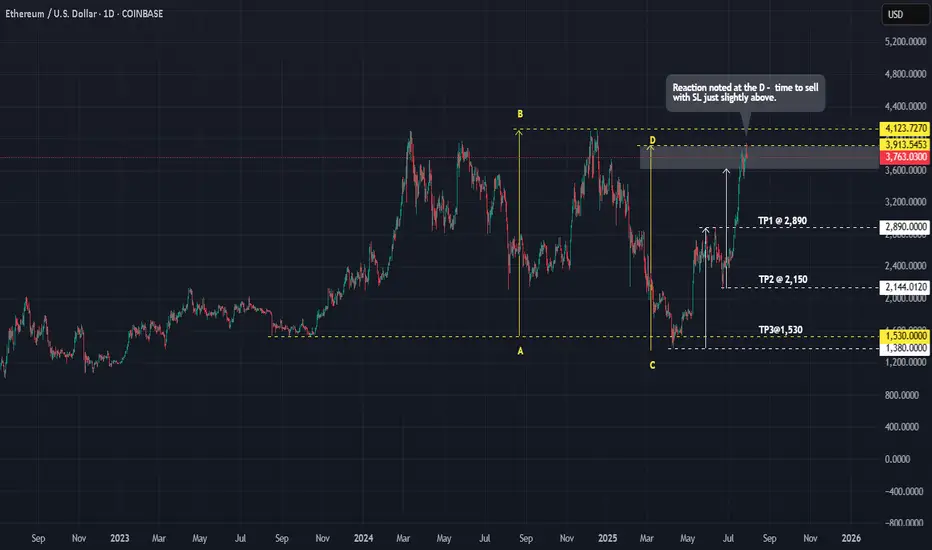
ETHUSD : Playing with the DThe good thing about a harmonic pattern is that it significantly lowers your risk. It forces you to be patient and wait.
It can be applied to all, whether FX, stocks, crypto, etc.
Why does it work better compared to others? The answer is simple - PRICE ONLY MOVES UP AND DOWN, PRICE DOES NOT MOVE SIDEWAYS.
One crucial thing we can see from the above is that the D < B. Which means if we are patient enough and wait for the appropriate time to SELL, the probability is very good to make money.
Good luck.
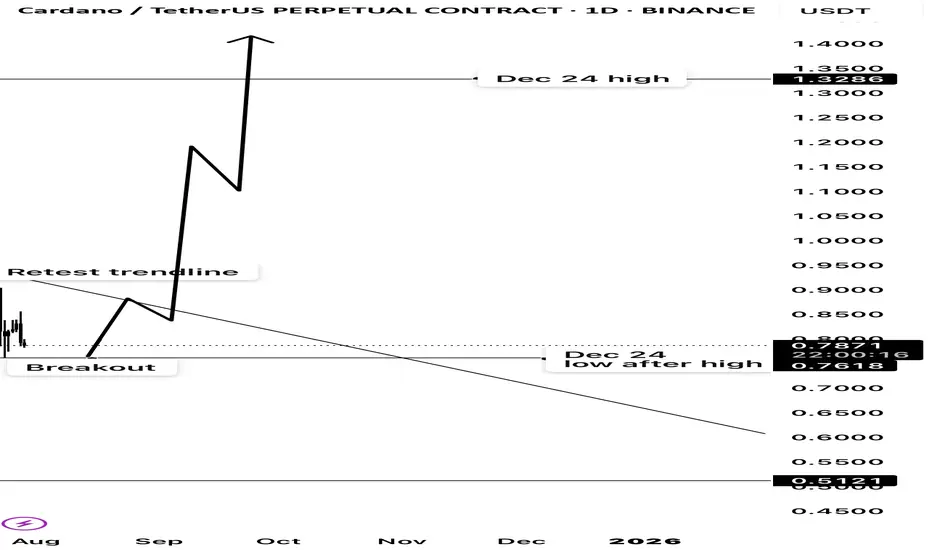
Cardano potential multi month breakout ?From december’s high cardano has been in a downtrend since.
The first low it made after the top from december had been a massive resistance.
It has risen from its 2025 lows and broke that resistance from all the way of december and retested its downtrend.
My take is, once it breaks that trendline it will go higher than the top of dec 2024.
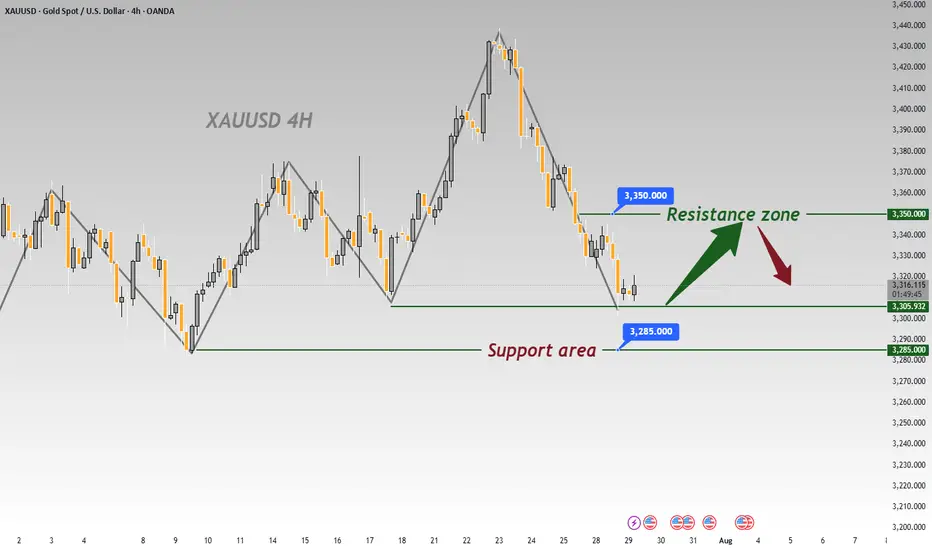
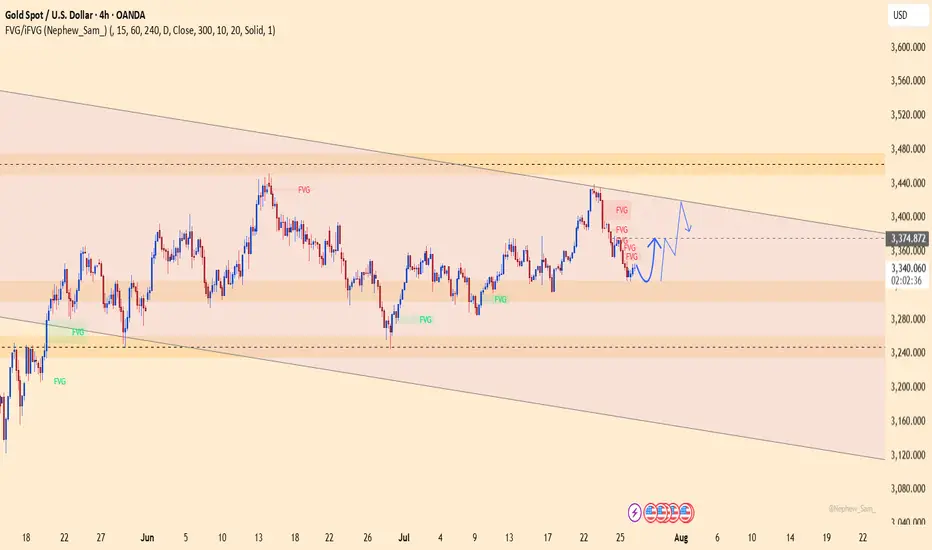
XAUUSD – Technical rebound, but downside risks remainOn the H4 chart, gold is bouncing slightly from the 3,323 support zone after a sharp drop. However, price remains within a large descending channel and is approaching a dense cluster of bearish FVGs around 3,360–3,374.
News context:
– US GDP and ADP data beat expectations, boosting the USD and adding pressure on gold.
– JOLTS dipped but remains above 7 million → limited support for gold.
– Thailand–Cambodia conflict provides only short-term impact.
Strategy: Favor SELL if price retests 3,360–3,374 and gets rejected. Downside targets: 3,323 or lower.
Main trend remains bearish, unless gold breaks above the descending channel.
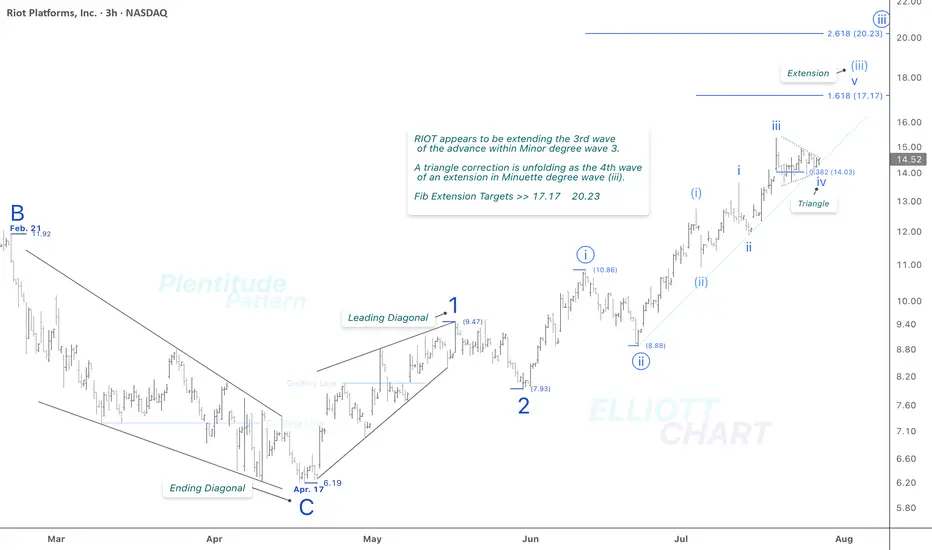
RIOT / 3hThere is no specific change in NASDAQ:RIOT 's previous analysis. As depicted on the 3h frame above, it appears to be extending the third wave of an impulsive advance within Minor degree wave 3. As anticipated, a triangle correction has emerged as the fourth wave within the ongoing extension of the Minuette wave (iii).
The Fibonacci extension levels of 17.17 and 20.23 remain valid and continue to align with the current wave structure.
>>> In this timeframe, I'm analyzing the initial rising tide within the ongoing Intermediate degree wave (1), where a nested series of waves have quite well revealed: 1, 2 → i (circled), ii (circled) → (i), (ii) → i, ii. The extreme high of this impulsive sequence lies beyond the visible range of the current chart.
NASDAQ:RIOT CRYPTOCAP:BTC BITSTAMP:BTCUSD MARKETSCOM:BITCOIN
#CryptoStocks #RIOT #BTCMining #Bitcoin #BTC
ETOR: Buying entry zoneETOR: Buying entry zone
.
Less supply volume at the bottom, successful shakeout and backtest.
Wait for a next move up ahead!
.
US STOCKS- WALL STREET DREAM- LET'S THE MARKET SPEAK!

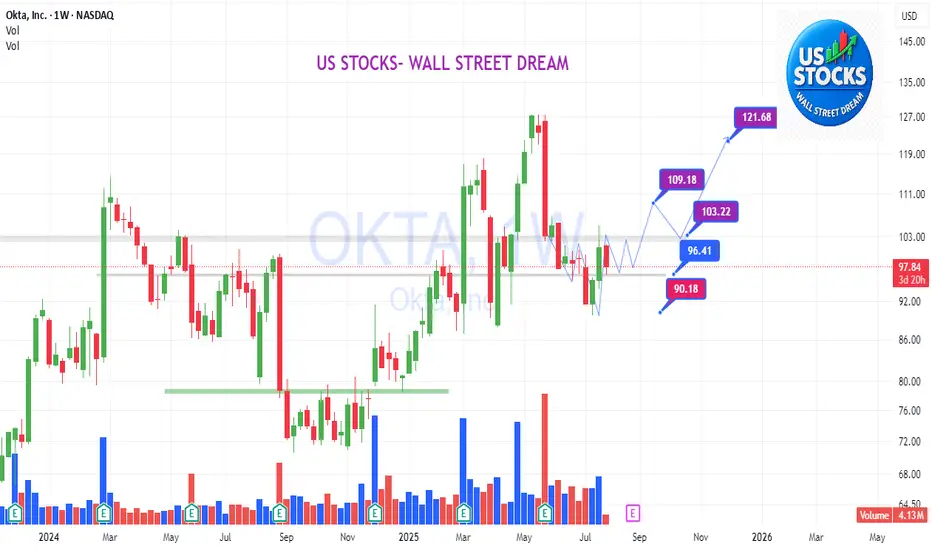
OKTA: swinging on accumulation range, shakeout confirmationOKTA:
.
Swinging on accumulation range, shakeout confirmation.
Inversed HnS pattern is being formed and confirmed.
Wait for next swing movements on right shoulder, before a jump.
.
US STOCKS- WALL STREET DREAM- LET'S THE MARKET SPEAK!
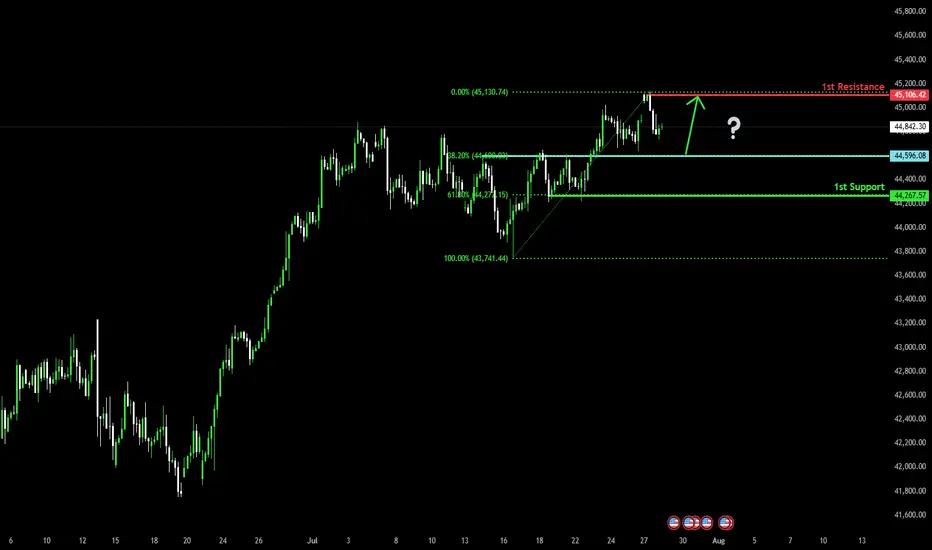
Bullish bounce off overlap support?Dow Jones (US30) is falling towards the pivot and could bounce to the 1st resistance which acts as a swing high resistance.
Pivot: 44,596.08
1st Support: 44,267.57
1st Resistance: 45,106.42
Risk Warning:
Trading Forex and CFDs carries a high level of risk to your capital and you should only trade with money you can afford to lose. Trading Forex and CFDs may not be suitable for all investors, so please ensure that you fully understand the risks involved and seek independent advice if necessary.
Disclaimer:
The above opinions given constitute general market commentary, and do not constitute the opinion or advice of IC Markets or any form of personal or investment advice.
Any opinions, news, research, analyses, prices, other information, or links to third-party sites contained on this website are provided on an "as-is" basis, are intended only to be informative, is not an advice nor a recommendation, nor research, or a record of our trading prices, or an offer of, or solicitation for a transaction in any financial instrument and thus should not be treated as such. The information provided does not involve any specific investment objectives, financial situation and needs of any specific person who may receive it. Please be aware, that past performance is not a reliable indicator of future performance and/or results. Past Performance or Forward-looking scenarios based upon the reasonable beliefs of the third-party provider are not a guarantee of future performance. Actual results may differ materially from those anticipated in forward-looking or past performance statements. IC Markets makes no representation or warranty and assumes no liability as to the accuracy or completeness of the information provided, nor any loss arising from any investment based on a recommendation, forecast or any information supplied by any third-party.
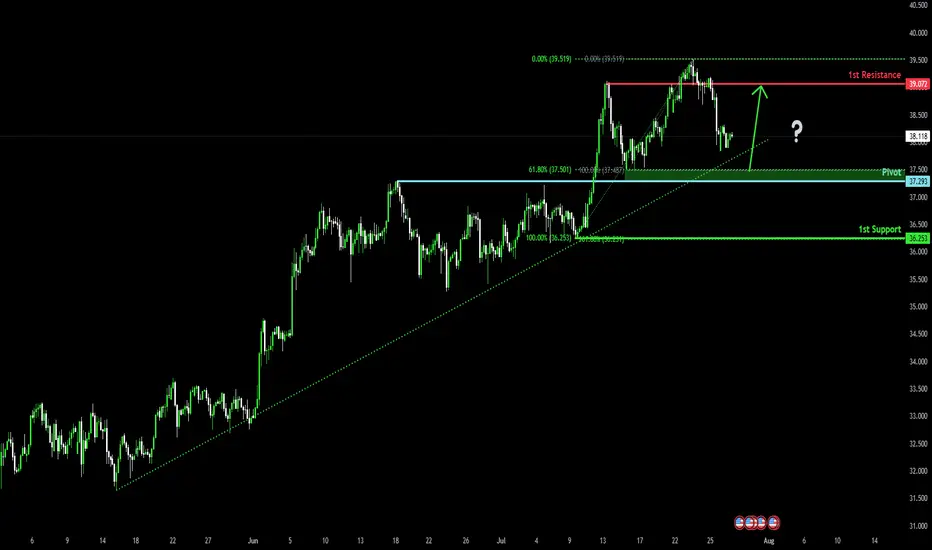
Falling towards pullback support?The Silver (XAG/USD) is falling towards the pivot, which is a pullback support and could rise to the 1st resistance.
Pivot: 37.29
1st Support: 36.25
1st Resistance: 39.07
Risk Warning:
Trading Forex and CFDs carries a high level of risk to your capital and you should only trade with money you can afford to lose. Trading Forex and CFDs may not be suitable for all investors, so please ensure that you fully understand the risks involved and seek independent advice if necessary.
Disclaimer:
The above opinions given constitute general market commentary, and do not constitute the opinion or advice of IC Markets or any form of personal or investment advice.
Any opinions, news, research, analyses, prices, other information, or links to third-party sites contained on this website are provided on an "as-is" basis, are intended only to be informative, is not an advice nor a recommendation, nor research, or a record of our trading prices, or an offer of, or solicitation for a transaction in any financial instrument and thus should not be treated as such. The information provided does not involve any specific investment objectives, financial situation and needs of any specific person who may receive it. Please be aware, that past performance is not a reliable indicator of future performance and/or results. Past Performance or Forward-looking scenarios based upon the reasonable beliefs of the third-party provider are not a guarantee of future performance. Actual results may differ materially from those anticipated in forward-looking or past performance statements. IC Markets makes no representation or warranty and assumes no liability as to the accuracy or completeness of the information provided, nor any loss arising from any investment based on a recommendation, forecast or any information supplied by any third-party.
Bearish drop for the Gold?The price is reacting off the pivot and could drop to the 1st support, which is a swing low support that aligns with the 127.2% Fibonacci extension.
Pivot: 3,319.63
1st Support: 3,271.54
1st Resistance: 3,345.37
Risk Warning:
Trading Forex and CFDs carries a high level of risk to your capital and you should only trade with money you can afford to lose. Trading Forex and CFDs may not be suitable for all investors, so please ensure that you fully understand the risks involved and seek independent advice if necessary.
Disclaimer:
The above opinions given constitute general market commentary, and do not constitute the opinion or advice of IC Markets or any form of personal or investment advice.
Any opinions, news, research, analyses, prices, other information, or links to third-party sites contained on this website are provided on an "as-is" basis, are intended only to be informative, is not an advice nor a recommendation, nor research, or a record of our trading prices, or an offer of, or solicitation for a transaction in any financial instrument and thus should not be treated as such. The information provided does not involve any specific investment objectives, financial situation and needs of any specific person who may receive it. Please be aware, that past performance is not a reliable indicator of future performance and/or results. Past Performance or Forward-looking scenarios based upon the reasonable beliefs of the third-party provider are not a guarantee of future performance. Actual results may differ materially from those anticipated in forward-looking or past performance statements. IC Markets makes no representation or warranty and assumes no liability as to the accuracy or completeness of the information provided, nor any loss arising from any investment based on a recommendation, forecast or any information supplied by any third-party.

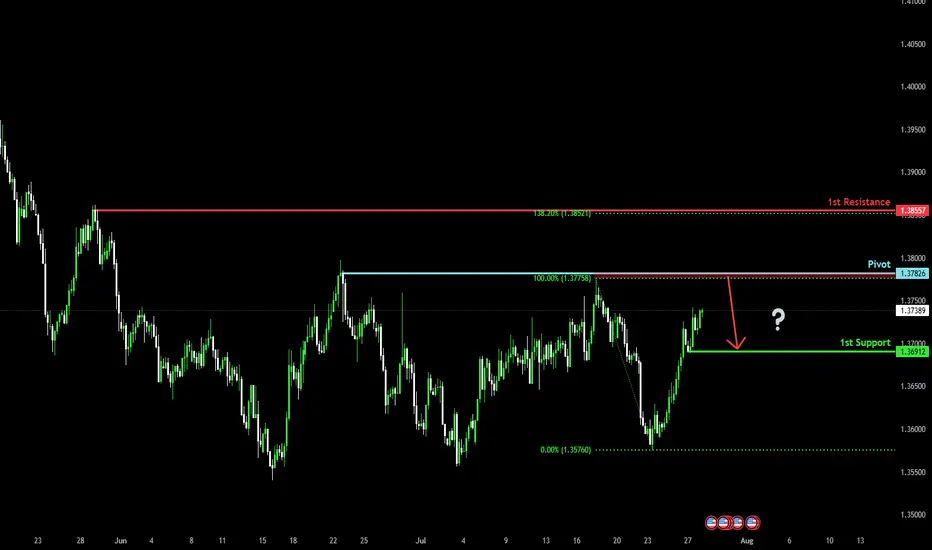
Heading into multi swing high resistance?The Loonie (USD/CAD) is rising towards the pivot, which has been identified as a swing high resistance and could reverse to the pullback support.
Pivot: 1.3782
1st Support: 1.3691
1st Resistance: 1.3855
Risk Warning:
Trading Forex and CFDs carries a high level of risk to your capital and you should only trade with money you can afford to lose. Trading Forex and CFDs may not be suitable for all investors, so please ensure that you fully understand the risks involved and seek independent advice if necessary.
Disclaimer:
The above opinions given constitute general market commentary, and do not constitute the opinion or advice of IC Markets or any form of personal or investment advice.
Any opinions, news, research, analyses, prices, other information, or links to third-party sites contained on this website are provided on an "as-is" basis, are intended only to be informative, is not an advice nor a recommendation, nor research, or a record of our trading prices, or an offer of, or solicitation for a transaction in any financial instrument and thus should not be treated as such. The information provided does not involve any specific investment objectives, financial situation and needs of any specific person who may receive it. Please be aware, that past performance is not a reliable indicator of future performance and/or results. Past Performance or Forward-looking scenarios based upon the reasonable beliefs of the third-party provider are not a guarantee of future performance. Actual results may differ materially from those anticipated in forward-looking or past performance statements. IC Markets makes no representation or warranty and assumes no liability as to the accuracy or completeness of the information provided, nor any loss arising from any investment based on a recommendation, forecast or any information supplied by any third-party.
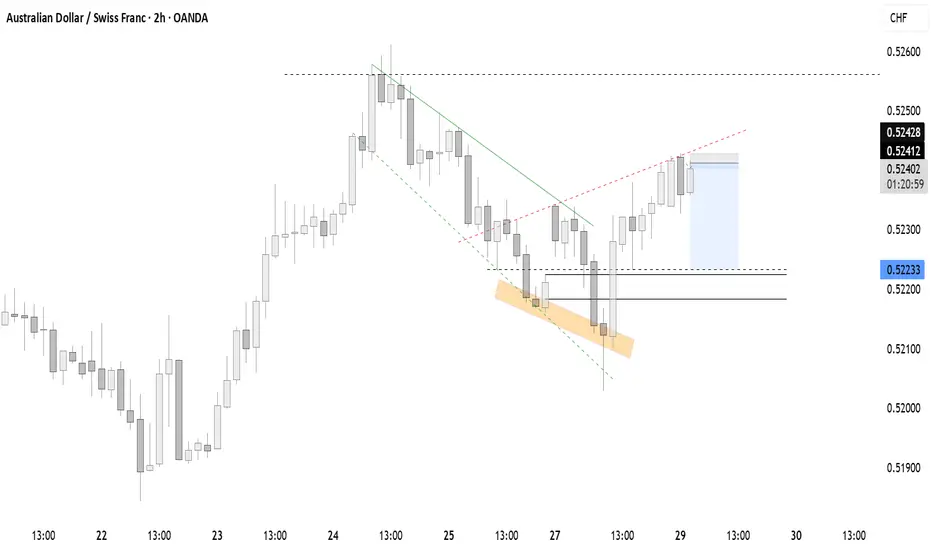
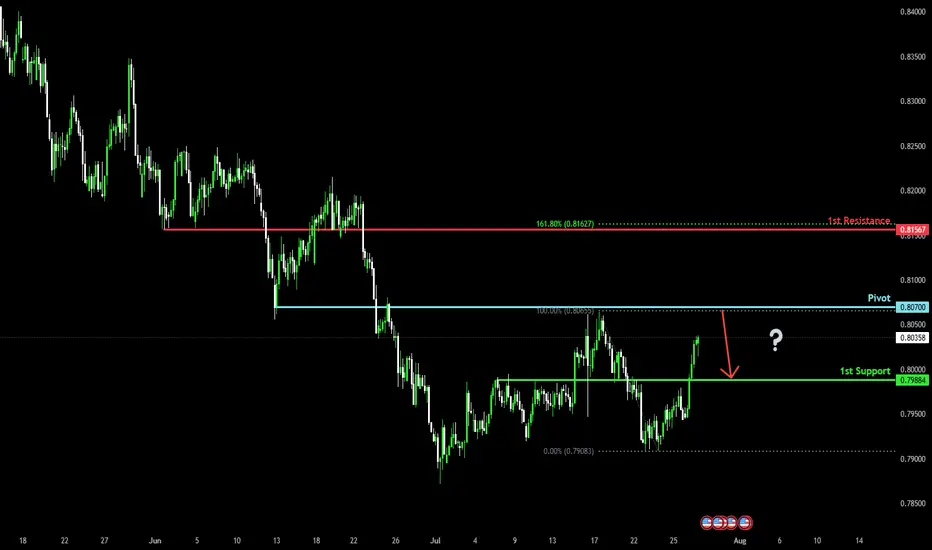
Bearish reversal?The Swissie (USD/CHF) is rising towards the pivot, which acts as an overlap resistance and could reverse to the 1st support.
Pivot: 0.8070
1st Support: 0.7988
1st Resistance: 0.8156
Risk Warning:
Trading Forex and CFDs carries a high level of risk to your capital and you should only trade with money you can afford to lose. Trading Forex and CFDs may not be suitable for all investors, so please ensure that you fully understand the risks involved and seek independent advice if necessary.
Disclaimer:
The above opinions given constitute general market commentary, and do not constitute the opinion or advice of IC Markets or any form of personal or investment advice.
Any opinions, news, research, analyses, prices, other information, or links to third-party sites contained on this website are provided on an "as-is" basis, are intended only to be informative, is not an advice nor a recommendation, nor research, or a record of our trading prices, or an offer of, or solicitation for a transaction in any financial instrument and thus should not be treated as such. The information provided does not involve any specific investment objectives, financial situation and needs of any specific person who may receive it. Please be aware, that past performance is not a reliable indicator of future performance and/or results. Past Performance or Forward-looking scenarios based upon the reasonable beliefs of the third-party provider are not a guarantee of future performance. Actual results may differ materially from those anticipated in forward-looking or past performance statements. IC Markets makes no representation or warranty and assumes no liability as to the accuracy or completeness of the information provided, nor any loss arising from any investment based on a recommendation, forecast or any information supplied by any third-party.
Potential bearish drop?The Cable (GBP/USD) has broken below the support level, which is a multi-swing low support. A potential pullback to the pivot, followed by a rejection, could lead the price to drop to the 1st support.
Pivot: 1.3389
1st Support: 1.3258
1st Resistance: 1.3460
Risk Warning:
Trading Forex and CFDs carries a high level of risk to your capital and you should only trade with money you can afford to lose. Trading Forex and CFDs may not be suitable for all investors, so please ensure that you fully understand the risks involved and seek independent advice if necessary.
Disclaimer:
The above opinions given constitute general market commentary, and do not constitute the opinion or advice of IC Markets or any form of personal or investment advice.
Any opinions, news, research, analyses, prices, other information, or links to third-party sites contained on this website are provided on an "as-is" basis, are intended only to be informative, is not an advice nor a recommendation, nor research, or a record of our trading prices, or an offer of, or solicitation for a transaction in any financial instrument and thus should not be treated as such. The information provided does not involve any specific investment objectives, financial situation and needs of any specific person who may receive it. Please be aware, that past performance is not a reliable indicator of future performance and/or results. Past Performance or Forward-looking scenarios based upon the reasonable beliefs of the third-party provider are not a guarantee of future performance. Actual results may differ materially from those anticipated in forward-looking or past performance statements. IC Markets makes no representation or warranty and assumes no liability as to the accuracy or completeness of the information provided, nor any loss arising from any investment based on a recommendation, forecast or any information supplied by any third-party.

EURAUD THE CURRENT PRICEACTION OF EURAUD IS WATCHED.
EU10Y=2.689%
ECB RATE 2.0%
AU10Y= 4.348%
RBA RATE =3.85%
RATE AND BOND YIELD DIFFERENTIAL FAVOR AUD .
The recent fluctuations in the EUR/AUD exchange rate are primarily driven by factors including:
Monetary Policy and Interest Rate Differentials:
Decisions and outlooks from the European Central Bank (ECB) and the Reserve Bank of Australia (RBA) strongly impact EUR/AUD. Hawkish (tightening) or dovish (easing) policy stances influence demand for each currency, affecting the exchange rate. For example, higher interest rates or hawkish tones usually strengthen a currency, while easing weakens it. Differences in inflation rates and inflation expectations also play a part, as central banks adjust rates accordingly.
Economic Indicators and Growth Outlooks:
Economic performance disparities between the Eurozone and Australia—such as GDP growth, trade balances, and industrial versus commodity exports—drive currency strength or weakness. The Eurozone’s economy is more industrial and technological, while Australia's economy is strongly commodity-driven, especially by prices of iron ore and gold. Changes in global commodity prices or demand can cause the AUD to fluctuate vs the EUR.
Commodity Prices, Especially Gold:
Since Australia is a major gold producer, AUD tends to correlate positively with gold prices. Rising gold prices support AUD strength, which may lower EUR/AUD rates, and vice versa.
Global Risk Sentiment and Geopolitical Events:
Global market sentiment—whether investors seek risk or safe-haven assets—affects both currencies. The Euro and AUD react differently to geopolitical developments and trade tensions. For instance, increased risk appetite can strengthen AUD vs EUR and vice versa depending on circumstances.
In summary, the recent EUR/AUD fluctuations reflect the interplay of ECB and RBA policies, divergent economic data between Europe and Australia, commodity price movements (notably gold), and shifting global risk sentiment.
This explains why EUR/AUD rates move as they do: when the Eurozone outlook improves or ECB signals tightening while Australian commodity prices weaken or RBA signals easing, EUR tends to strengthen against AUD, and the pair rises. Conversely, stronger Australian growth, rising commodity prices, or hawkish RBA moves can push the pair lower.
#EURAUD

Bullish bounce off pullback support?The Fiber (EUR/USD) is falling towards the pivot, which is a pullback support and could bounce to the 1st resistance.
Pivot: 1.1537
1st Support: 1.1456
1st Resistance: 1.1655
Risk Warning:
Trading Forex and CFDs carries a high level of risk to your capital and you should only trade with money you can afford to lose. Trading Forex and CFDs may not be suitable for all investors, so please ensure that you fully understand the risks involved and seek independent advice if necessary.
Disclaimer:
The above opinions given constitute general market commentary, and do not constitute the opinion or advice of IC Markets or any form of personal or investment advice.
Any opinions, news, research, analyses, prices, other information, or links to third-party sites contained on this website are provided on an "as-is" basis, are intended only to be informative, is not an advice nor a recommendation, nor research, or a record of our trading prices, or an offer of, or solicitation for a transaction in any financial instrument and thus should not be treated as such. The information provided does not involve any specific investment objectives, financial situation and needs of any specific person who may receive it. Please be aware, that past performance is not a reliable indicator of future performance and/or results. Past Performance or Forward-looking scenarios based upon the reasonable beliefs of the third-party provider are not a guarantee of future performance. Actual results may differ materially from those anticipated in forward-looking or past performance statements. IC Markets makes no representation or warranty and assumes no liability as to the accuracy or completeness of the information provided, nor any loss arising from any investment based on a recommendation, forecast or any information supplied by any third-party.
