Buy LimitI think it's a great zone to buy — but only if the selling volume decreases as the price approaches that area. Otherwise, we wait for the volume to drop. But I will never buy above that price, even if I miss the move.
Harmonic Patterns
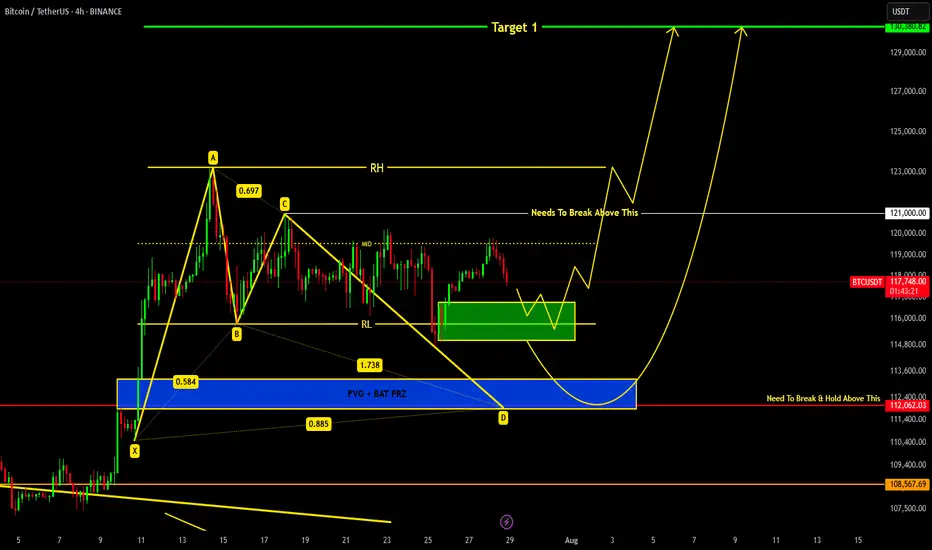
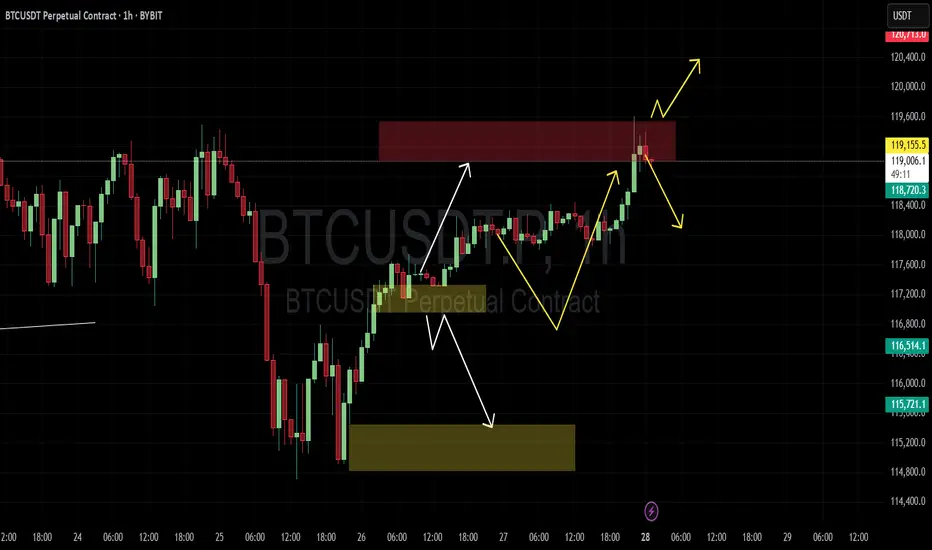
BITCOIN Current Update !!!we are heading towards support region around 116.8k-115k from where we can expect a reversal.
If price breaks down 115k level then a bat harmonic pattern is also forming which indicates it's PRZ at 113-112k region...
Remember 121k is key level which needs to be broken in order to remain bullish !!!
Perfect Sync: V Reversal Meets Bull Flag
Two clean and classic technical structures:
✅ V-Reversal Formation
✅ Bull Flag – still active and building pressure
After a sharp reversal, the price entered a bullish continuation phase.
Currently moving within the flag structure toward its upper edge.
If we see a breakout to the upside, the move could match the flagpole length, which aligns well with the target from the V-reversal pattern.
📍 Bullish scenario remains valid as long as we stay within structure.
📉 Breakdown below $570 invalidates this setup.
🧠 Important Reminder:
Enter only after a confirmed breakout.
✅ Apply strict risk management
✅ Never risk more than 1% of your capital on a single position.
Everything’s clear. No noise. Just wait for confirmation — let the market come to you.

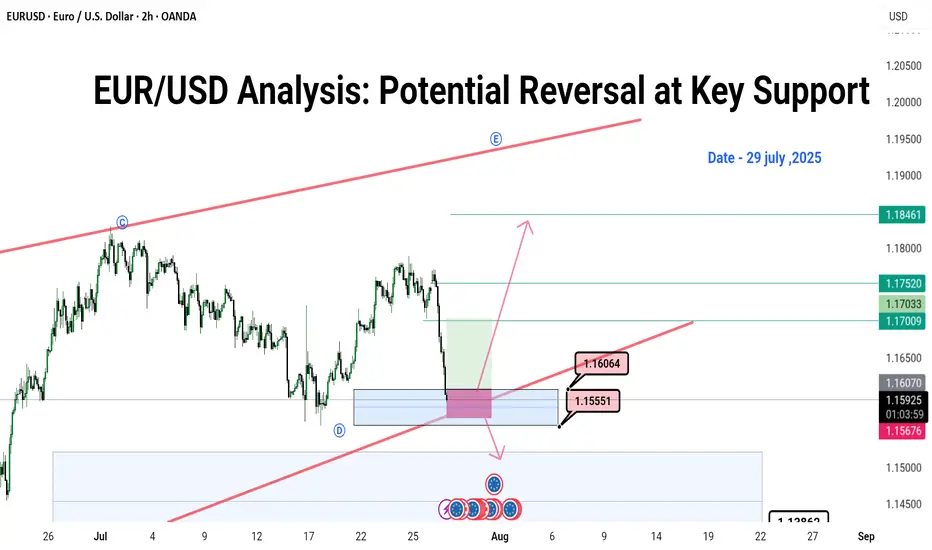
EUR/USD Analysis: Potential Reversal at Key Support📉 Day 3 of 100: EUR/USD Breaks Structure!
Today’s market gave us a lesson! 📚
✅ SL Hit due to news
✅ 61% order block broken
✅ NY session may go bullish after Asia+London trap
.
Are you seeing the pattern unfold?
👇 Comment “Wave Watcher 🌊” if you use Elliott Wave!
Day 3/100 - EUR/USD Breakdown! | Forex Analysis | Elliott Wave | Order Block Strategy
In today’s update: 📌 SL hit due to major fundamental shift
📌 Break of 61% order block; heading to 78% zone
📌 Similar pattern in Tokyo/London sessions—bullish setup possible for NY session
.
💬 Drop a comment if you're also using Elliott Wave price action!
👍 Like | 🔁 Share | 🔔 Subscribe for more daily updates!
🚀 Join the 100-Day EUR/USD Challenge — Let’s decode the market together!
#forex #eurusd #elliottwave #orderblock #forextrader #forexeducation #smartmoneyconcepts #priceaction #forexchallenge #newyorksession #technicalanalysis #forexstrategy
---
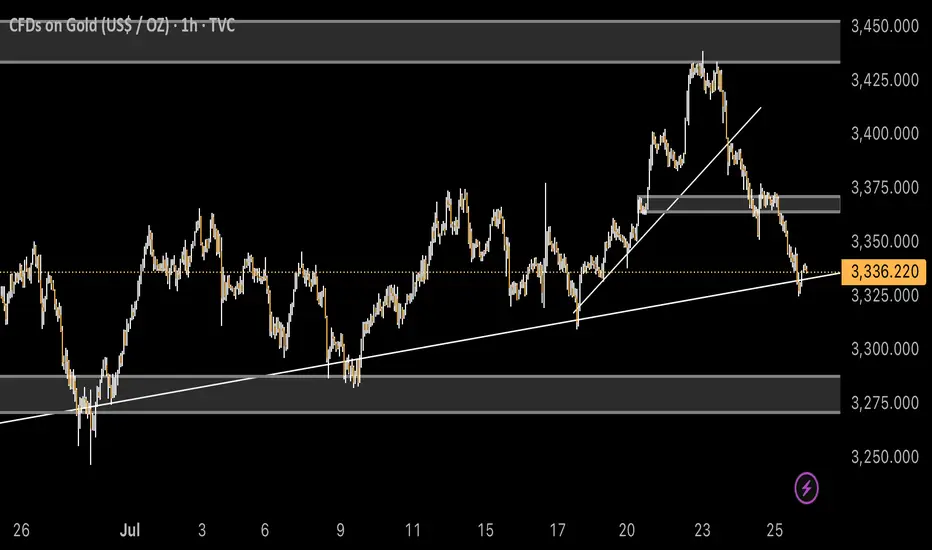
Analysis for the next week (XAUUSD) Hello Traders, Happy Weekend.
The market is going to open tonight, As you see the down trend is running, the price is falling like a waterfall.
Now the market is on the support area according to H1 & H4 TimeFrame.
The market is respecting the support area and there is a Trend line support according to D1 TimeFrame.
The market is respecting the Trend line and support area.
According to my analysis gold will drop till 3287 to 3271.
If gold fly, it can fly till 3350 then it will fall.
Stay tune for update.
Kindly share your views and leave positive comments here, Thanks.
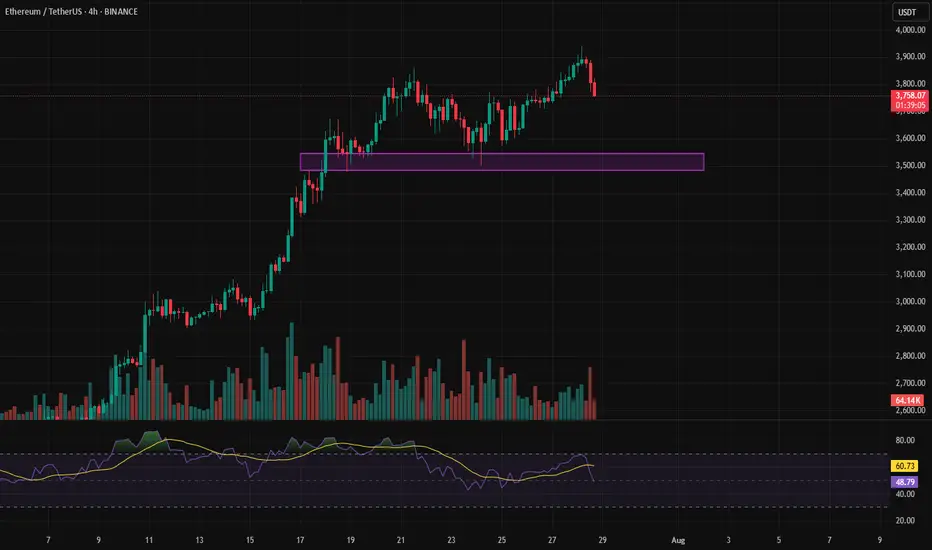
Ethereum bigger pictureToday we are measuring the difference between Ethereum's current price and its average price over a specific period. We see how far the current price deviates from its statistical average. This helps traders identify potential overbought and oversold conditions. Even though institutions and etfs have bought up over 32x the supply of Ether since May, it has showed in the past 36 Days with ether running over 80%, we look at reducing exposure as the risk remains for a correction in the short term.
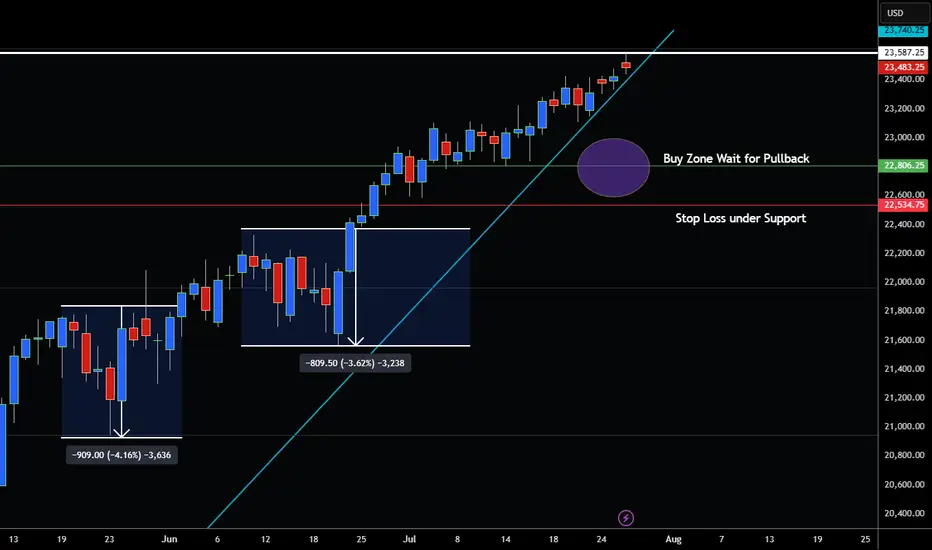
NASDAQ 100 LOOKING OVERBOUGHT RIPE FOR A CORRECTION?Hey Traders so today was looking at the Nasdaq 100 and it seems like it's approaching overbought territory at all time highs.
Of course no one knows what earnings season will bring and seasonally historically August is normally a good month for stocks.
So if we look at previous rallies market seems to correct eventually 3% or 4%. I think that is actually healthy for the market also.
So if your bullish watch for 3% correction and buy back in around 22,800-23,000 put a stop under support at around 22,000-22,500. Hopefully the market won't make it that far on a sell off so odds of getting stopped out are low I think.
However if you are Bearish I don't reccommend selling at All Time High. Best odds for stronger selloff I think is waiting until September as it is historically the weakest month of the year for stocks seasonally.
Good Luck & Always use Risk Management!
(Just in we are wrong in our analysis most experts recommend never to risk more than 2% of your account equity on any given trade.)
Hope This Helps Your Trading 😃
Clifford
GE WEEKLY OPTIONS SETUP (2025-07-28)
### ⚙️ GE WEEKLY OPTIONS SETUP (2025-07-28)
**Mixed Signals, Bullish Flow – Can Calls Win This Tug-of-War?**
---
📊 **Momentum Breakdown:**
* **RSI:** Falling across models → ⚠️ *Momentum Weak*
* **Volume:** Weak 📉 = Low conviction from big players
* **Options Flow:** Call/Put ratio favors bulls 📈
* **Volatility (VIX):** Favorable for directional plays
🧠 Model Consensus:
> “Momentum weak, but bullish flow + low VIX = cautiously bullish.”
> Some models recommend **no trade**, others suggest **tight-risk long call**.
---
### ✅ WEEKLY SETUP AT A GLANCE
* 🔍 **Volume:** Weak (distribution risk)
* 📉 **Momentum:** RSI fading
* 💬 **Options Sentiment:** Bullish bias (calls > puts)
* ⚙️ **Volatility:** Favorable
**Overall Bias:** 🟡 *Moderate Bullish*
---
### 💥 TRADE IDEA: GE \$275C
* 🎯 **Strategy:** Long Weekly Call
* 🔵 **Strike:** 275.00
* 📆 **Expiry:** Aug 1, 2025
* 💸 **Entry:** \$1.10
* ✅ **Profit Target:** \$1.80
* 🛑 **Stop Loss:** \$0.55
* 📈 **Confidence Level:** 65%
* 🧮 **Risk Level:** Medium (momentum divergence = tread carefully)
* ⚠️ **Support Watch:** Monitor for drop below \$268–270 for potential exit.
---
### 📦 TRADE\_DETAILS (Algo/Backtest Ready JSON)
```json
{
"instrument": "GE",
"direction": "call",
"strike": 275.0,
"expiry": "2025-08-01",
"confidence": 0.65,
"profit_target": 1.80,
"stop_loss": 0.55,
"size": 1,
"entry_price": 1.10,
"entry_timing": "open",
"signal_publish_time": "2025-07-28 12:08:59 UTC-04:00"
}
```
---
### 📌 NOTES FOR TRADERS
* 🤖 Models split between *no trade* vs *tight-risk long*
* 🚨 **Momentum divergence** is real – don’t oversize
* 🧭 **Watch Friday theta decay** — manage exits accordingly
* 🔍 Chart check: Watch price action near \$275 and \$268
---
**#GE #OptionsTrading #WeeklyPlay #CallFlow #UnusualOptionsActivity #GEcalls #AITrading #RiskManagement**

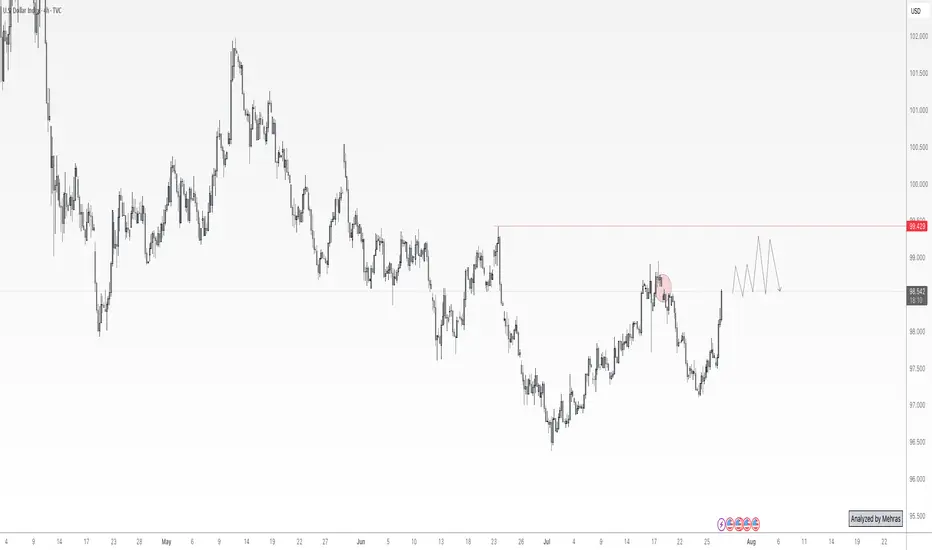
DXY at Its Most Critical Level of 2025 — Will the 100 Bank LevelThe Dollar Index (DXY), just like several other majors, is approaching a very important level. We’re now near the 100 mark, which is not only a psychological level — but also a key institutional (bank) level.
There’s also a gap zone left behind that price is about to fill. I believe the index will stay in a range over the next 1–2 days as it waits for critical data later this week — especially Wednesday’s announcements and Friday’s NFP report, which could set the tone for what’s next.
Based on current market sentiment, Trump’s remarks, Powell’s upcoming speech, and broader macro factors, I believe DXY has the potential to break above 100 and move toward 102–104, if that level is broken cleanly.
Let’s also not forget — price bounced from a monthly demand block near 96, and we’re seeing weak support across majors like EUR and Gold. That adds confluence for potential dollar strength.
📌 What do you think — is dollar strength just around the corner?
🔁 This analysis will be updated whenever necessary.
Disclaimer: This is not financial advice. Just my personal opinion.
BTC SMALL CORRECTION ? we did an amzing long and gained good profit
now looking for a short and a breakout for long
posted next moves
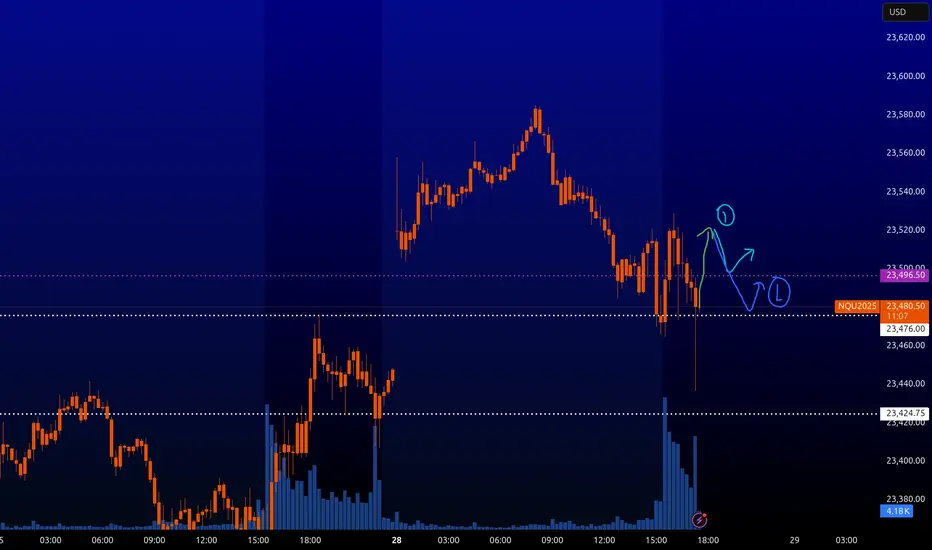
NQ : Scalping levelsHere's a very likely scenario on the NQ trade. Once the price grows back, you can take short pullbacks from these levels.
Be careful on trading on the news. It is better not to trade in them. Also, the levels are unlikely to work in illiquid times.
I will post the results of the levels and my trades in the comments if everything will be according to the scenario.
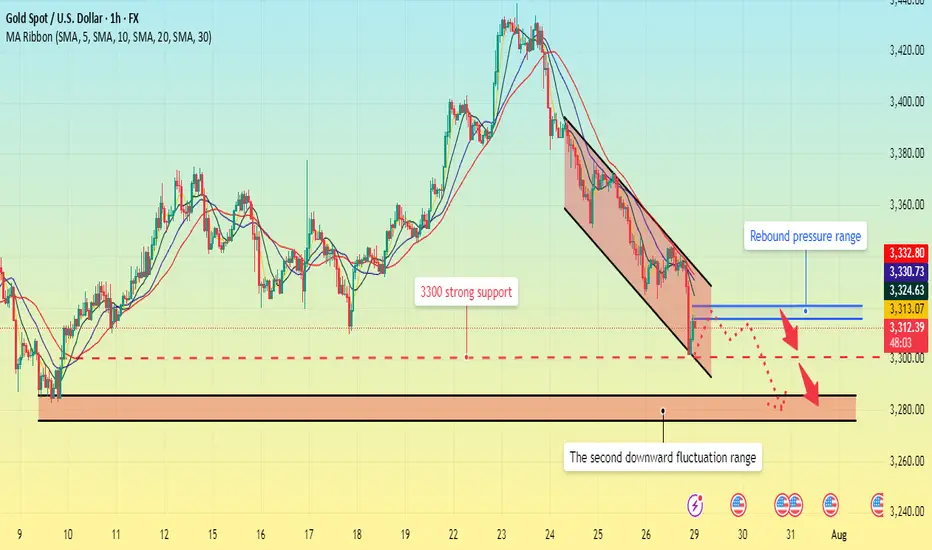
Gold fell below support. What will be the subsequent trend?The 1-hour moving average of gold continues to show a downward short position, indicating that the downward momentum is still sufficient; the wave pattern of gold's current decline remains intact, but the rebound strength is very weak, showing an obvious short trend of gold. Moreover, when gold rebounded in the short term, obvious resistance began to form above 3320, and the upward momentum was slightly insufficient.
From the daily chart, before 3300 fails to fall, it is likely to fluctuate around 3300-3350. On the contrary, if it falls below 3300, it is likely to reach the bottom of the 3385-3375 range.
This week is a super data week. The data of each day may affect the trend of gold on that day, but it will not form a unilateral strong trend. Therefore, the volatility before and after the data is released is likely to be large, so traders should focus on the following data:
1. US ADP employment report, US second quarter GDP preliminary value;
2. Federal Reserve interest rate decision;
3. US PCE annual rate, monthly rate;
4. The last trading day of this week will usher in non-agricultural data.
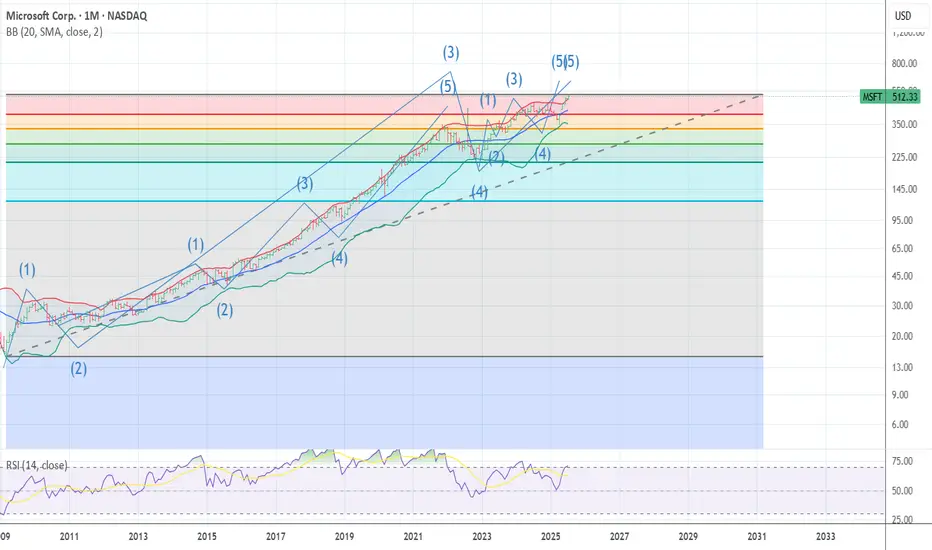
MSFT SUPER CYCLE WAVE 3 TOP MSFT The bell weather .Is now ending what looks to be the 5th wave for super cycle wave 3 top here from 518 to 525 from the 2009 low wave 2 . I am buying late 2027 525 puts Now the downside over the next 18 months is down near the previous wave 4 low 341 area I expect we will that at a min with odds as low as 222 . best of trades Wavetimer
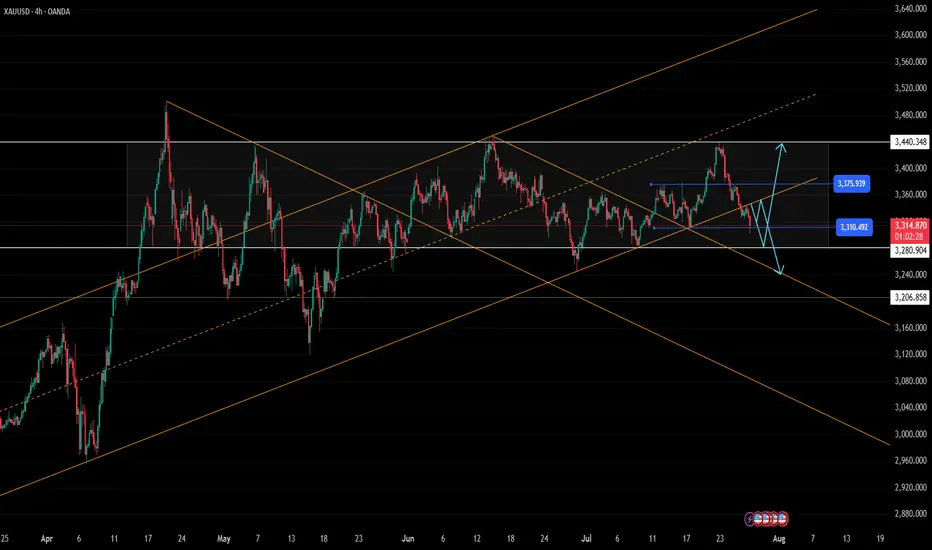
Key fluctuation range of gold price: 3300-3345Key fluctuation range of gold price: 3300-3345
As shown in Figure 4h
It is expected that the gold price will still fluctuate widely in the range of 3280-3440.
However, the special thing is that the gold price trend has broken through the support of the long-term upward trend, and the triangular oscillation convergence structure has been destroyed.
The important ranges to pay attention to next:
Pressure zone: 3330-3345
Support zone: 3300
Through technical analysis: Obviously, intraday trading is mainly based on high-altitude thinking.
It should be noted that 3300 points is an important watershed between the bull market and the bear market, so there is definitely no shortage of bargain hunting chips.
Be cautious about bottom-fishing.
In the next few days, the trend of gold prices will focus on the fluctuation performance of the 3300-3345 range.
Operation strategy:
Buy: 3300-3310
Stop loss: 3295
Target: 3320-3345
Sell: 3330-3340
Stop loss: 3350
Target: 3300-3280
Buy cautiously at low prices, and try to short at high prices
TQQQ WEEKLY TRADE IDEA (07/28/2025)
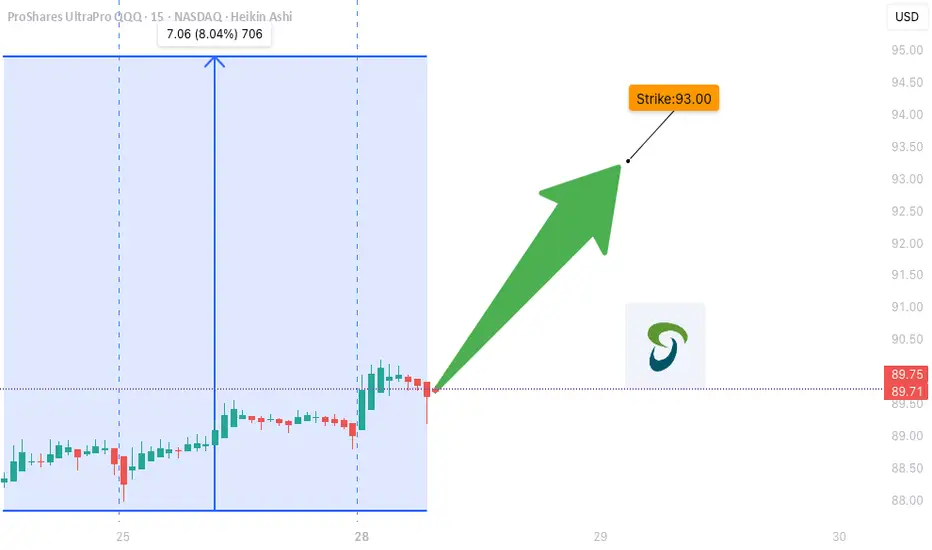
**🚀 TQQQ WEEKLY TRADE IDEA (07/28/2025) 🚀**
**Triple-Leveraged Momentum Play — But Watch the Volume Trap!**
---
📈 **Momentum Snapshot:**
* **Daily RSI:** 75.0 ⬆️
* **Weekly RSI:** 70.1 ⬆️
🔥 Bullish across **all timeframes** = strong trend confirmation
📊 **Options Flow:**
* **Call Volume:** 24,492
* **Put Volume:** 18,970
* **C/P Ratio:** **1.29** → Institutional bias = **Bullish**
📉 **Volume Concern:**
* Weekly volume = **0.8x** previous week
⚠️ Weak participation could limit breakout strength
🌪️ **Volatility Environment:**
* **VIX < 20** → ✅ Great for directional plays
---
🔍 **Model Consensus Recap:**
✅ All reports agree on bullish momentum
✅ Favorable volatility = cleaner setups
⚠️ Volume is the only red flag
📌 Final Take: **Bullish, but be tactical**
---
💥 **RECOMMENDED TRADE SETUP (Confidence: 75%)**
🎯 **Play:** Buy CALL Option
* **Strike:** \$93
* **Expiry:** Aug 1, 2025
* **Entry Price:** \~\$0.79
* **Profit Target:** \$1.58 (🟢 2x Gain)
* **Stop Loss:** \$0.39 (🔻 50% Risk)
📆 Entry Timing: Market Open
📏 Position Size: 2–4% of account
---
⚠️ **Key Risks to Watch:**
* 🔍 **Volume Trap**: Weak volume = fragile follow-through
* ⚡ **Gamma Risk** into expiry → price may swing quickly
* 📉 Avoid chasing — stick to setup, use stop-loss
---
📌 **JSON FORMAT TRADE DETAILS (Automation-Ready):**
```json
{
"instrument": "TQQQ",
"direction": "call",
"strike": 93.0,
"expiry": "2025-08-01",
"confidence": 0.75,
"profit_target": 1.58,
"stop_loss": 0.39,
"size": 1,
"entry_price": 0.79,
"entry_timing": "open",
"signal_publish_time": "2025-07-31 09:29:00 UTC-04:00"
}
```
---
**TL;DR:**
✅ RSI momentum = 🔥
📈 Call flow = ✅
⚠️ Volume = 🟡 Caution
🎯 \ NASDAQ:TQQQ breakout play for the bold
💬 Are you riding the 3x bull, or waiting for confirmation?
\#TQQQ #OptionsTrading #MomentumSetup #UnusualOptionsFlow #TradingView #TechStocks #QQQ #LeveragedETF
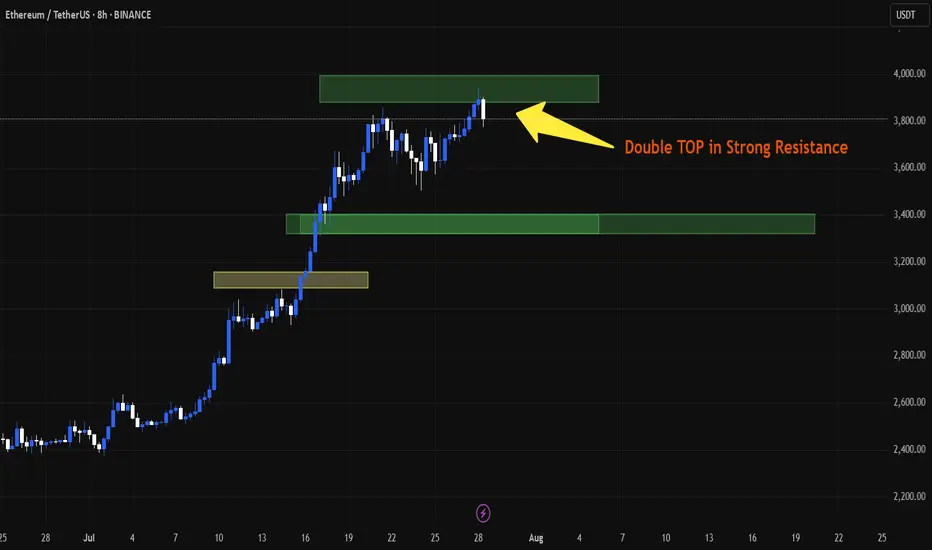
ETH may have PULL BackAs we can see, a double top has formed at around $4,000 and I guess we have a pullback to around $3,500. The new RSI is showing a pullback and strong divergence. If ETH breaks $4,000, this analysis will be rejected.
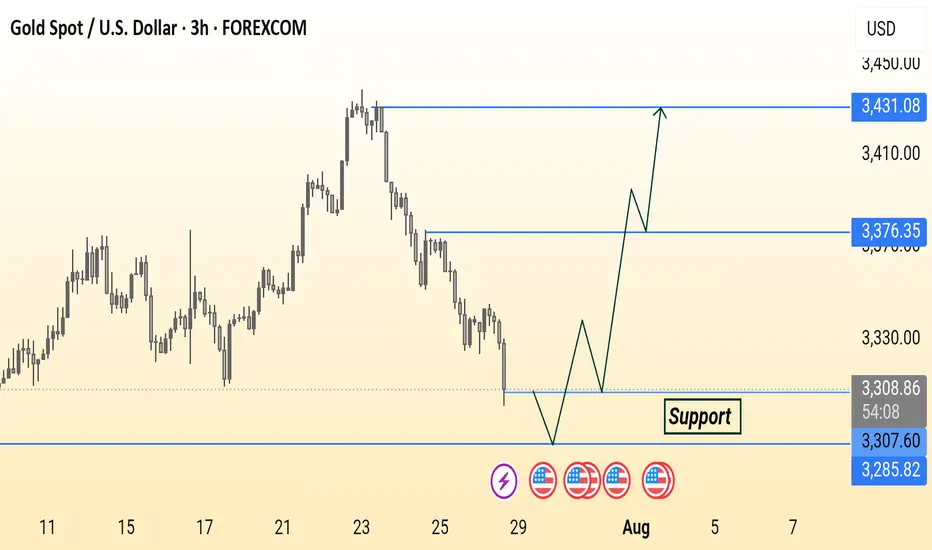
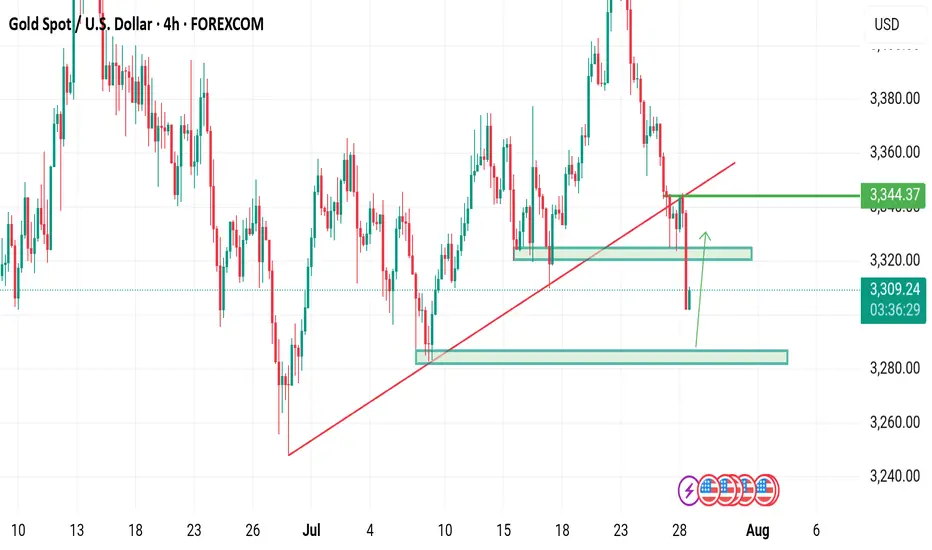
Xauusd bullish setupGold (XAU/USD) is approaching a key support zone around 3,285.82. The chart suggests a potential bullish reversal from this level, targeting resistances at 3,376.35 and 3,431.08. Price action may form a double bottom before moving upward.
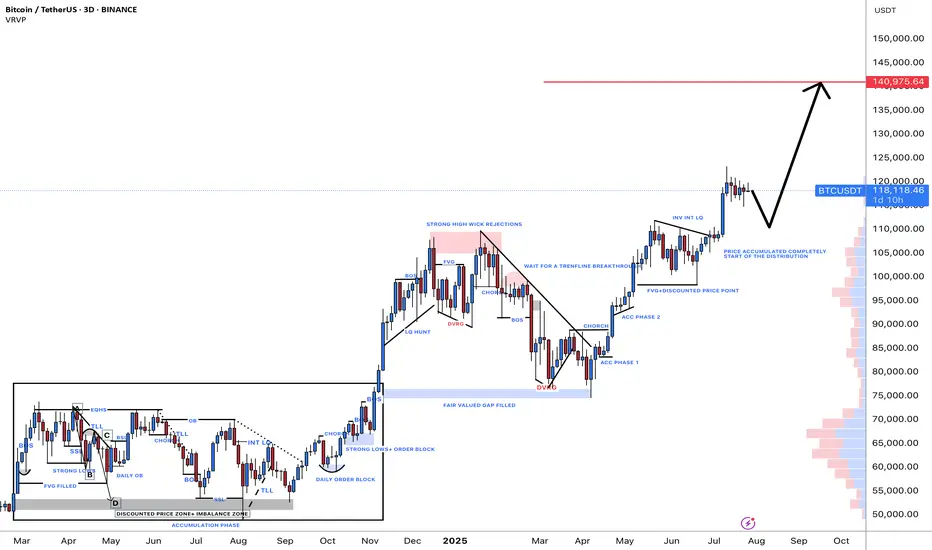
#BTCUSDT: Minor Correction In Price Then $150,000?Hi everyone,
Hope you are doing great we are witnessing some minor bearish correction in the price and think this might be a sellers trap. We think $110,000 can be a good area to buy. Our target is at $150,000 area which look possible after looking at how price recently behaved.
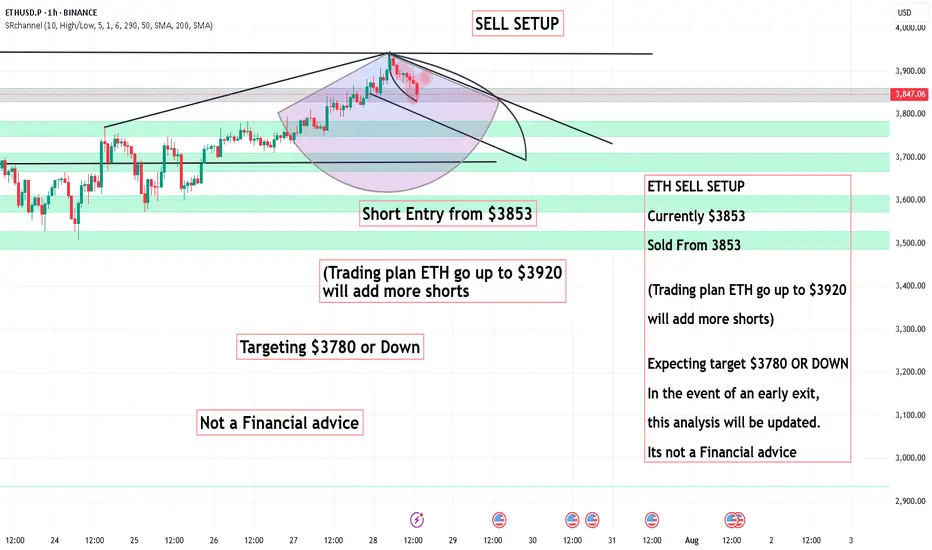
ETH SELL SETUP ,Sold From 3853ETH SELL SETUP
Currently $3853
Sold From 3853
(Trading plan ETH go up to $3920
will add more shorts)
Expecting target $3780 OR DOWN
In the event of an early exit,
this analysis will be updated.
Its not a Financial advice
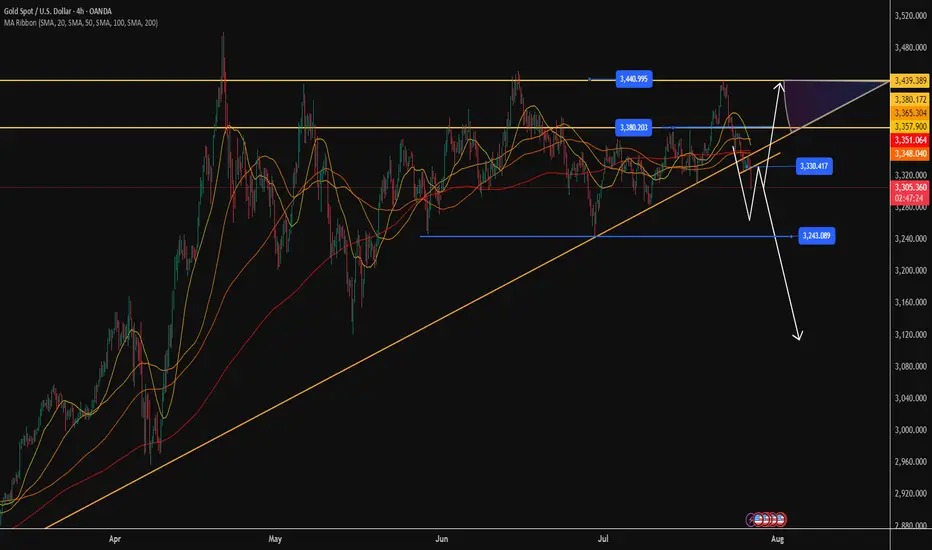
XAUUSD Next swing is Ready Gold is currently below rising channel also completion of structural support chart . Eyes on DXY
What's possible scanarios we have?
▪️I will wait next for my buy trades at 3290-3285 area but what we have to watch during that time H4 candle closing.
▪️Secondly if H4 candle closing below 3278-3275 this upside move will be invalid
Additional TIP: let the market comes to you
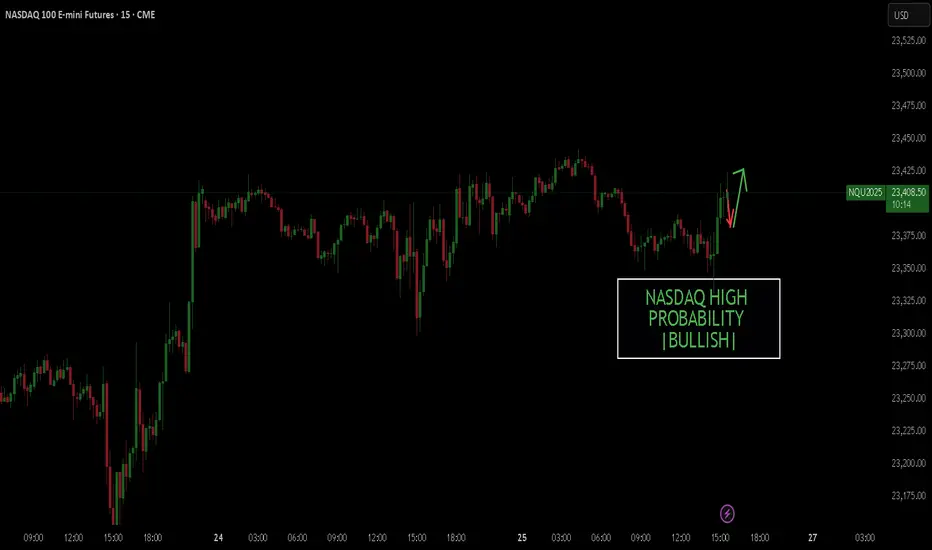
NASDAQ BULLISHHello, I hope you are well today. I just noticed that the Nasdaq could be starting a new bullish trend with an 85% probability.
Gold price final game: 3300Gold price final game: 3300
Today's gold price is on the verge of collapse, but the direction divergence still exists, with long and short intertwined.
Pay attention to the 3300 support.
The entire triangle convergence and oscillation pattern has been broken, and the important support platform before 3330 points has been broken.
Regardless of how the policy is announced,
shorting is inevitable.
Next, the bulls will enter the final bottom-picking stage:
Buy: 3300-3310
Stop loss: 3290
Target: 3330-3340+
Technical analysis:
Short-term support level: 3300
Short-term resistance level: 3330-3345
Market sentiment: The gold market sentiment presents a pattern of long and short intertwined and weak volatility.
In the short term, pay attention to the $3300 support level and the Fed's interest rate cut policy signal.
If the Fed turns to interest rate cuts or geopolitical conflicts escalate, gold may resume its upward trend.
Daily operation suggestions:
Long-term thinking: Bottom-picking thinking: Bottom-picking range: 3300-3310
Stop loss: 3290
Target: 3330-3345+
Short-term thinking: Trend-following thinking: High-altitude range: 3320-3330
Stop loss: 3345
Target: 3300-3280-3250
Final game of gold price: 3300
Today's gold price is on the verge of collapse, but the direction divergence still exists, and long and short positions are intertwined.
Pay attention to the 3300 support.
The entire triangle convergence and oscillation pattern has been broken, and the important support platform before 3330 points has been broken.
Regardless of how the policy is announced,
shorting is inevitable.
Next, the bulls will enter the final bottom-picking stage:
Buy: 3300-3310
Stop loss: 3290
Target: 3330-3340+
Technical analysis:
Short-term support: 3300
Short-term resistance: 3330-3345
Market sentiment: The gold market sentiment shows a pattern of mixed long and short positions and weak volatility.
In the short term, pay attention to the $3,300 support level and the Fed's interest rate cut policy signal.
If the Fed turns to interest rate cuts or geopolitical conflicts escalate, gold may resume its upward trend.
Daily operation suggestions:
Long-term thinking: bottom-picking thinking: bottom-picking range: 3300-3310
Stop loss: 3290
Target: 3330-3345+
Short-term thinking: trend-following thinking: high-altitude range: 3320-3330
Stop loss: 3345
Target: 3300-3280-3250
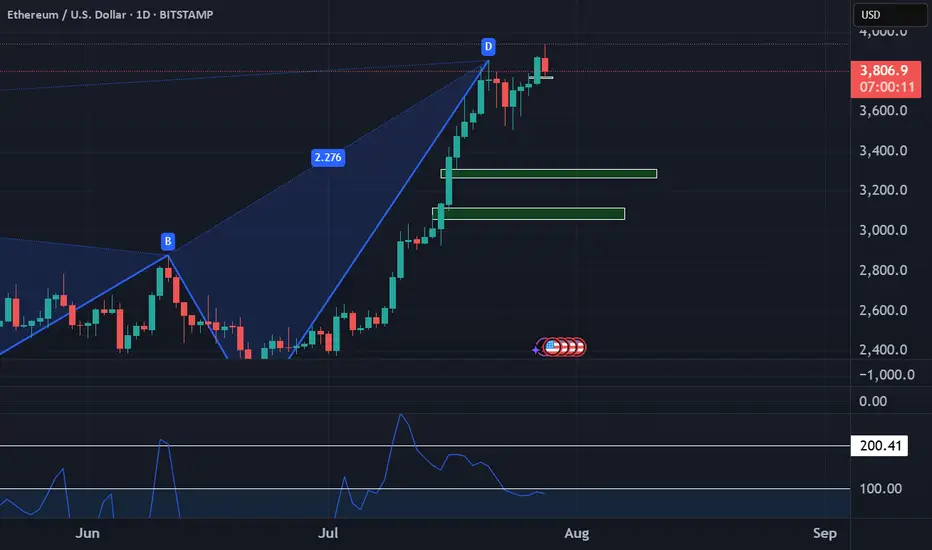
ETHEREUM Long Outlook – Grand Supercycle Perspective(2025.05.21)Hello everyone,
This is SeoVereign, operator of the SeoVereign Team.
Today, I would like to share an Ethereum analysis based on the daily (1D) chart for the first time in a while.
Before reading this post, please refer to the idea I uploaded on April 18, 2025, through the link below. It will help you better understand the context:
🔗
(Clicking the image will take you to the corresponding link.)
If you look at the April 18 idea, you’ll see that I presented a bullish outlook based on the Deep Crab pattern.
This analysis is a continuation of that idea.
Through years of research, I’ve observed that when a Deep Crab pattern sees a rebound from the PRZ (Potential Reversal Zone), the trend that begins from that point tends to extend for a long time.
If you look closely at the chart, you’ll also see the 2.24 Fibonacci extension level.
Some people messaged me saying, “Since it went above 1.902 and even exceeded the 2.0 Fibonacci line, isn’t this Deep Crab invalid?”
However, I’ve studied harmonic patterns in depth for a long time and have set my own Fibonacci criteria based on that research.
In this particular Deep Crab case, I define the invalidation level as 2.24.
Therefore, I judged that the pattern is still valid, and this allowed me to forecast a long-term bullish trend.
Back to the main point,
Based on this Deep Crab pattern, I’ve consistently maintained a bullish outlook on the daily chart,
and so far, there have been no clear signals indicating a reversal into a bearish trend.
Thus, I would like to post a continuation of the bullish outlook on the daily chart.
On May 19, 2025, there was a sharp drop around the 2,587 USDT level.
At that time, our team expected the bullish trend that started from around 2,447 USDT to hold its low and continue.
However, the price broke below 2,447 USDT and made a new low.
We then closely monitored Bitcoin’s movement in response.
Typically, strong volatility occurs before a major trend begins.
Bitcoin was also showing significant volatility at the time.
So we concluded: “Let’s maintain a bullish stance, but do not be fully convinced until the previous high of 2,587 USDT is clearly broken upward.”
And by the time this post is published, we’ve confirmed that the price has indeed broken above 2,587 USDT.
Therefore, I have come to the conclusion that the bullish trend is still valid.
Based on this, I present the following three target levels.
🎯 SeoVereign’s Ethereum Bullish Targets
1st Target: 3,000 USDT
2nd Target: 3,400 USDT
3rd Target: 3,700 USDT
The market still shows strong volatility.
I sincerely hope you all trade wisely and calmly, achieving great returns,
and may great fortune be with you both in trading and in life.
I’ll see you again in the next daily analysis.
Thank you.
- SeoVereign
