BTC Long Outlook – Grand Supercycle Perspective (2025.05.21)Hello everyone,
This is SeoVereign, the operator of the SeoVereign team.
It's been nearly a month since I returned to TradingView and started posting ideas again.
During that time, I’ve frequently shared short-term ideas based on minute charts.
However, since real-time responses are crucial in short timeframes,
there are practical limitations in explaining all the reasoning behind our analysis in detail each time.
But when it comes to larger timeframes like the daily chart,
we have a bit more flexibility.
So I see this as a valuable opportunity to explain our thought process and key reasoning more thoroughly.
Now, let’s get into the Bitcoin daily chart briefing.
Please refer to the following link first.
This is a post I made on April 18, 2025:
🔗
At the time, I shared the view that the upward wave starting near 75K
had the potential to extend to 88K and even 96K.
However, it was difficult to determine exactly how far the wave would extend at that point.
Now, I want to make one thing very clear.
If someone uses wave theory to say something like
"Bitcoin will definitely go to X price,"
that person is either a scammer or someone who fundamentally misunderstands wave theory.
Elliott Wave Theory can be somewhat useful in anticipating short-term moves,
but it has clear limitations when applied to long-term predictions.
After many years of studying Elliott Wave Theory in depth,
I've come to a simple but important conclusion:
"You cannot predict the distant future with technical analysis alone."
That said, there is one exception:
very short-term movements — the immediate price action right in front of us —
can often be approached with some confidence using technical analysis.
Here’s an example.
If someone bought Bitcoin at 10K and says,
“I’m going to sell at 100K,”
while it hasn’t even broken past 50K,
that’s just reckless optimism.
But if Bitcoin has already approached 100K,
and several bearish signals are starting to emerge and become confirmed,
that’s when we can begin considering short positions.
The key is to make decisions based on the data right now — not based on hopes or assumptions.
That was a long introduction.
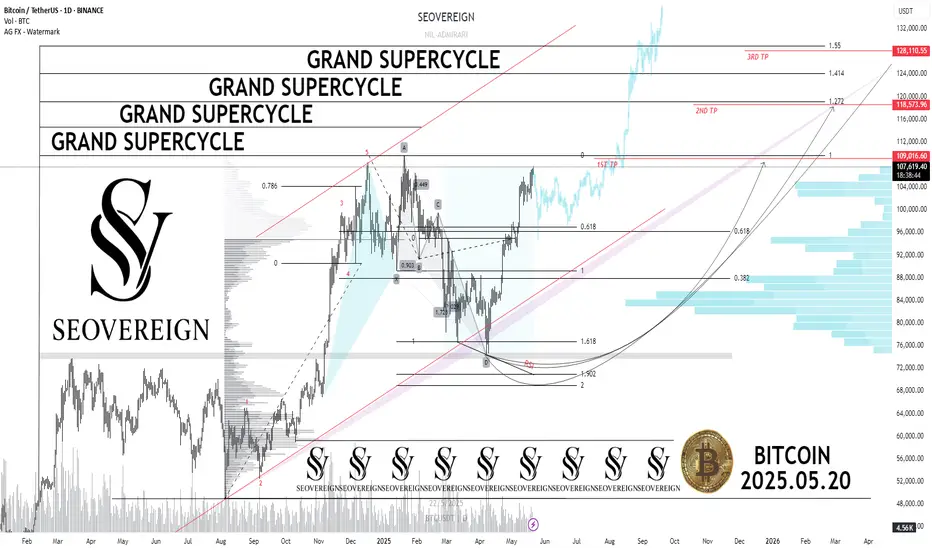
Now, let me explain why I believe Bitcoin could break to new all-time highs
and possibly reach as high as 130K.
As I mentioned in the April 18 post,
I believe an Ending Diagonal was completed around the 74K region,
and I anticipated an upward impulse wave to follow.
In my view, the current market structure clearly suggests we are in an uptrend.
Many of you have reached out via private messages asking,
“What kind of wave are we in right now?”
But in this case, that question doesn’t hold much value.
Whether this current move is part of an impulse wave or a corrective structure,
what matters is that the price is going up.
If, for instance, the A-wave has completed — as confirmed by Fibonacci —
then the B-wave would follow, and we can plan accordingly with long positions.
Or, if the ABC correction is already over,
then a new impulse wave could be starting.
Either way, the key takeaway is that we’re likely in an upward phase.
Back to the main point:
A Deep Crab harmonic pattern formed near 74K,
and that zone concluded with an Ending Diagonal,
which is now leading to a bullish reversal.
I've studied harmonic patterns for years,
and in the case of the Deep Crab,
the upper boundary of the Potential Reversal Zone (PRZ)
is typically around the 2.24 Fibonacci extension.
As long as this level is not broken,
the pattern remains valid.
And when a reversal happens near the 1.618 or 1.902 zones,
it’s often a highly reliable bullish signal.
So, what are our targets in this current rally?
🎯 SeoVereign’s Target Strategy
1st Target: 109,000
2nd Target: 118,600
3rd Target: 128,100
Right now, before the market enters a full-scale bullish breakout,
we’re seeing unusually high volatility.
In times like this, staying calm and grounded is more important than ever.
I sincerely wish all of you the best of luck in navigating this volatility,
and may a wave of growth come to your accounts as well.
🍀 I genuinely hope great fortune finds its way to all of you.
See you in the next daily briefing.
Thank you.
— SeoVereign
Harmonic Patterns
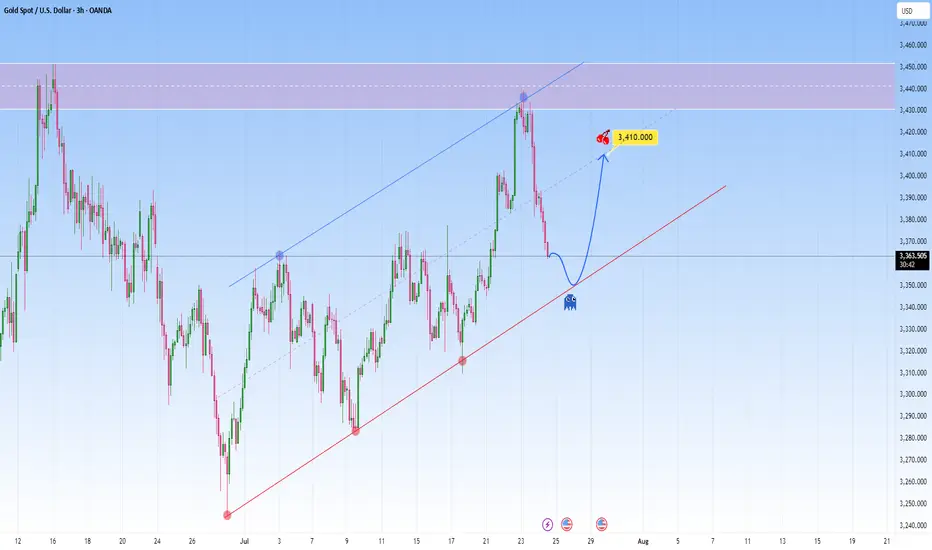
GOLD Reawakened: Corrects firmly but conditions remain bullishFrom a technical perspective Gold is climbing in a parallel channel, clearly bullish with a rhythm that’s hard to ignore. Price just bounced off the resistance with force, a classic overextension flush.
And the market is now approaching the lower boundary of this projected channel. This confluence of technical support is likely to attract renewed buying interest.
I expect it to bounce back toward 3,410, somewhere around the middle of the channel. The move up may not be determined right away. It could be consolitaing, fake dips first, or sudden acceleration.
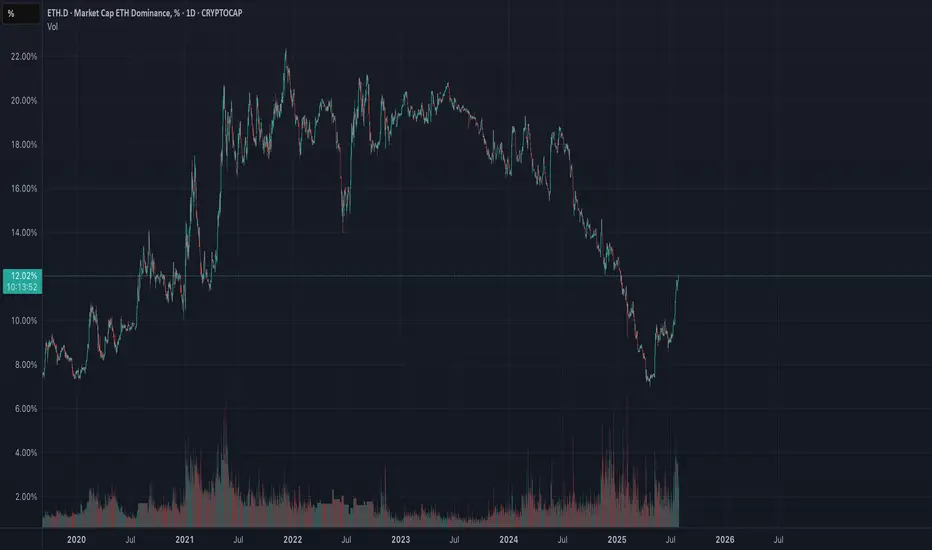
ETH Dominance 1D – Altcoin LeadershipEthereum dominance daily chart. Used to assess ETH leadership and confirm potential altseason trends.
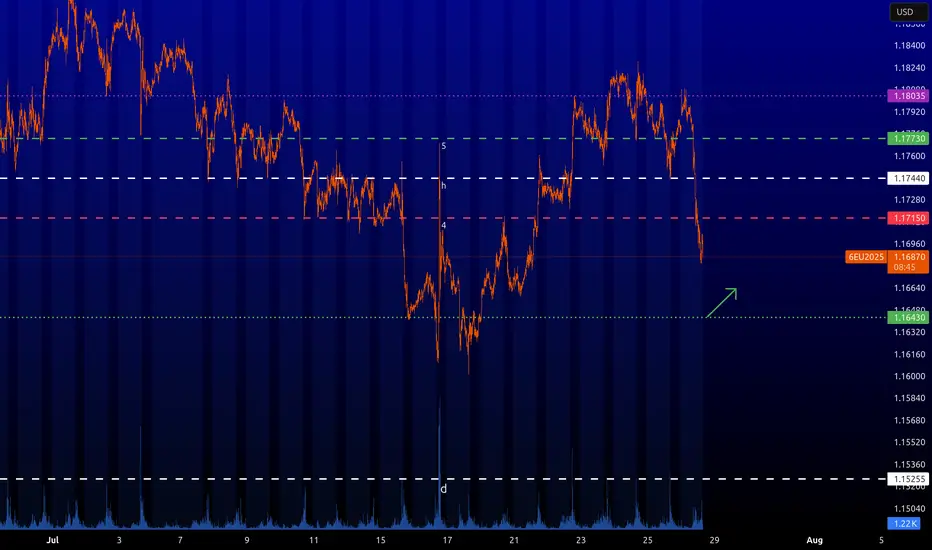
6E : Short-term longGood level for pips or short-term bounces. Careful on volatile news. It is better not to trade in them.
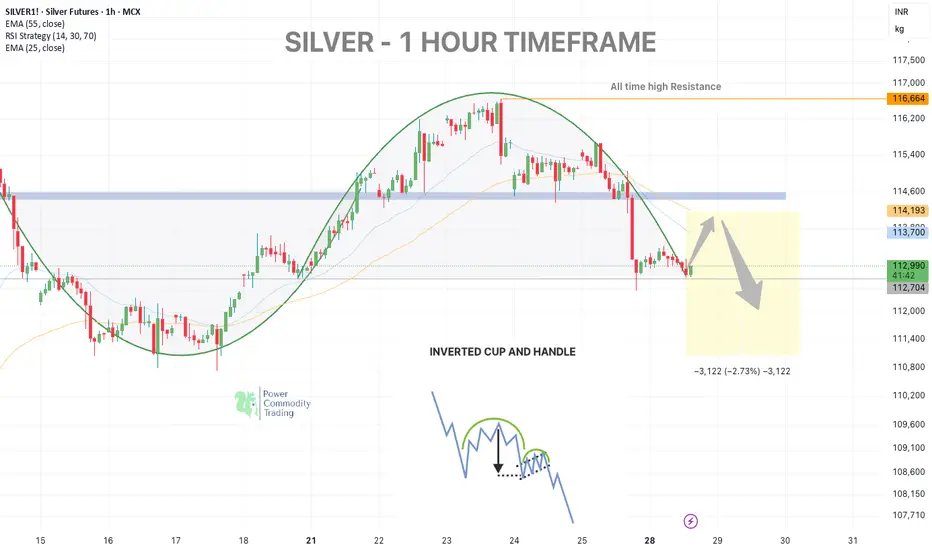
SILVER WEEKLY UPDATE - Dead Cat Bounce Setup📉 SILVER – 1H TIMEFRAME - Inverted cup and handle pattern
Silver tested support around 112,800–113,000 after a rounded top formation, rejecting the key EMA zones (25 & 55) and the previous demand-turned-supply zone.
🟠 Scenario Unfolding:
Expecting a short-term bounce towards 113,750–114,200 (EMA cluster zone) — this could act as a dead cat bounce, offering an opportunity to re-enter shorts.
Confluence Factors:
• Rounded top structure
• EMA resistance
• Weak macro data (Durable Goods Orders down -9.3%)
• Risk-off sentiment supportive of range contraction
🔻 Primary Bias: Bearish Continuation
After the bounce:
• Short Entry Zone: 113,800–114,200
• Target: 111,250
• Risk:Reward ≈ 1:2
⚠️ Invalidation: Sustained close above 114,700 .
📌 Note: Watch price action closely near 114,000 – this is the decision point for the next leg.
#CrudeOil #naturalgas #MCXCrude #PowerOfCommodity #TriangleBreakout #TradingViewIndia #EnergyMarkets #TechnicalAnalysis
Comment below if you think it Will retest then fall?
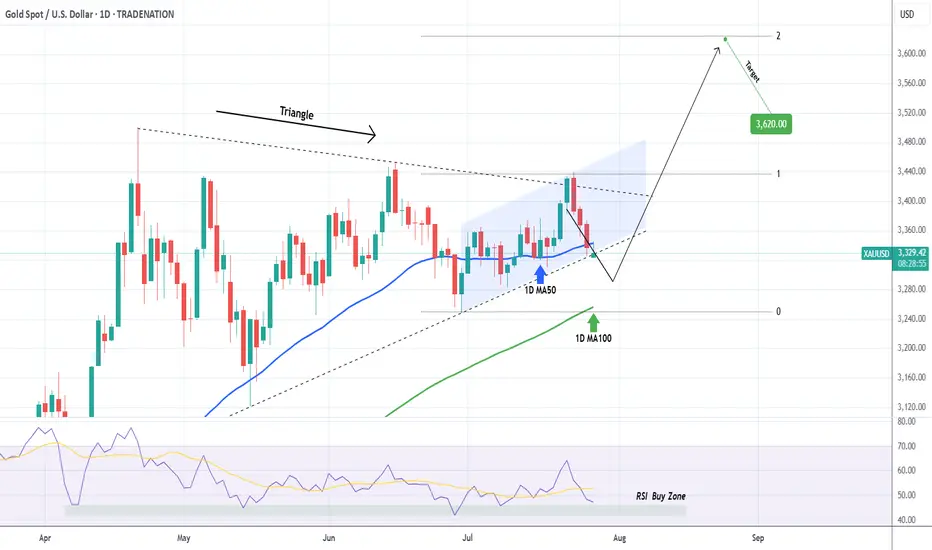
XAUUSD Does it need to test the 1D MA100 first?Gold (XAUUSD) is attempting to break below its Triangle formation just 4 days after marginally breaking above it. This has invalidated that pattern so after breaking also below its 1D MA50 (blue trend-line), it could technically go for a 1D MA100 (green trend-line) test for the first time since January 06 2025.
If it does, there will be more probabilities for a stronger than before rebound to make a new High. Our Targe is the 2.0 Fibonacci extension at $3620.
Keep also an eye on the 1D RSI Buy Zone, which has been giving the most optimal buy signals since April 07 2025.
-------------------------------------------------------------------------------
** Please LIKE 👍, FOLLOW ✅, SHARE 🙌 and COMMENT ✍ if you enjoy this idea! Also share your ideas and charts in the comments section below! This is best way to keep it relevant, support us, keep the content here free and allow the idea to reach as many people as possible. **
-------------------------------------------------------------------------------
Disclosure: I am part of Trade Nation's Influencer program and receive a monthly fee for using their TradingView charts in my analysis.
💸💸💸💸💸💸
👇 👇 👇 👇 👇 👇
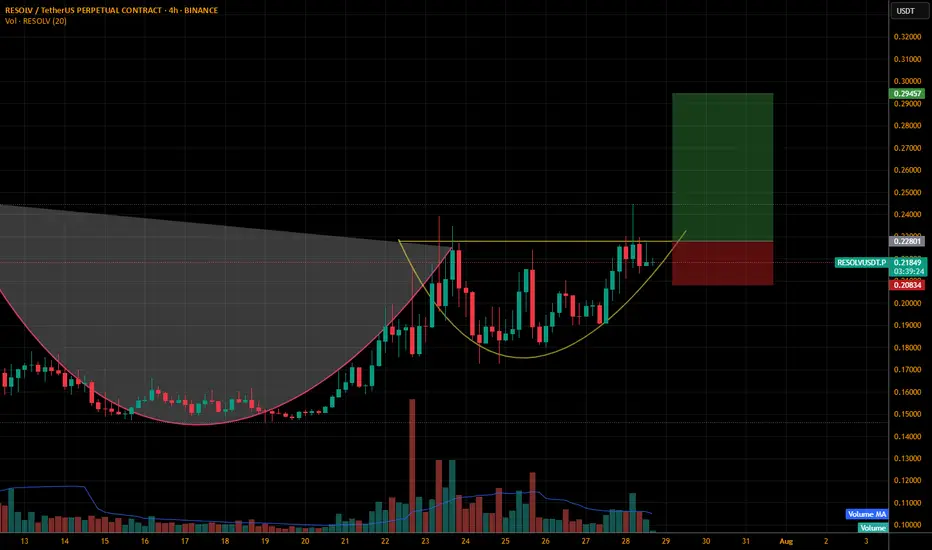
Resolvusdt.p LONGLet the price break through the yellow line with bullish candle and volume with a retest
Only than we will enter in the trade.
Setup has been marked.
DYOR.
Follow me and support me thanks
XAUUSD on critical rangeGold is currently below rising channel also completion on Head& Shoulder on H4 time frame. DXY is recovering on weekly charts.
What's possible scanarios we have?
▪️today's not mych volume had been seen, still my stance are same H4 candle closed above 3345 ,I will be on bullish side till 3370-3380.
▪️Secondly H4 candle closing below 3330 this Parallel moves upside will be invalid and we have targets at 3310 then 3290 on mark.
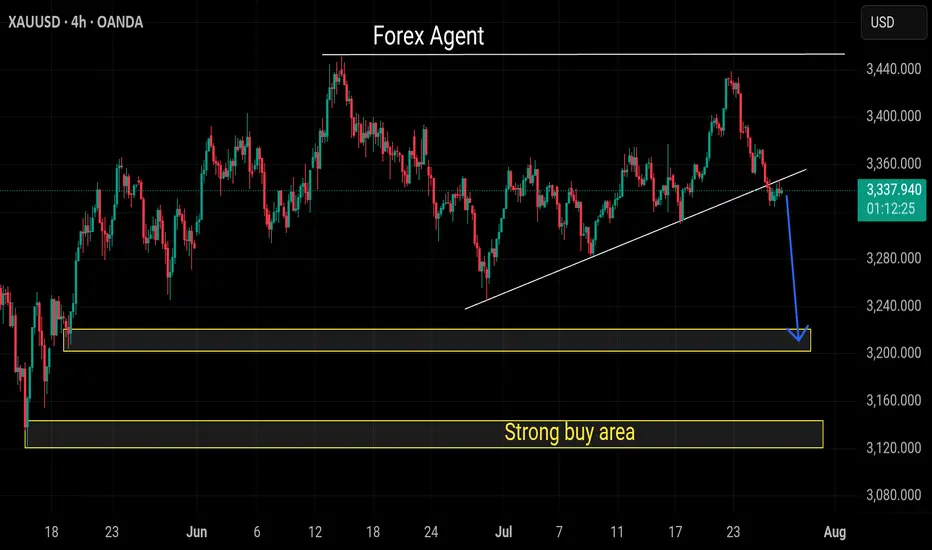
Sell xauusdGold recently breaks it's buy trend and retested it
Now looking for sell on h4 chart
This current level not much good for buyers
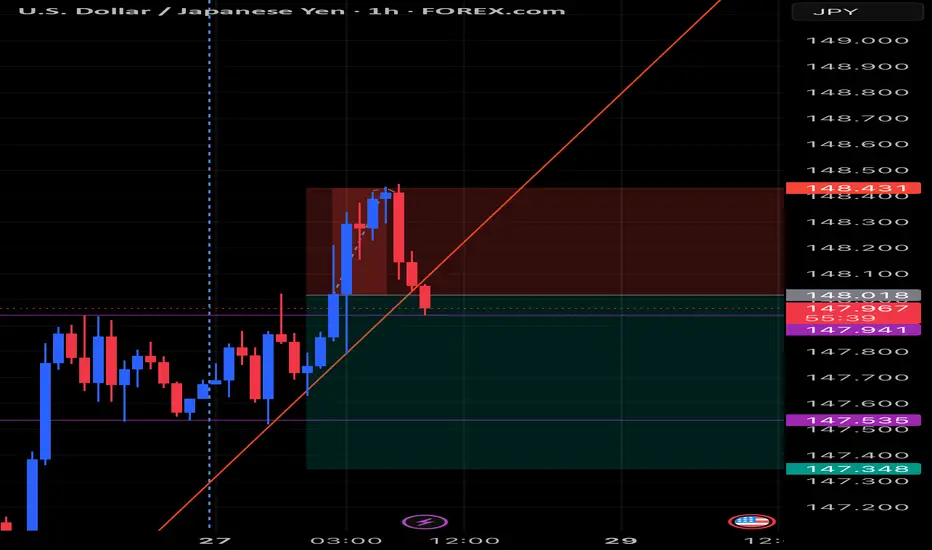
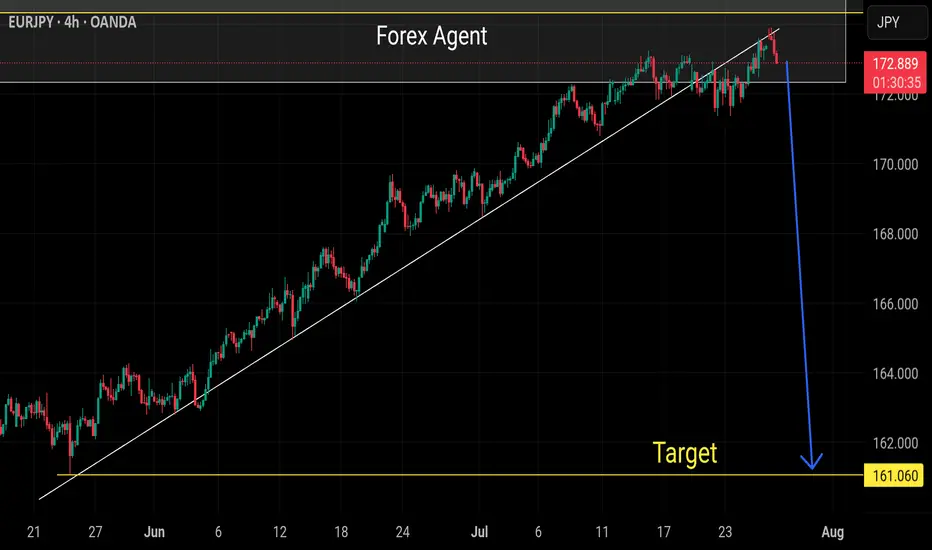
Strong sell eurjpy Big drop now eurjpy as euro gonna weak among all cross pairs
Weekly already overbought
Support trend breakout and retested on H4
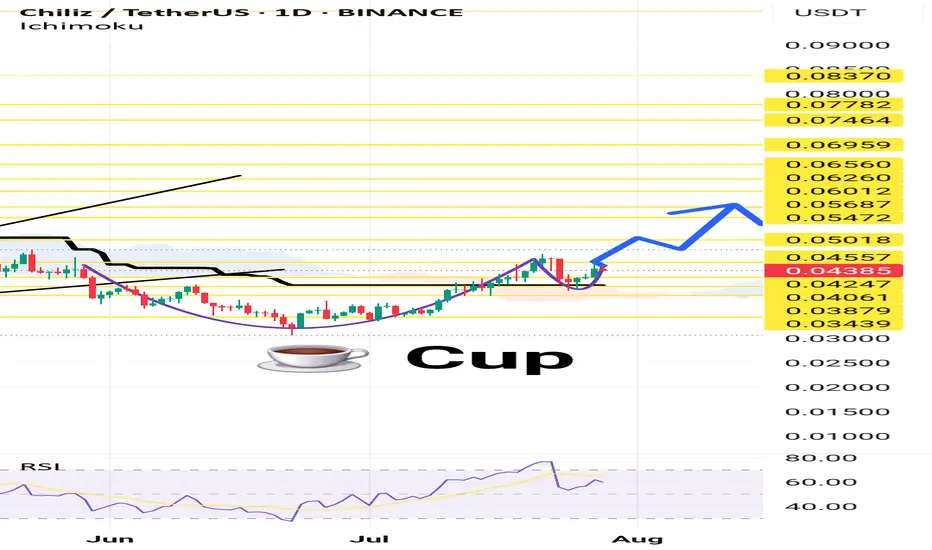
ChilzusdtHello Snipers. On the one-day timeframe, we are witnessing the formation of the Cup pattern or the Cup and Handle pattern, a chart pattern in technical analysis that appears in the form of a cup with a handle on the price chart and is usually considered as a bullish continuation pattern. This pattern indicates a period of price consolidation that forms after an upward trend and is likely to continue its upward trend.
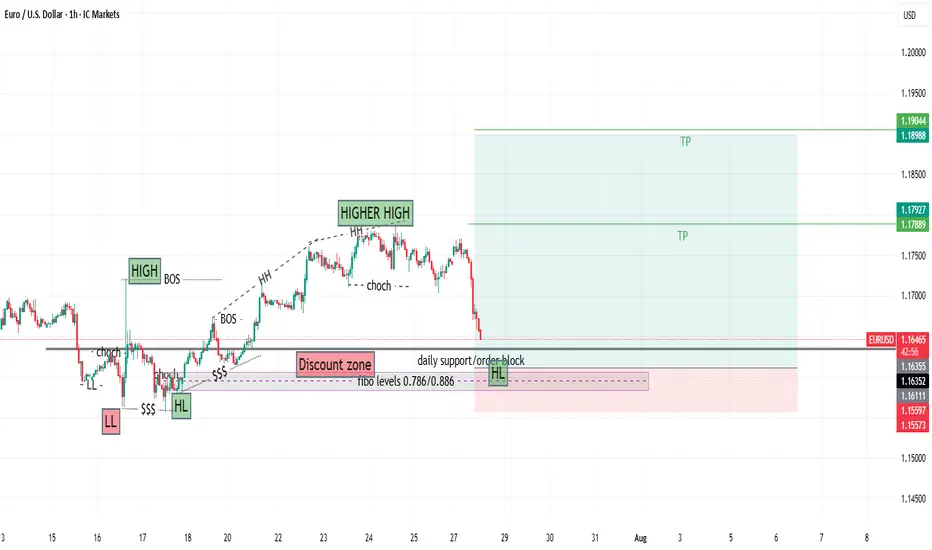
EURUSD Buy Limit Order Opportunity You Can’t MissAnalyzing market structure and liquidity using Price Action and Smart Money Concepts. Focused on key supply/demand zones and institutional order flow
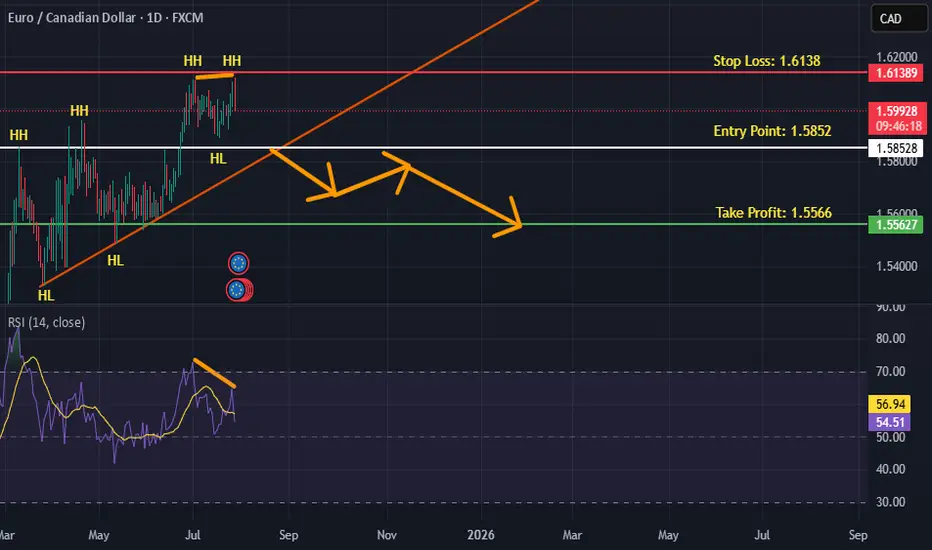
EURCAD is BearishPrice was in a strong uptrend, however now it seems that bulls are exhausted, the notion is further validated by a double top reversal pattern with bearish divergence. If previous higher low is broken with good volume, then we can expect a bearish reversal as per Dow theory. Targets are mentioned on the chart.
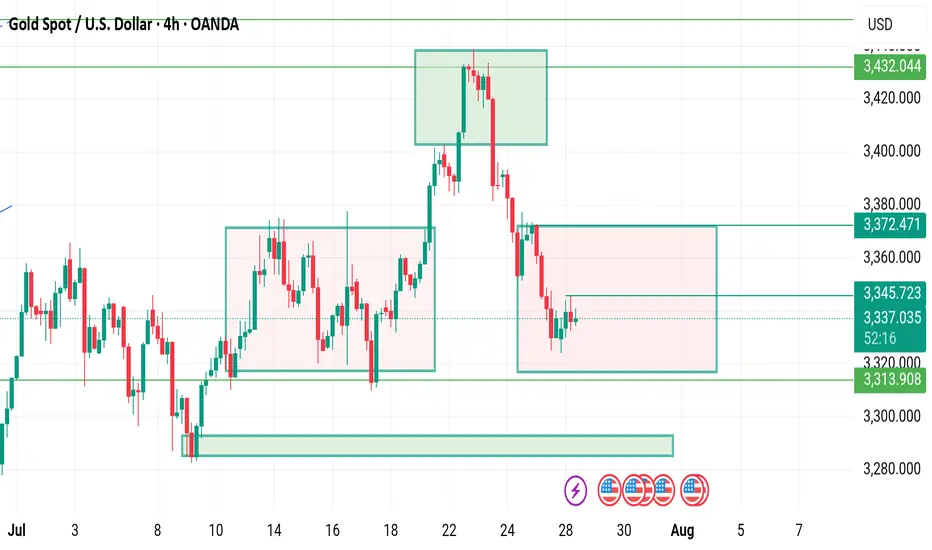
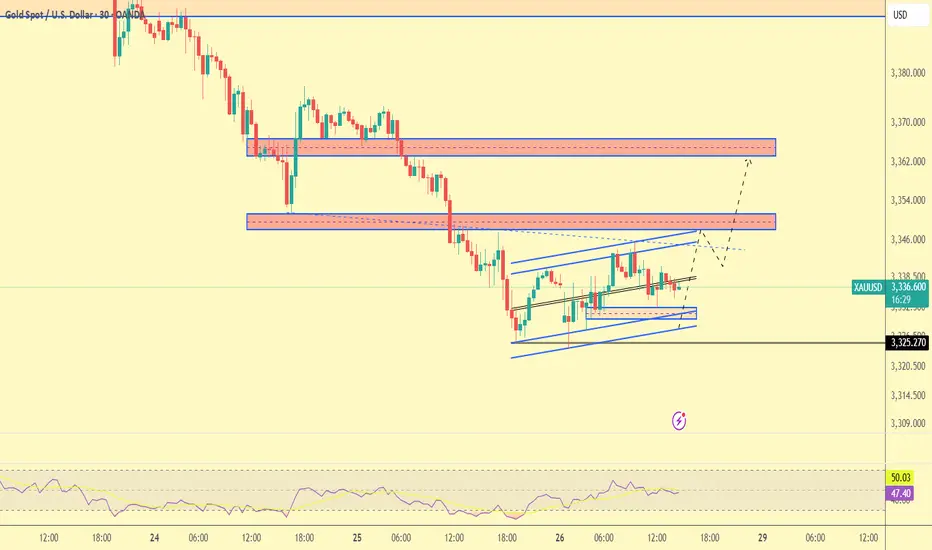
Gold Trade Plan 28/07/2025Dear Trader,
Today, I think the market will move within the range of 3320-3360, given the lack of major news. For now, it is a range-bound area, and my final target for today is around 3352-3360.
regards,
Alireza!
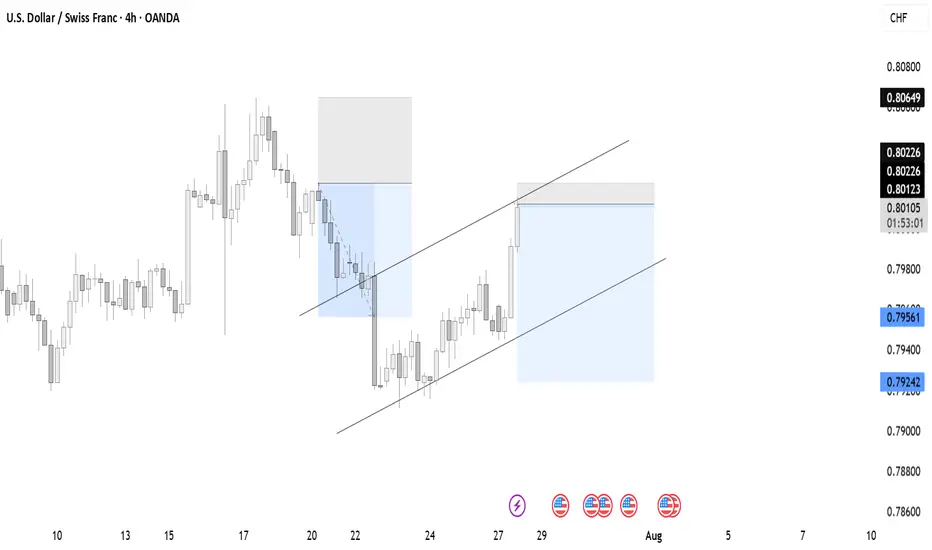
Sell USDCHFA bearish flag has emerged on the 4H chart on USDCHF. We can expect price to short massively this week.
PenguCurrent Situation (as depicted in the image):**
* **Asset:** PENGUINSDPERP PERPETUAL MIX CONTRACT (presumably a cryptocurrency perpetual future).
* **Timeframe:** 4D (4-day candles).
* **Your Position:** You are in a short position, and it looks like you are currently in profit, as indicated by "my short with profit."
* **Your Exit/Take Profit:** The blue line marked "SL" (which is typically Stop Loss, but you've indicated it as your "exit") is at approximately $0.017000.
* **Price Action:** The price has recently experienced a significant upward move, currently trading around $0.043089.
* **Moving Averages/Indicators:** There are several lines that appear to be moving averages or similar indicators (green, light blue, dark blue). The fast VWMA is 45, and the slow RMA is 48.
* **Resistance/Supply Zones:** There are red boxes indicating potential resistance or supply zones. One is currently being tested around $0.043-$0.045. Another lower one was previously breached.
* **Support/Demand Zones:** There's a green box indicating a potential support or demand zone around $0.009-$0.010.
**Trading Idea - Managing Your Current Short Position:**
Given that you're already in a short position and in profit, the key is to manage it effectively.
**1. Re-evaluate Your "Exit" (Blue Line at $0.017000):**
* You've stated the blue line at $0.017000 is your "exit." If this is your **Take Profit (TP) target**, it's quite ambitious given the current price of $0.043089. This would imply a very significant drop.
* If this was originally your **Stop Loss (SL)** for a *previous* long trade that you've now flipped to a short, or if it's a stop-loss for *this* short trade but you misspoke, it's very far below the current price and would mean you'd take a huge loss if the price were to rebound from current levels to that point while you're short.
* **Clarification Needed:** Please clarify if the blue line is your Take Profit for the short, or if it's an old stop loss, or something else. For the purpose of this idea, I will assume it's your *intended Take Profit for the short position.*
**2. Adjusting Your Strategy Based on Current Price Action:**
The price is currently challenging a significant resistance zone. This offers a few possibilities for managing your short:
* **Scenario A: Strict Adherence to Original Plan (Risky if $0.017 is TP):**
* If your target is genuinely $0.017000, you are aiming for a massive drop. This is a high-risk, high-reward strategy.
* **Idea:** Hold your short, but **definitely move your stop-loss down to protect your profits.** Do NOT keep your stop loss above the current price if you are short. Place it just above the current resistance zone (e.g., around $0.047000 - $0.050000) to limit potential losses if the price breaks higher.
* **Scenario B: Partial Profit Taking & Trailing Stop Loss (Recommended):**
* Given the significant run-up and the current resistance, it's prudent to secure some profits.
* **Idea:**
1. **Take Partial Profits Now:** Close a portion of your short position (e.g., 25-50%) at the current price levels ($0.043000 - $0.045000). This locks in some profit immediately.
2. **Move Stop Loss (SL) to Break-Even or Above Entry:** For the remaining portion of your short, move your stop-loss to your original entry price (or slightly above it to guarantee some profit, even if the price reverses completely against you). This creates a "risk-free" trade for the remainder of your position.
3. **Set Trailing Stop Loss:** As the price potentially moves lower (in your favor), continuously trail your stop-loss downwards, maintaining a fixed distance (e.g., based on a percentage, ATR, or previous swing highs). This allows you to capture more of the downside while still protecting profits.
4. **Consider Intermediate Take Profit Targets:** Instead of waiting all the way down to $0.017000, consider setting intermediate take-profit targets at key support levels, such as:
* The top of the previous support zone (around $0.012000 - $0.013000).
* The green demand zone (around $0.009000 - $0.010000).
* **Scenario C: Aggressive Short Re-entry/Adding to Short (Higher Risk):**
* If you strongly believe this is a significant top and the price will reverse sharply, you could consider adding to your short position if you see clear bearish confirmation (e.g., rejection from the current resistance, a bearish engulfing candle, or a break below immediate support).
* **Idea:** Wait for a clear bearish reversal pattern on a lower timeframe (e.g., daily or 12-hour) around the current resistance. If it appears, consider adding a small amount to your short. **Crucially, ensure your overall position size remains manageable, and use a tight stop-loss for this additional entry.**
**Important Considerations:**
* **Risk Management:** Always define your maximum acceptable loss per trade.
* **Position Sizing:** Do not over-leverage.
* **Market Context:** What is the broader market sentiment for cryptocurrencies? Are there any fundamental news events that could impact this asset? (The chart itself doesn't provide this, but it's important to consider).
* **Timeframe Alignment:** Your "exit" at $0.017000 is a long-term target on a 4D chart. Be prepared for potentially long holding times and significant volatility if you're aiming for such a large move.
**In summary, the most prudent approach is likely Scenario B: take some partial profits now, secure your remaining position with a tight stop-loss (at least at break-even), and consider trailing it down as the price moves in your favor. Reaching $0.017000 from current levels would be a substantial move, requiring careful management.**

CHFJPY is BearishPrice was in a strong uptrend, however now it seems that bulls are exhausted, the notion is further validated by a double top reversal pattern with bearish divergence. If previous higher low is broken with good volume, then we can expect a bearish reversal as per Dow theory. Targets are mentioned on the chart.

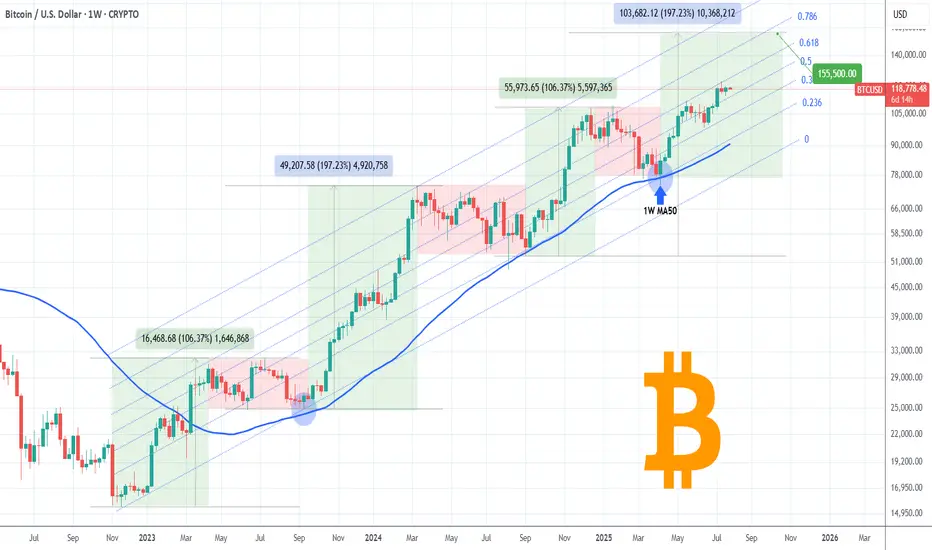
BITCOIN One last rally left in the tank?Bitcoin (BTCUSD) has been on a non-stop rally following the April 07 2025 rebound on its 1W MA50 (blue trend-line). Being inside a 3-year Channel Up since the November 2022 market bottom, that was the second time it rebounded on the 0.236 Channel Fibonacci level.
The previous one was during the last Bullish Leg, which was a +106.37% rise, absolutely symmetrical with the Channel's first such Leg in late 2022 - most of 2023.
If the September 2024 (Higher Low) on the 1W MA50 was the start however of a greater expansion Leg similar to late 2023 - early 2024, which delivered a +197.23% rise, we can claim that by October we may see it peaking at around $155500.
That seems to agree with the majority of Cycle Top models we have come up after many analyses. Do you think that will be the case? Feel free to let us know in the comments section below!
-------------------------------------------------------------------------------
** Please LIKE 👍, FOLLOW ✅, SHARE 🙌 and COMMENT ✍ if you enjoy this idea! Also share your ideas and charts in the comments section below! This is best way to keep it relevant, support us, keep the content here free and allow the idea to reach as many people as possible. **
-------------------------------------------------------------------------------
💸💸💸💸💸💸
👇 👇 👇 👇 👇 👇
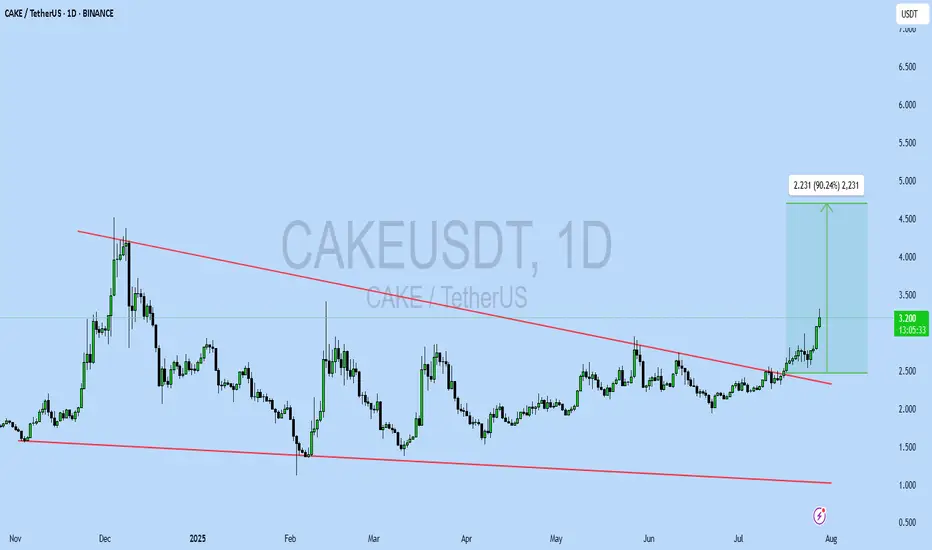
CAKEUSDT UPDATE
Pattern: Falling Wedge Breakout
Current Price: \$3.199
Target Price: \$4.50
Target % Gain: 90.24%
Technical Analysis: CAKE has broken out of a long-term falling wedge on the daily chart, supported by strong bullish candles and increased volume. Price has cleanly closed above trendline resistance, indicating potential continuation toward \$4.50.
Time Frame: 1D
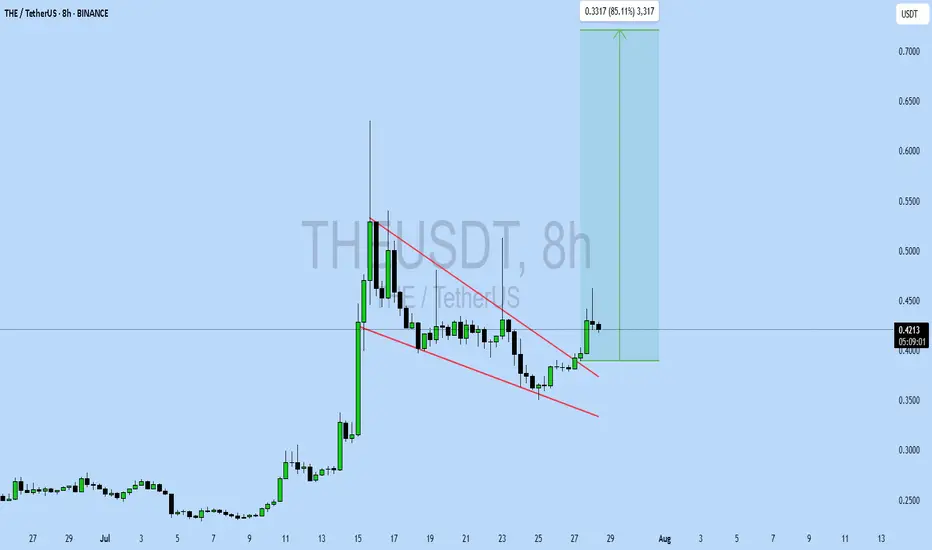
THEUSDT UPDATE
Pattern: Falling Wedge Breakout
Current Price: \$0.4219
Target Price: \$0.75
Target % Gain: 85.11%
Technical Analysis: THE broke out of a falling wedge pattern on the 8H chart with strong bullish momentum. The breakout is backed by consistent higher lows and a volume uptick, indicating strength and potential continuation.
Time Frame: 8H
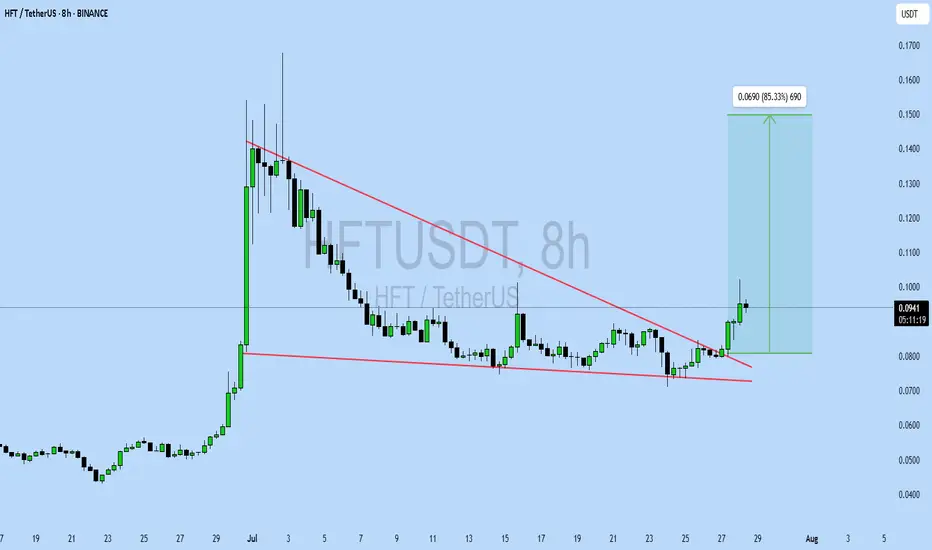
HFTUSDT UPDATE
Pattern: Falling Wedge Breakout
Current Price: \$0.0940
Target Price: \$0.1630
Target % Gain: 85.33%
Technical Analysis: HFT has broken out of a falling wedge on the 8H chart with strong bullish candles. Volume confirms the breakout, and the move above resistance suggests a potential rally toward the 85% target zone.
Time Frame: 8H
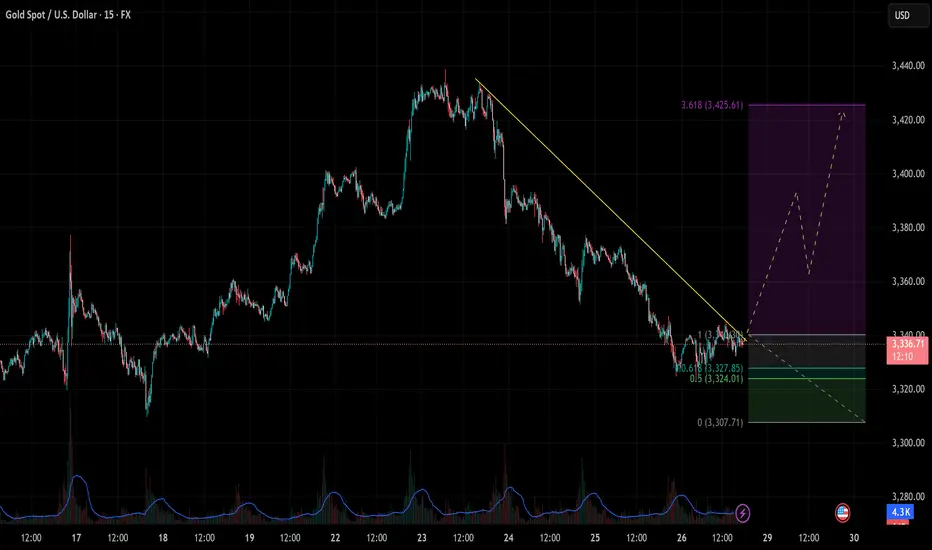
[XAUUSD] Reversal Signals from Key Support As of the July 28–29 trading sessions, the XAUUSD 15-minute chart is showing early signs of a bullish reversal, with price reacting strongly at a key Fibonacci support zone and breaking through a descending trendline.
1. Price Action and Technical Structure
After a prolonged downtrend from the 3,430 zone, gold found support at the 0.618 Fibonacci retracement (3,327.85), aligning closely with the horizontal support at 3,324 – 3,327.
A descending trendline has been breached, signaling a potential breakout setup.
A potential ZigZag corrective wave structure is forming, hinting at the beginning of a new bullish swing.
2. Fibonacci Extension & Upside Targets
The Fibonacci extension tool suggests a possible rally toward the 3.618 extension at 3,425.
This level marks the next major upside target if the breakout holds.
3. Key Price Levels
Price Zone
Technical Significance: 3,327 – 3,324 Major support zone (Fib 0.618 + horizontal support)
3,350 – 3,355 First reaction zone / interim resistance
3,380 – 3,400 Strong resistance zone
3,425 Final target – 3.618 Fib extension
4. Suggested Trading Strategy
Long Setup – Breakout & Reversal Confirmation
Entry: 3,328 – 3,332 (after bullish confirmation above trendline and support)
Stop Loss: Below 3,320 (beneath local swing low)
Take Profit: 3,355 → 3,380 → 3,425 (scaling out by zone)
Bearish Continuation Scenario
If price drops below 3,320 and breaks 3,307 support, the bullish outlook is invalidated, and a retest of deeper levels is likely.
5. Volume and Confirmation Cues
Volume has started to pick up as price tests the breakout zone – indicating that buying pressure may be returning.
Wait for a strong bullish candle with volume above average before committing to the trade.
Gold is approaching a critical inflection point, and bulls may regain control from this confluence support zone. Stay alert for a breakout confirmation. Save this idea if you find it helpful and follow for more high-probability strategies!