People pay for this!!!If you are a beginner trader struggling with entries then this video is for you.
Harmonic Patterns

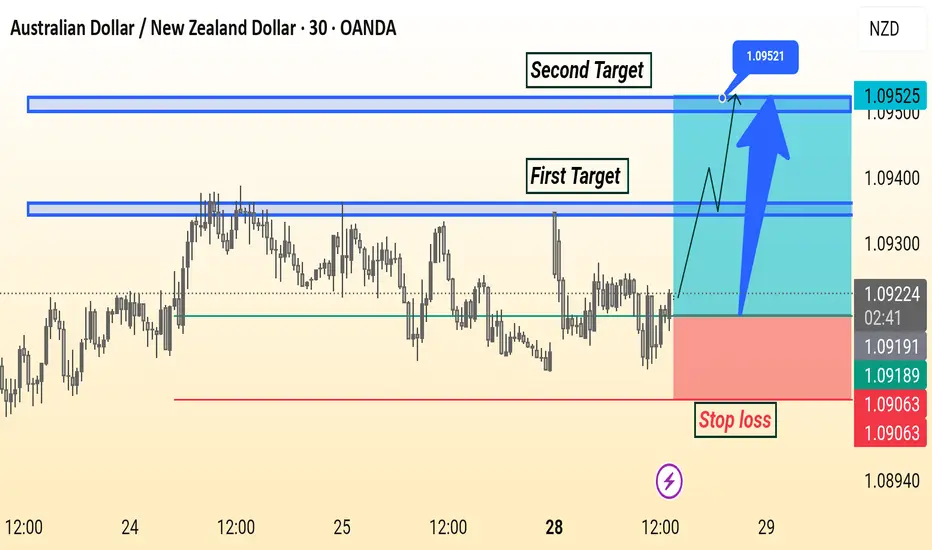
AUD/NZD Analysis is Ready Move Will Be Fly This AUD/NZD 30-minute chart shows a bullish setup with entry around 1.09216. The first target is near 1.09400 and the second target is at 1.09521. A stop loss is placed below support at 1.09063. The analysis suggests a potential upward move after a breakout.
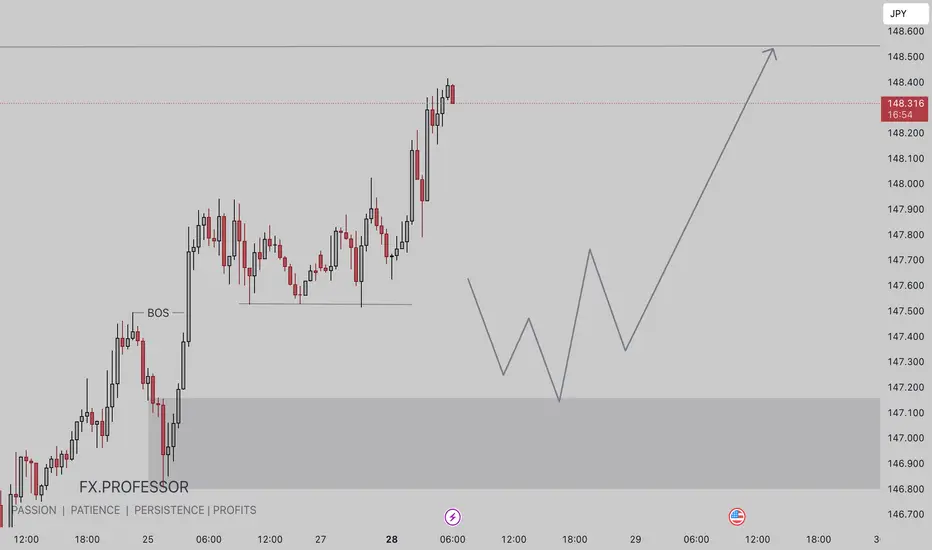
USDJPY TRADE IDEA💴 USD/JPY Smart Money Outlook – July 28, 2025
🔍 Technical Breakdown:
• Market Structure:
• A strong Break of Structure (BOS) is already printed, confirming bullish intent.
• Price has created a clean internal range, likely to engineer liquidity before continuation.
• Key Zones Identified:
• Demand zone marked around 146.90 – 147.20. This is where institutional orders are anticipated.
• Price is currently near short-term highs (~148.38), where liquidity is likely being built.
• Expected Scenario:
• Anticipate a retracement back into the demand zone (gray box) for a low-risk buy entry.
• Bullish continuation is projected toward the 148.60+ region, breaking above current highs.
• Smart Money Flow Logic:
• BOS confirms bullish bias → Pullback to demand → Entry after liquidity sweep → Continuation toward new highs.
🧠 Smart Money Narrative:
1. Internal liquidity buildup just above BOS zone.
2. Price is likely to retest demand before institutional buyers re-enter.
3. Ideal entry after a sweep, with confirmation on lower timeframe.
4. Targeting external liquidity above 148.60 zone.
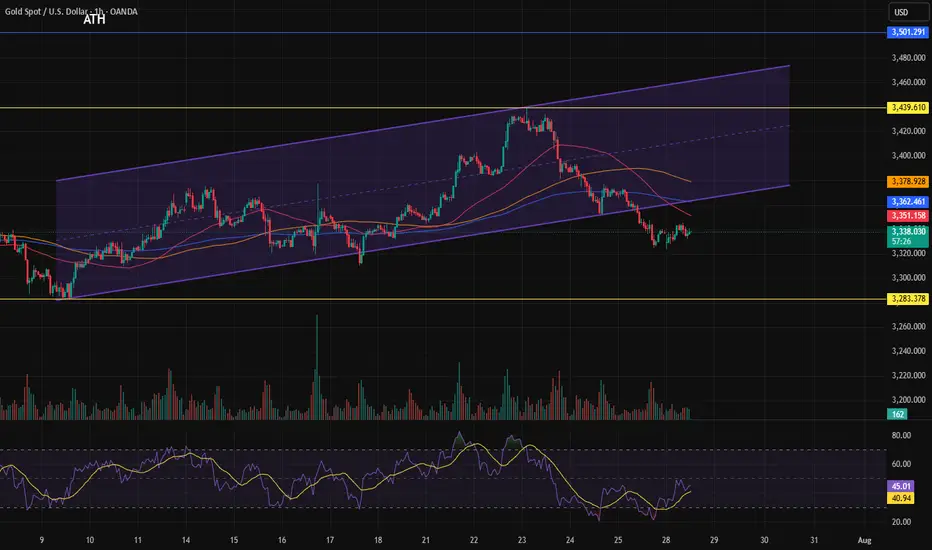
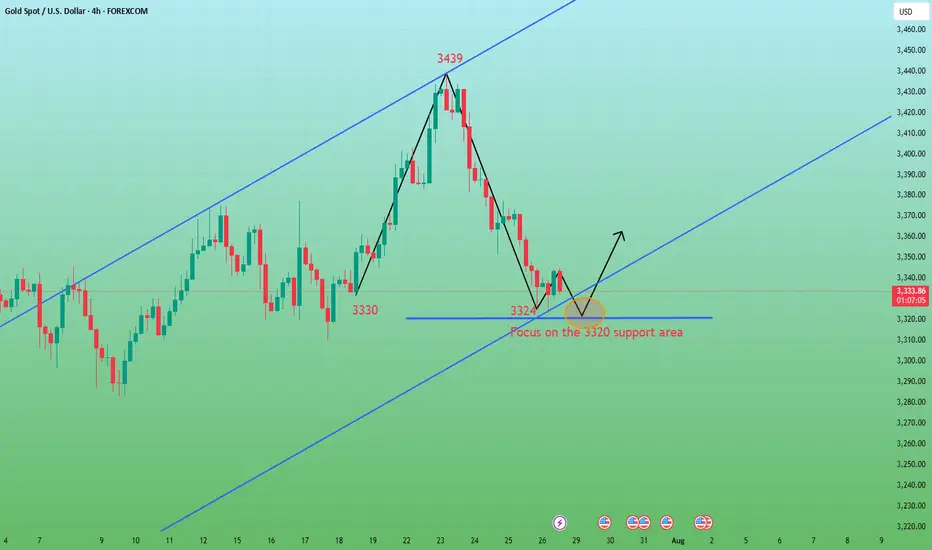
Close to the bottom of the channel.Gold is approaching the bottom of the channel.
As mentioned in the previous analysis, due to the channel breakout, there's a possibility that the price could reach the bottom of the channel in the larger cycle.
GOLD BUY TRADE IDEA • Price Action Context:
• Recent bearish leg shows a clear shift from premium to discount territory.
• Market is approaching a higher timeframe demand zone around $3,277 – $3,299 (highlighted red zone).
• Notable inducement below recent lows suggests engineered liquidity to fuel a potential reversal.
• Current Market Structure:
• After a deep retracement, price is expected to tap into the discount zone, where institutional buy orders may be resting.
• Anticipated bullish reaction following a liquidity sweep of the lows and demand mitigation.
• Smart Money Flow:
• Inducement ➝ Liquidity Grab ➝ Demand Tap ➝ Bullish Reaction setup in play.
• Internal structure likely to shift bullish after a sweep, potentially forming a higher low and aiming for a BOS (Break of Structure) on the upside.
• Upside Target:
• Short-term target area: $3,360 – $3,380.
• Possible continuation toward premium if internal structure confirms strength.
🧠 Smart Money Narrative:
1. Induced sell-off below structure for liquidity collection.
2. Approaching major POI (Point of Interest) in discount.
3. Anticipated entry point for institutions to buy gold at value.
4. Reversal expected toward premium imbalance areas.

GBP/CAD Analysis Is Ready Move Will Be FlyThis is a bullish trade setup for GBP/CAD on the 1-hour chart. Price is expected to rise from the current level (1.84177) after bouncing from a support zone. The chart shows two potential take profit levels:
TP1 at 1.84534
TP2 at 1.84914
Final target is 1.85278, with a stop loss placed below support at 1.83684. Arrows suggest possible upward price movements

A news-packed week.In this week, which could be considered the most news-packed week of the year, anything can happen. Due to the strength of the news, there's a high possibility that many of our analyses might fail, while many targets could also be hit.
GBPUSD - GBPJPY - USDJPY Trade Recaps 28.07.25Three positions taken last week. Some vital findings within my self-review process which showed a stop loss error with GBJPY causing me to miss a solid 4% trade, and a manual close on GBPUSD to bank a little extra profit.
Full explanation as to why I executed on these positions and the management plan with both.
Any questions you have just drop them below 👇

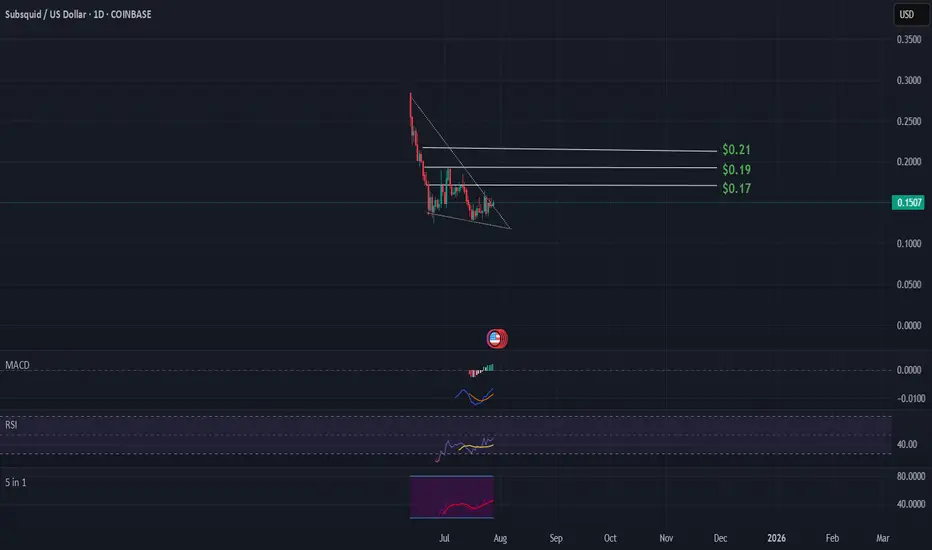
SQD Subsquid altcoinSQD Subsquid trading on big exchanges
104 million marketcap, growing volume.
Next resistance $0.17, $0.19, $0.21
Rsi = bullish
Stoch Rsi = bullish
Macd = bullish
#crypto #cryptocurrency #altcoins
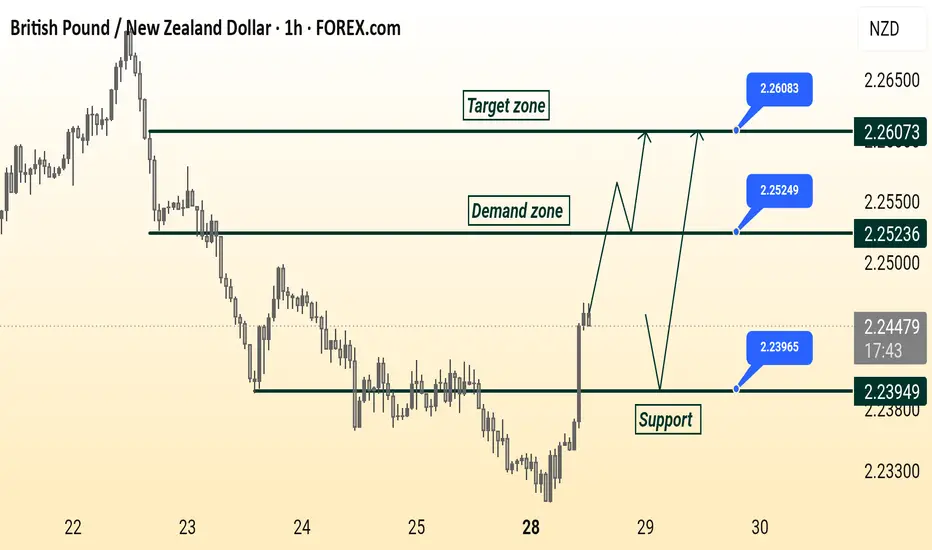
GBP/ NZD Ready Read The Captions This 1-hour chart analysis of GBP/NZD highlights key trading zones:
Support level: 2.23949
Demand zone: 2.25236
Target zone: 2.26073
The price is currently rising from support and approaching the demand zone. Two possible scenarios are shown: a breakout toward the target zone or a pullback to the support before a new upward attempt.
H100 Group Raises SEK 109M to Expand Bitcoin Treasury StrategyIn a bold vote of confidence for digital assets, Swedish investment firm H100 Group has successfully raised SEK 109 million (approximately $10.2 million USD) to expand its Bitcoin treasury strategy, joining a growing cadre of companies leveraging BTC as a core long-term asset.
The capital raise, led by Nordic institutional investors and several strategic family offices, marks the second round of treasury-focused fundraising by H100 in less than 18 months. The firm has already allocated more than 1,300 BTC to its balance sheet since Q1 2024—now aiming to double that exposure over the next 12 months.
Institutionalizing Bitcoin Holdings
Unlike earlier corporate adopters of Bitcoin who emphasized defensive hedging against fiat devaluation, H100 Group frames its BTC allocation as a forward-looking capital optimization strategy.
“Our focus isn’t on hedging inflation—it’s on positioning for structural monetary transformation,” said Henrik Larsson, CEO of H100 Group. “We believe Bitcoin is not just a store of value, but a sovereign-free liquidity reserve for a new financial paradigm.”
Larsson added that Bitcoin offers asymmetric upside relative to traditional risk-adjusted asset classes and is increasingly relevant as macro correlations shift in a post-rate-hike global economy.
Nordic Appetite for Crypto Exposure
The raise underscores growing appetite for crypto asset exposure among Nordic investors, who are traditionally conservative but increasingly open to alternative asset classes amid global uncertainty. According to data from the Stockholm Blockchain Association, institutional allocations into digital assets in Sweden have grown by 63% year-over-year.
H100’s model also differs from U.S.-based firms like MicroStrategy in that it pairs BTC holdings with structured hedging instruments, including futures and options overlays to reduce downside volatility.
Strategic Expansion and Custody Infrastructure
A portion of the newly raised funds will be allocated to enhancing H100’s custody and compliance infrastructure. The firm is reportedly in advanced talks with Anchorage Digital and a local fintech consortium to build a regulated BTC trust structure, enabling third-party investors to co-invest alongside H100’s balance sheet.
This move aims to convert the treasury approach into an institutional investment vehicle, opening doors to pension funds and family offices seeking exposure without direct custody risks.
Looking Ahead
As more companies globally begin to treat Bitcoin as a strategic treasury reserve—not a speculative asset—H100 Group is positioning itself at the frontier of this financial shift. With capital in hand, institutional backing, and a regulatory-first approach, the firm may soon become a Nordic benchmark for corporate Bitcoin adoption.
In Larsson’s words: “The future belongs to balance sheets that evolve. We’re not just holding Bitcoin—we’re building around it.”
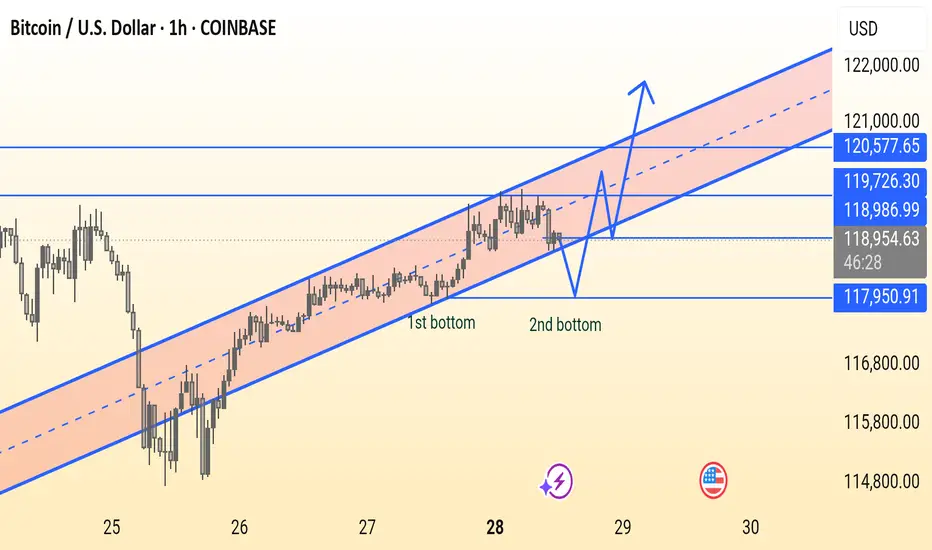
BTC/USD Double Bottom Forming in Uptrend ChannelThis BTC/USD 1-hour chart shows Bitcoin trading in an ascending channel, forming a potential double bottom near support around $118,950. A breakout above $118,986 could lead to a bullish move toward $120,577. Key support lies at $117,950 — holding this level is crucial for bullish continuation.
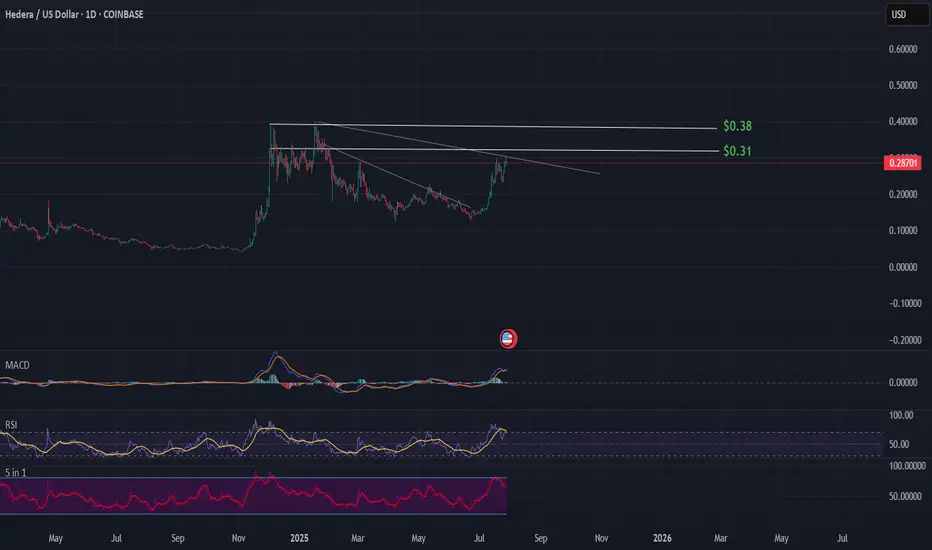
HBAR movement up?Hbar gains loading
Current price $0.28
Next resistance $0.31 and $0.38
Rsi = Avg bullish
Stoch rsi = Avg bullish
Macd = Avg bullish
$300M Bitcoin Options Play by Trump Media Sparks DebateIn a surprising and bold move, Trump Media & Technology Group (TMTG), the company behind the social media platform Truth Social, has announced a $300 million investment in Bitcoin options. The decision has stirred strong market reactions and raised concerns among analysts and regulators about potential conflicts of interest.
According to sources close to the company, the investment is structured through derivatives contracts, focusing on long-term option positions, signaling TMTG’s confidence in Bitcoin’s future price appreciation. The move comes amid growing institutional interest in digital assets and reflects the company’s broader vision of “financial decentralization” and independence from traditional platforms.
However, critics are pointing to a potential conflict of interest. Donald Trump, the face of the company and a highly visible political figure, has previously voiced strong opposition to cryptocurrencies, calling them “fraudulent” and “dangerous.” Now, the very company in which he holds a substantial stake is investing heavily in the asset he once condemned. This contradiction has raised questions about transparency, underlying motives, and the possible use of corporate decisions for political or personal gain.
Financial analysts are split on the matter. Some view the investment as a diversification strategy and a hedge against market uncertainty. Others argue it adds unnecessary risk to a company with an already volatile business model, especially considering its recent public listing via a SPAC merger. The impact on the firm’s financial statements remains to be seen, particularly as the valuation of crypto assets fluctuates rapidly.
From a regulatory perspective, the situation may escalate. The U.S. Securities and Exchange Commission (SEC) has already shown interest in TMTG’s activities, and further scrutiny could follow if political influence over investment strategies becomes evident.
Despite the risks, markets initially reacted positively. Shares of Digital World Acquisition Corp — the SPAC partner of TMTG — saw a short-term spike following the investment news. This suggests that investors, while aware of the uncertainties, remain intrigued by the company’s aggressive posture toward emerging financial technologies.
Ultimately, Trump Media’s Bitcoin investment could be seen as a pivot toward the digital economy. However, given Donald Trump’s increasing political activity and his central role in the 2024 election cycle, this move requires close monitoring by investors and regulators alike. Whether it represents visionary strategy or political entanglement remains to be seen.
Solana (SOL) Revs Up Again — Fresh Breakout Above $200 in Sight?After months of consolidation, Solana (SOL) is once again showing signs of bullish momentum, trading near $176 and rapidly approaching a potential breakout level of $200. Investors and analysts alike are paying close attention, as on-chain activity and ecosystem development provide a compelling case for a renewed upward trajectory.
With growing demand for high-throughput blockchain infrastructure and new institutional integrations, Solana is positioning itself as more than just an Ethereum alternative—it’s emerging as a core infrastructure layer for high-performance Web3 applications.
Institutional Momentum Gathers Pace
In the last three weeks, several high-profile announcements have bolstered confidence in the Solana ecosystem. Fidelity Digital Assets revealed it is piloting tokenized bond products on Solana’s network, citing its fast settlement time and composability.
Meanwhile, Visa expanded its USDC settlement pilot on Solana across five countries, reinforcing the blockchain’s real-world financial use cases.
“Solana is no longer just retail-driven,” said Karla Nunez, digital asset strategist at ApexBridge. “Institutions are beginning to build directly on it—and that changes the dynamic.”
Ecosystem Growth and Developer Activity
The number of active developers on Solana has surged 38% quarter-over-quarter, according to Electric Capital’s Developer Report. Projects in DeFi, gaming, and NFTs continue to attract users, helped by extremely low transaction costs and sub-second finality.
Notably, the Solana Foundation recently launched a $100 million grant fund for AI-integrated crypto applications, which could catalyze the next wave of user adoption.
Technical Indicators Support Breakout Narrative
SOL has outperformed major altcoins this month, rising 21% in July. The token is now trading above its 50-day and 100-day moving averages, and momentum indicators suggest a potential breakout above the key psychological barrier at $200.
A confirmed break would likely open the door to $240–$260, with minimal historical resistance in that zone.
Macro Factors Provide Tailwind
The broader crypto market is recovering as inflation metrics cool and expectations for central bank easing rise. Solana, with its high beta to market movements, often leads altcoin rallies during bullish pivots.
Furthermore, the recent dip in Ethereum gas prices has had limited impact on Solana’s user base, suggesting its appeal is increasingly based on performance, not cost arbitrage.
Conclusion
While risks remain—from network outages to broader market volatility—Solana’s resurgence appears fundamentally supported. With institutional interest rising, technical signals aligning, and ecosystem momentum building, a clean break above $200 could mark the beginning of a new cycle for SOL.
For investors seeking exposure to high-speed smart contract platforms with real-world traction, Solana may be nearing another defining moment.

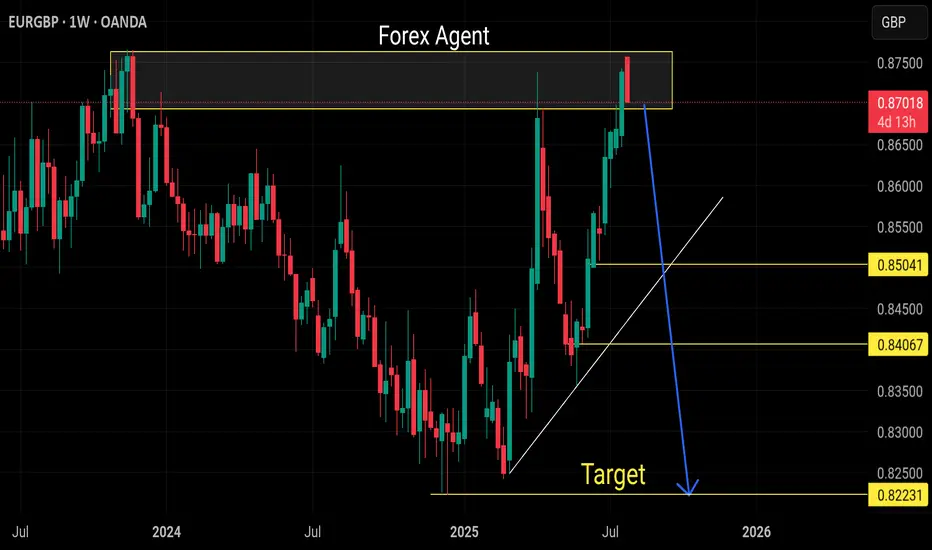
Sell eurgbpStrong sell expected as euro ready to weak across all cross pairs
Weekly daily overbought pair
Ready for the bearish correction
After continuous decline, oversold rebound opportunity.Last week, gold showed a trend of rising and falling. The weekly line closed with an inverted hammer and a long upper shadow, continuing the cross-line pattern of the previous week. The short-term rise was obviously blocked. Although the trend line connecting the daily lows of 3247-3282-3309 has been substantially broken, it may continue to fall after testing and sorting. In the short term, we need to focus on the 3348 suppression level and the 3324 support level. If they fall below, they may fall to the 3300/3285 support area. From the current trend, the overall bearish and lack of rebound momentum, the weak pattern may continue, and only when the price falls to a specific position to complete the bottoming will it attract entry.
Therefore, it is recommended to maintain a bearish mindset. The hourly line shows that the long and short conversions are relatively frequent. The upward trend channel was maintained in the first three days, but all gains were given up in the next two days and the downward channel was rebuilt. Given that both the 4-hour and daily lines have fallen below the key support level, 3348 has become the key point for today's bearishness, and it is necessary to change the mindset in time and go short.
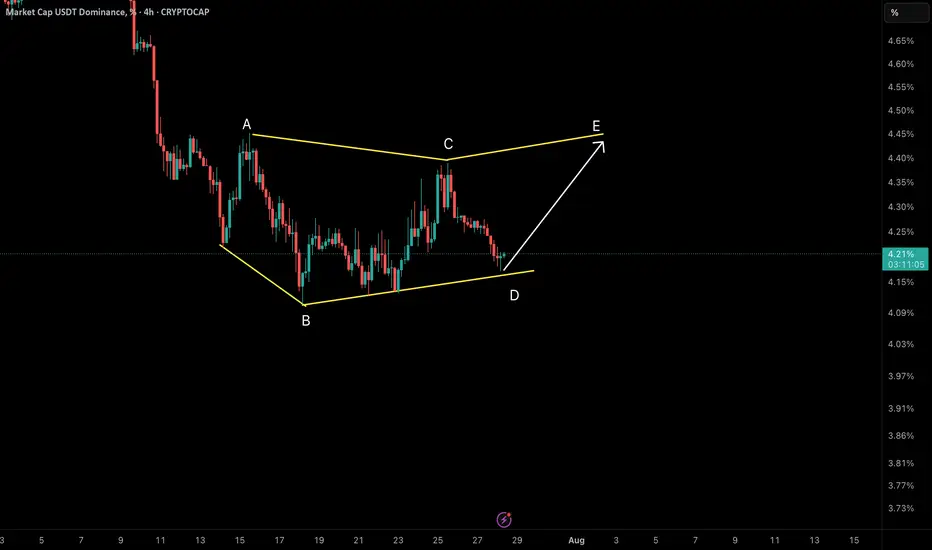
NeoWave Analysis – USDT Dominance (4H Timeframe)We are currently observing a Symmetrical Diametric correction pattern unfolding in the USDT Dominance chart. The wave structure labeled A–B–C–D–E shows clear evidence of this complex formation.
✅ Reasons for Diametric Labeling:
• Wave A and B initiated the pattern with a sharp drop (A), followed by wave B extending lower than A’s starting point – an early sign of a non-classical corrective structure.
• Waves C and D developed with alternating strength and duration, reflecting the expanding and contracting rhythm typical of diametric formations.
• Time and Price Alternation between segments is clearly visible, especially the extended duration between waves B and D compared to the earlier legs.
• The current price action is sitting right at the D wave bottom, which acts as a key structural support zone.
🔄 What’s Next?
• From this support, we expect wave E to initiate. In symmetrical diametrics, wave E typically reaches or slightly exceeds the top of wave C.
• A break below the D wave low doesn’t immediately invalidate the diametric scenario but may call for a re-evaluation toward an Expanded or Terminal Diametric.
• Confirmation of wave E may come with a bullish BOS (Break of Structure) on lower timeframes.
📌 Conclusion: We are likely at the early stage of wave E. If this interpretation holds, a bullish move should develop soon.
📡 Analysis by CryptoPilot – navigating the market with precision.
#CryptoPilot #USDT.D #Elliot #NeoWave #MarketStructure #TrendChannel #BOS #Altcoins #CryptoTrading
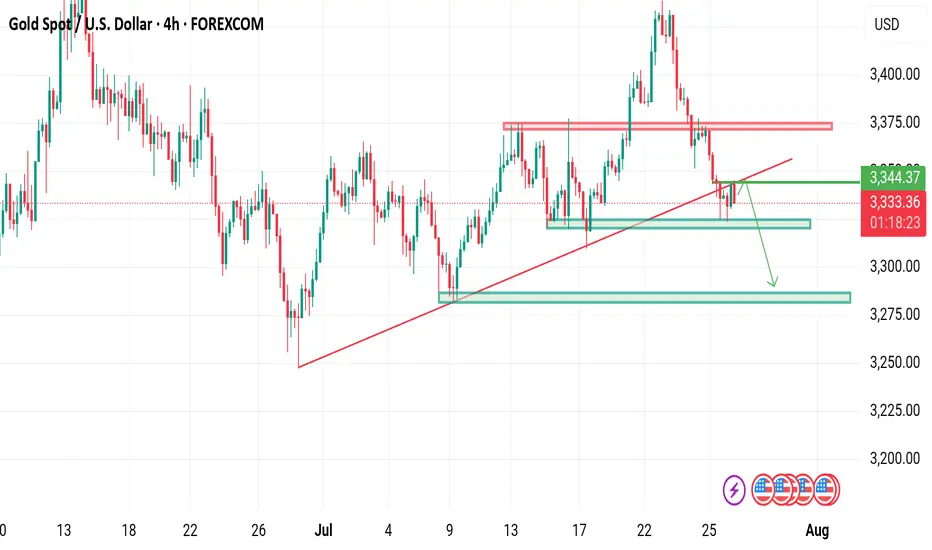
XAUUSD below trend Gold is currently below rising channel
What's possible scanarios we have?
▪️if H4 closed above 3345 ,I will be on bullish side till 3370-3380.
▪️if H4 candle closing below 3330 this Parallel moves upside will be invalid and we have targets at 3290 on mark I'm expecting selling move
#XAUUSD
Is it a time for BlackBerry? Potential 30% profit - 5.20 USD
The analysis of the BlackBerry Limited (BB) chart suggests a potential price increase to the 5.20 USD level. The current price is approximately 3.91 USD, and the chart shows a recent bounce from support in the 3.70-3.80 USD range, which may indicate the start of a new upward trend. The moving averages (MA) point to a previous upward impulse, and the current levels could serve as a launchpad for further growth. If demand holds, the price may break through the resistance around 4.50 USD and head toward 5.20 USD, aligning with previous peaks. However, it’s important to monitor volume and the reaction at the 4.50 USD level to confirm the trend's strength. Additionally, in 2025, there have been speculations about the brand’s potential return to the mobile market with new smartphones featuring physical QWERTY keyboards and modern features such as AMOLED screens, 12 GB RAM, and 5G connectivity, sparking interest and hope among fans (information from March 2025). Furthermore, recent data indicates a rise in stock performance, with the price reaching 7.53 USD, reflecting a 36.66% increase since the beginning of the year (as of February 12, 2025).
Potential TP: 5.20 $

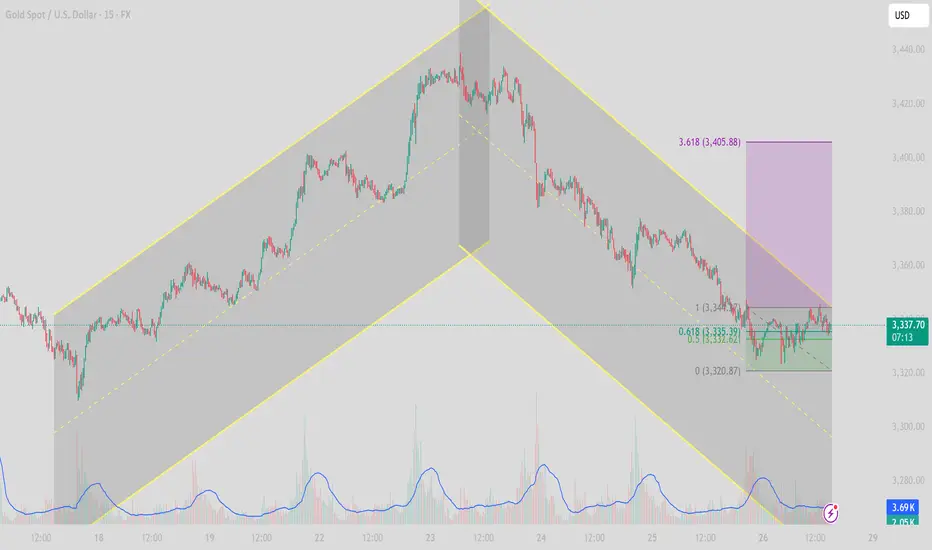
[XAUUSD] Gold Price Analysis July 28Symmetrical Channel Structure and High-Probability Trading Strategies
In today’s trading session (July 28), the XAUUSD 15-minute chart reveals a clear symmetrical channel pattern, indicating a technical correction after a previous strong uptrend.
1. Trend Structure
Phase 1 (July 18–23): Price moved within an ascending channel, forming higher highs and higher lows — a clear bullish structure.
Phase 2 (July 23–26): After peaking, price reversed into a descending channel, establishing a bearish sequence of lower highs and lower lows.
Currently, price is consolidating near the lower boundary of the descending channel, testing short-term support.
2. Key Support and Resistance Levels
Price Level
Technical Significance 3,360 – 3,365
Key resistance zone – top of descending channel 3,345
Dynamic resistance – EMA21 on M15 3,320 – 3,315
Crucial support zone – lower boundary of channel 3,300
Psychological support & prior swing low (July 10)
3. Price Action and Indicators
Volume has gradually decreased, signaling potential weakening of selling momentum.
RSI on M15 has rebounded from the oversold zone, currently moving above 40, suggesting a short-term technical bounce.
EMA21 & EMA50 are still sloping downward, confirming short-term bearish pressure.
4. Intraday Trade Scenarios
✅ Scenario 1: Rebound Play from Channel Support
Entry: 3,320 – 3,325 (after bullish confirmation candle)
Stop Loss: Below 3,312
Take Profit: 3,345 – 3,355 (resistance zone & mid-channel)
⚠️ Scenario 2: Trend-Following Short from Resistance
Entry: 3,345 – 3,350 (if price rejects at EMA21 or channel resistance)
Stop Loss: Above 3,360
Take Profit: 3,320 – 3,310
5. Strategy Outlook
XAUUSD remains in a corrective bearish phase after a strong rally. As long as the 3,312 level holds, there’s potential for a technical rebound during the London–New York session. However, sellers remain in control unless price breaks and closes above 3,360.
Follow for more real-time gold strategies. Save this post if you found it helpful!
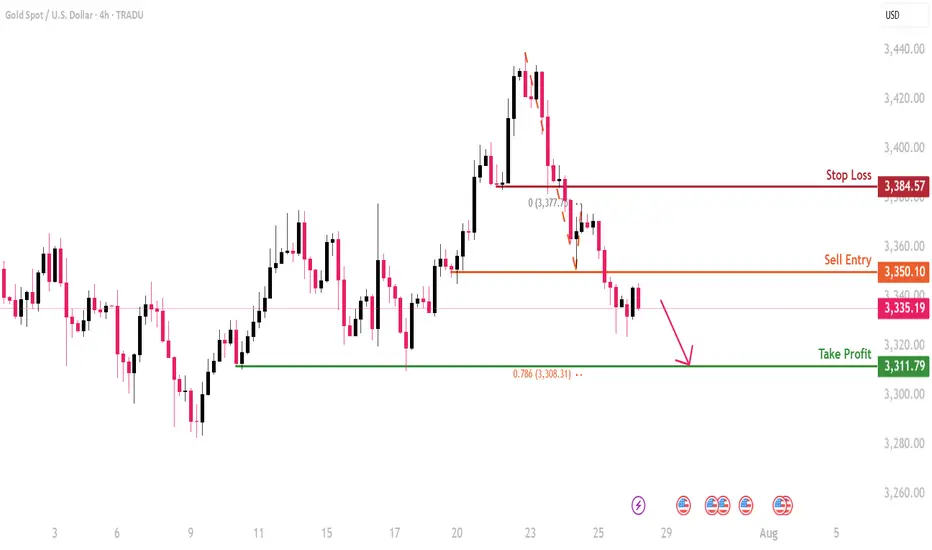
XAUUSD- Bearish Reversal OffBased on the H4 chart analysis, we can see that the price is rising toward our sell entry at 3350.10, which is a pullback resistance.
Our take profit will be at 3311.79, a swing low support level.
The stop loss will be placed at 3384.57, a pullback resistance.