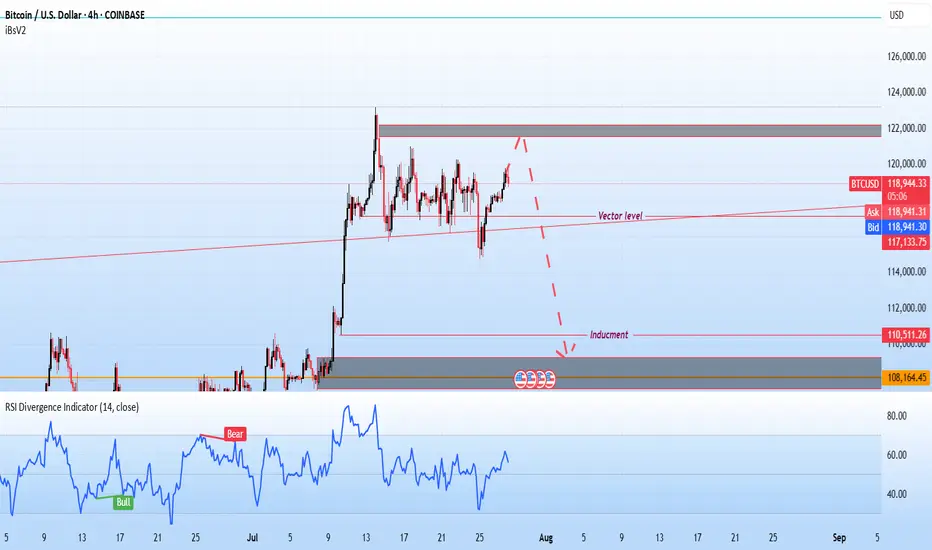
BTCUSDT analysis – 1H & 4H OB setups✅ The overall market trend is still bullish on the 1H and 4H timeframes. However, we’re watching the red 4H supply zone (around 122,000) closely for a possible short-term sell setup.
🟥 If price reaches this red OB, we’ll look for a light short position only with confirmation on the 5M or 3M timeframe.
🟩 On the downside, we are mainly interested in buy setups from the following key green OB zones:
🔹 OB 1H around 115,000
🔹 OB 4H around 111,000
🔹 OB 4H around 108,000
📌 Possible scenarios:
1️⃣ Price reaches the red OB → short with confirmation
2️⃣ Price pulls back to lower green OB zones → long with confirmation
3️⃣ Market bias remains bullish unless proven otherwise.
❌ No entry without confirmation.
Harmonic Patterns

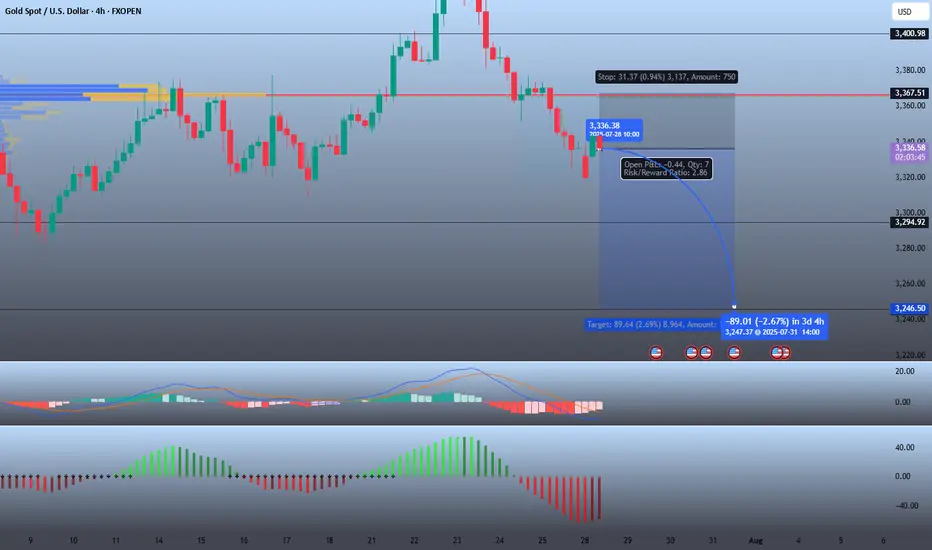
XAU/USD 4H Bearish📉 XAU/USD 4H Bearish Setup
Gold is showing signs of continued downside after a failed breakout near the 3,367 resistance zone.
🔹 Entry: 3,336.38
🔹 Stop Loss: 3,367.51
🔹 Target: 3,246.50
🔹 Risk/Reward: 2.86
📊 Analysis Highlights:
Price rejected the value area high with a clean bearish engulfing setup.
MACD crossed down, and histogram momentum continues to decline.
Volume profile shows strong supply above 3,350 and thin demand below 3,300.
Target aligns with previous support near 3,246.
🧠 Expecting bearish continuation toward 3,240–3,246 zone if selling pressure sustains.
Bitcoin selling plan!"Hello, focusing on BTC on the 4-hour chart, the price is currently in a bullish momentum on higher time frames. However, it is showing signals indicating a potential completion of its pullback to the $110,000 zone. In my opinion, the $122,000 zone could be a good area to consider a sell position, with confirmation on the 15-minute chart. I plan to wait for this zone and then decide on initiating a sell position.
EURJPYBank of Japan (BOJ) — July 28, 2025: Latest Overview
Policy Rate and Recent Moves
Short-term policy rate: Remains at 0.5%, the highest since 2008.
Decision timing: This rate was set in January 2025 (up from 0.25%) and has been maintained
Policy Outlook and Economic Backdrop
Inflation: Tokyo's core CPI is running above the BOJ’s 2% target (2.9% YoY in July), primarily due to external price pressures like energy and currency movements, not strong domestic demand.
Growth trends: The BOJ has trimmed its growth outlook, noting headwinds from higher U.S. tariffs and yen weakness, but still expects a moderate recovery if global trade remains stable.
Bond Purchases: The BOJ is scaling back its massive holdings of Japanese government bonds—targeting a 400 billion yen quarterly reduction through March 2026, then lowering to 200 billion yen in subsequent quarters.
Potential rate path: Market consensus and BOJ commentary indicate a possible hike to at least 0.75% by year-end 2025 if above-target inflation persists and downside global risks do not intensify.
Key Drivers and Central Bank Signals
U.S.-Japan trade: The new trade pact has reduced some uncertainties, supporting the possibility of policy tightening if inflation and yen trends remain stable.
Inflation’s nature: The BOJ stresses that any additional rate hikes will depend on seeing sustained, demand-driven price increases and wages, rather than just external cost pressures.
Governor Ueda’s message: The BOJ is maintaining a cautious, data-dependent approach, prioritizing stability and careful evaluation of global and domestic risk factors.
Quick Fact Table
Indicator Latest (July 2025) BOJ’s Signal
Policy Rate 0.5% Steady for now; another hike possible in 2025
Tokyo Core CPI (YoY) 2.9% Sustainable above-target inflation
Next Meeting July 30–31 Hawkish bias; likely no immediate change
Bonds (JGB reduction) -400B yen/Q Gradual unwinding through March 2026
Rate Outlook Stable, with upside Hike to 0.75% possible by year-end if justified
Summary:
The BOJ remains in a cautious, data-driven policy stance at 0.5% as of late July 2025, with inflation still above target and moderate growth. The central bank is slowly reducing bond purchases and may raise rates again by year-end if the current economic trends persist, but no change is expected at the imminent July meeting.
European Central Bank (ECB) — July 2025: Latest Policy and Economic Update
Key Interest Rates and Current Stance
Deposit Facility Rate: 2.00%
Main Refinancing Operations (MRO) Rate: 2.15%
Marginal Lending Facility Rate: 2.40%
These rates were set after a 25 basis point cut in early June 2025 and have now been held steady as of the ECB’s July 24, 2025 meeting.
Monetary Policy Context
Policy Pause: The ECB ended a year-long easing cycle which saw rates cut from 4% to 2%. The current pause reflects the ECB’s “wait-and-see” approach as inflation has now stabilized at its 2% target and global trade tensions—especially over U.S. tariffs—add significant uncertainty.
No Commitments: The Governing Council is explicitly not pre-committing to any future rate path, emphasizing a data-dependent, meeting-by-meeting stance.
Asset Purchases: The ECB’s asset purchase programme (APP) and the pandemic emergency purchase programme (PEPP) portfolios are being reduced gradually, with no reinvestment of maturing securities.
Inflation and Economic Outlook
Inflation: Now at 2% (its target). The ECB expects it to remain near target for the period ahead. Wage growth continues but is slowing, and underlying price pressures are easing.
Ecoomic Growth: The eurozone economy grew more strongly than expected in early 2025, but trade uncertainty and a stronger euro are holding back business investment and exports. Higher government spending, especially on defense and infrastructure, is expected to support growth over the medium term.
Loans and Credit: Borrowing costs are at their lowest since late 2022. Households are benefiting from strong labor markets and growing wages, but banks are cautious in their lending due to uncertainty and global trade tensions.
Risks and Forward Guidance
The ECB is focused on safeguarding price stability amid exceptional uncertainty due to global trade disputes and policy risks.
There is no forward guidance for the next rate change. Markets are pricing only one possible additional cut for 2025, and a potential return to tightening in late 2026 if inflation stays below target.
Summary Table: ECB at a Glance (July 2025)
Policy Rate 2.15%
Deposit Rate 2.00%
Marginal Lending 2.40%
Inflation (Jun 25) 2% (target achieved)
GDP Growth (2025) 0.9% (projected)
Policy bias Cautious, data-dependent pause
The ECB’s current stance is one of caution, monitoring the effects of prior easing and global trade risks while inflation stabilizes at target. No further near-term cuts are planned unless significant data surprises emerge. The approach is flexible, with decisions made meeting-by-meeting in response to evolving economic and financial conditions.

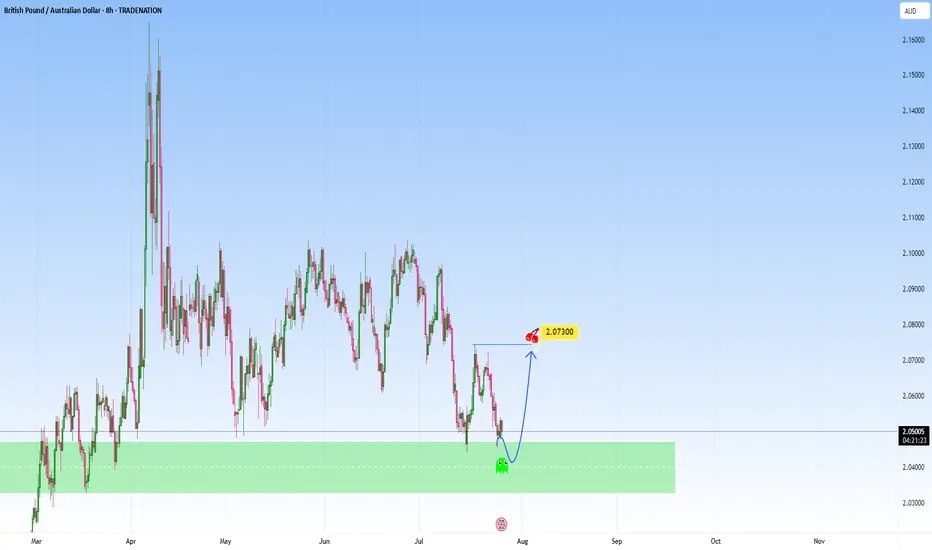
GBPAUD: Possible bounce at supportI am watching for a possible reversal GBPAUD, expecting a rejection with a upside target at around 2.073.
This area is where it can become a decision point, either price finds support and bounces, or it breaks below, and the move can start to extend lower.
Just sharing my thoughts for the charts, this isn’t financial advice. Always confirm your setups and manage your risk properly.
Disclosure: I am part of Trade Nation's Influencer program and receive a monthly fee for using their TradingView charts in my analysis.
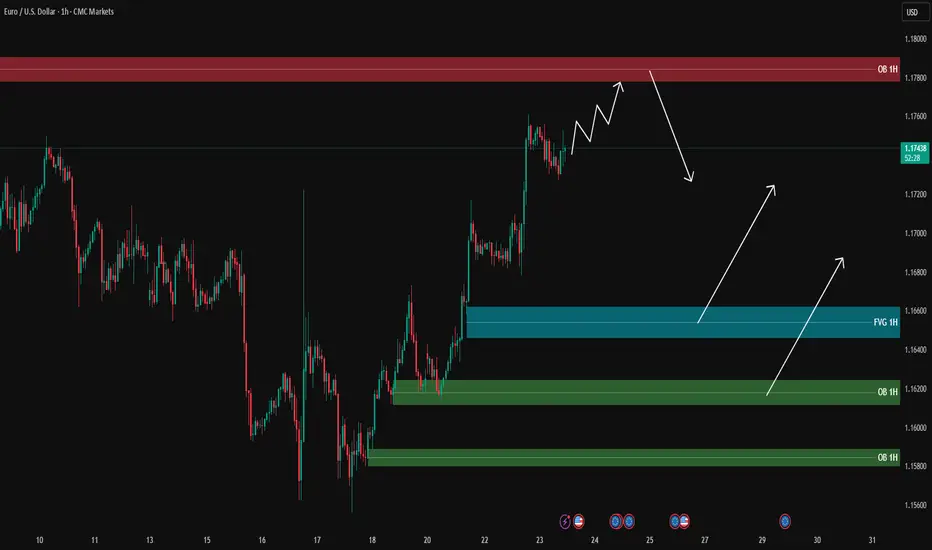
EURUSD analysis - 1H FVG and OB setupsOn the 1H timeframe, price is moving strongly towards the 1H supply zone (around 1.1780), and it is likely to reach this area first before pulling back.
During the pullback, the blue FVG and green OB zones below are key areas for potential long entries:
🔹 FVG 1H around 1.1660
🔹 OB 1H around 1.1620
🔹 OB 1H around 1.1580
📌 Plan:
1️⃣ If the price reaches the upper supply zone, we will look for short scalps with confirmation on the lower timeframe (5M/3M).
2️⃣ After the pullback to lower zones, we will look for long opportunities with PA confirmation.
🎯 Long targets after pullback: 1.1700 – 1.1720, potentially 1.1750.
❌ No entry without confirmation.
USDJPY Forming Bullish MomemtumUSDJPY is currently exhibiting strong bullish momentum following a clean breakout from a bullish pennant formation on the 2H timeframe. The market formed higher lows and consolidated within a tight structure, creating compression that has now resolved upward. This breakout indicates continuation of the prior bullish impulse, and price is now targeting the key resistance zone between 148.80 and 149.30. This area previously acted as a strong supply zone, and a clean break above could open the path toward 150.00 psychological levels.
Fundamentally, the US dollar remains supported by expectations of a hawkish tone from the Federal Reserve. Despite mixed economic data recently, the US economy remains resilient, with GDP growth and labor market data showing strength. On the other hand, the Bank of Japan continues to maintain an ultra-loose monetary stance, offering little rate-hike guidance. This divergence in monetary policy keeps the dollar well-bid against the yen. Any further yield differential expansion will continue to support USDJPY to the upside.
From a technical perspective, the structure remains bullish as long as price holds above the 147.65–147.50 breakout support. Momentum is aligning well with the current price action, and volume confirmation on the breakout adds confidence to the bullish scenario. Traders should watch the reaction around the 149.00–149.30 zone carefully, as this is the last major barrier before we potentially see continuation toward multi-month highs.
Overall, the bullish continuation pattern suggests that USDJPY is preparing for another leg higher. With both technical and fundamental factors aligning, this pair remains a key watch for trend-following traders. Patience and precision remain critical here—watch for potential retests and build positions on confirmation.

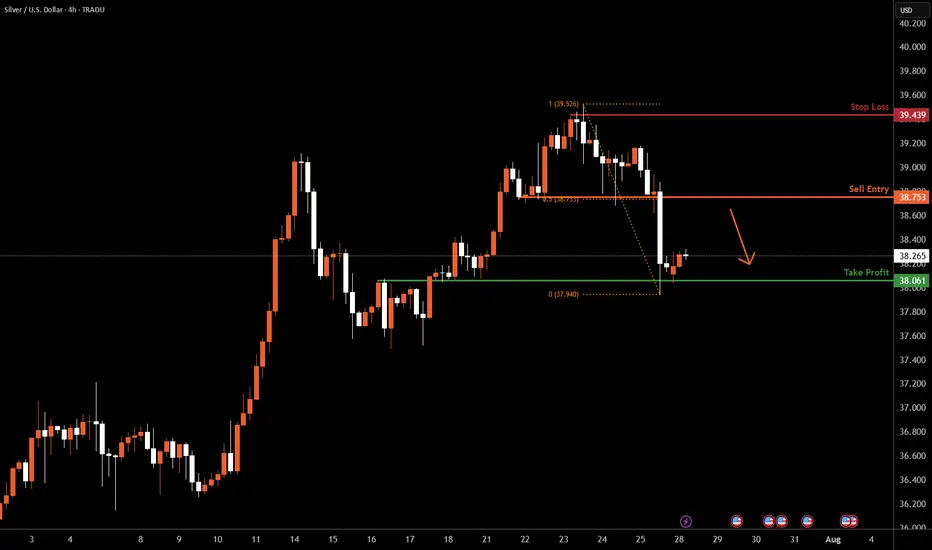
XAGUSD H4 I Bearish Reversal Based on the H4 chart analysis, we can see that the price is rising toward our sell entry at 38.75, which is a pullback resistance aligning with a 50% Fibo retracement.
Our take profit will be at 38.06, an overlap support level.
The stop loss will be placed at 39.43, a swing-high resistance level.
High Risk Investment Warning
Trading Forex/CFDs on margin carries a high level of risk and may not be suitable for all investors. Leverage can work against you.
Stratos Markets Limited (tradu.com ):
CFDs are complex instruments and come with a high risk of losing money rapidly due to leverage. 66% of retail investor accounts lose money when trading CFDs with this provider. You should consider whether you understand how CFDs work and whether you can afford to take the high risk of losing your money.
Stratos Europe Ltd (tradu.com ):
CFDs are complex instruments and come with a high risk of losing money rapidly due to leverage. 66% of retail investor accounts lose money when trading CFDs with this provider. You should consider whether you understand how CFDs work and whether you can afford to take the high risk of losing your money.
Stratos Global LLC (tradu.com ):
Losses can exceed deposits.
Please be advised that the information presented on TradingView is provided to Tradu (‘Company’, ‘we’) by a third-party provider (‘TFA Global Pte Ltd’). Please be reminded that you are solely responsible for the trading decisions on your account. There is a very high degree of risk involved in trading. Any information and/or content is intended entirely for research, educational and informational purposes only and does not constitute investment or consultation advice or investment strategy. The information is not tailored to the investment needs of any specific person and therefore does not involve a consideration of any of the investment objectives, financial situation or needs of any viewer that may receive it. Kindly also note that past performance is not a reliable indicator of future results. Actual results may differ materially from those anticipated in forward-looking or past performance statements. We assume no liability as to the accuracy or completeness of any of the information and/or content provided herein and the Company cannot be held responsible for any omission, mistake nor for any loss or damage including without limitation to any loss of profit which may arise from reliance on any information supplied by TFA Global Pte Ltd.
The speaker(s) is neither an employee, agent nor representative of Tradu and is therefore acting independently. The opinions given are their own, constitute general market commentary, and do not constitute the opinion or advice of Tradu or any form of personal or investment advice. Tradu neither endorses nor guarantees offerings of third-party speakers, nor is Tradu responsible for the content, veracity or opinions of third-party speakers, presenters or participants.
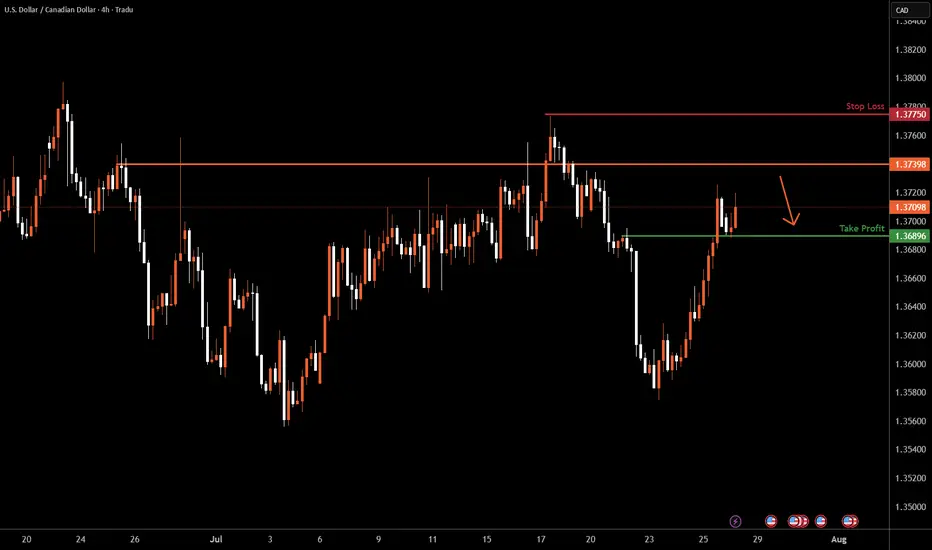
USDCAD H4 I Bearish Reversal OffBased on the H4 chart analysis, we can see that the price is rising toward our sell entry at 1.3739, which is a pullback resistance.
Our take profit will be at 1.3689, an overlap support level.
The stop loss will be placed at 1.3775, the swing-high resistance level.
High Risk Investment Warning
Trading Forex/CFDs on margin carries a high level of risk and may not be suitable for all investors. Leverage can work against you.
Stratos Markets Limited (tradu.com ):
CFDs are complex instruments and come with a high risk of losing money rapidly due to leverage. 66% of retail investor accounts lose money when trading CFDs with this provider. You should consider whether you understand how CFDs work and whether you can afford to take the high risk of losing your money.
Stratos Europe Ltd (tradu.com ):
CFDs are complex instruments and come with a high risk of losing money rapidly due to leverage. 66% of retail investor accounts lose money when trading CFDs with this provider. You should consider whether you understand how CFDs work and whether you can afford to take the high risk of losing your money.
Stratos Global LLC (tradu.com ):
Losses can exceed deposits.
Please be advised that the information presented on TradingView is provided to Tradu (‘Company’, ‘we’) by a third-party provider (‘TFA Global Pte Ltd’). Please be reminded that you are solely responsible for the trading decisions on your account. There is a very high degree of risk involved in trading. Any information and/or content is intended entirely for research, educational and informational purposes only and does not constitute investment or consultation advice or investment strategy. The information is not tailored to the investment needs of any specific person and therefore does not involve a consideration of any of the investment objectives, financial situation or needs of any viewer that may receive it. Kindly also note that past performance is not a reliable indicator of future results. Actual results may differ materially from those anticipated in forward-looking or past performance statements. We assume no liability as to the accuracy or completeness of any of the information and/or content provided herein and the Company cannot be held responsible for any omission, mistake nor for any loss or damage including without limitation to any loss of profit which may arise from reliance on any information supplied by TFA Global Pte Ltd.
The speaker(s) is neither an employee, agent nor representative of Tradu and is therefore acting independently. The opinions given are their own, constitute general market commentary, and do not constitute the opinion or advice of Tradu or any form of personal or investment advice. Tradu neither endorses nor guarantees offerings of third-party speakers, nor is Tradu responsible for the content, veracity or opinions of third-party speakers, presenters or participants.
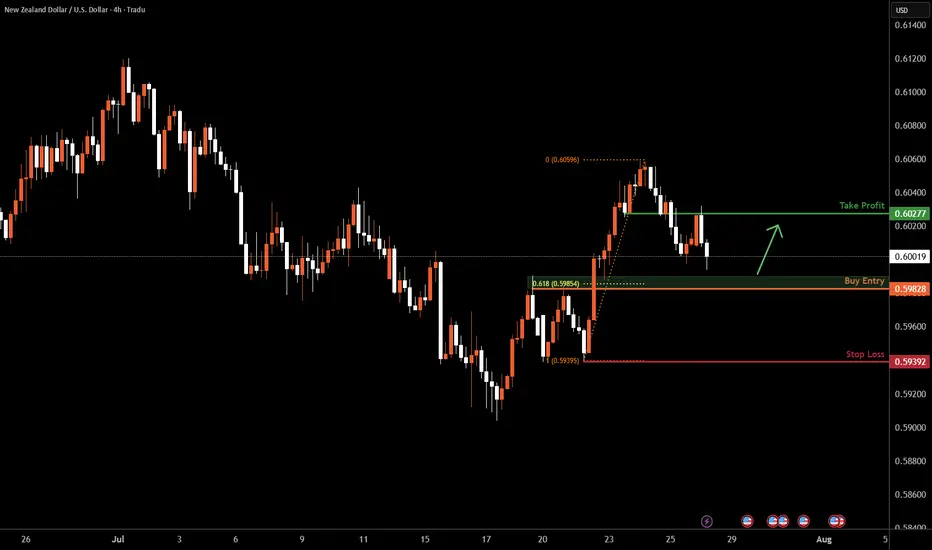
NZDUSD H4 I Bullish Bounce off the 61.8% Based on the H4 chart analysis, we can see that the price is falling toward our buy entry at 0.5982, which is a pullback support that aligns with the 61.8% Fib retracement.
Our take profit will be at 0.6027, which is an overlap resistance level.
The stop loss will be placed at 0.5939, a swing low support.
High Risk Investment Warning
Trading Forex/CFDs on margin carries a high level of risk and may not be suitable for all investors. Leverage can work against you.
Stratos Markets Limited (tradu.com ):
CFDs are complex instruments and come with a high risk of losing money rapidly due to leverage. 66% of retail investor accounts lose money when trading CFDs with this provider. You should consider whether you understand how CFDs work and whether you can afford to take the high risk of losing your money.
Stratos Europe Ltd (tradu.com ):
CFDs are complex instruments and come with a high risk of losing money rapidly due to leverage. 66% of retail investor accounts lose money when trading CFDs with this provider. You should consider whether you understand how CFDs work and whether you can afford to take the high risk of losing your money.
Stratos Global LLC (tradu.com ):
Losses can exceed deposits.
Please be advised that the information presented on TradingView is provided to Tradu (‘Company’, ‘we’) by a third-party provider (‘TFA Global Pte Ltd’). Please be reminded that you are solely responsible for the trading decisions on your account. There is a very high degree of risk involved in trading. Any information and/or content is intended entirely for research, educational and informational purposes only and does not constitute investment or consultation advice or investment strategy. The information is not tailored to the investment needs of any specific person and therefore does not involve a consideration of any of the investment objectives, financial situation or needs of any viewer that may receive it. Kindly also note that past performance is not a reliable indicator of future results. Actual results may differ materially from those anticipated in forward-looking or past performance statements. We assume no liability as to the accuracy or completeness of any of the information and/or content provided herein and the Company cannot be held responsible for any omission, mistake nor for any loss or damage including without limitation to any loss of profit which may arise from reliance on any information supplied by TFA Global Pte Ltd.
The speaker(s) is neither an employee, agent nor representative of Tradu and is therefore acting independently. The opinions given are their own, constitute general market commentary, and do not constitute the opinion or advice of Tradu or any form of personal or investment advice. Tradu neither endorses nor guarantees offerings of third-party speakers, nor is Tradu responsible for the content, veracity or opinions of third-party speakers, presenters or participants.
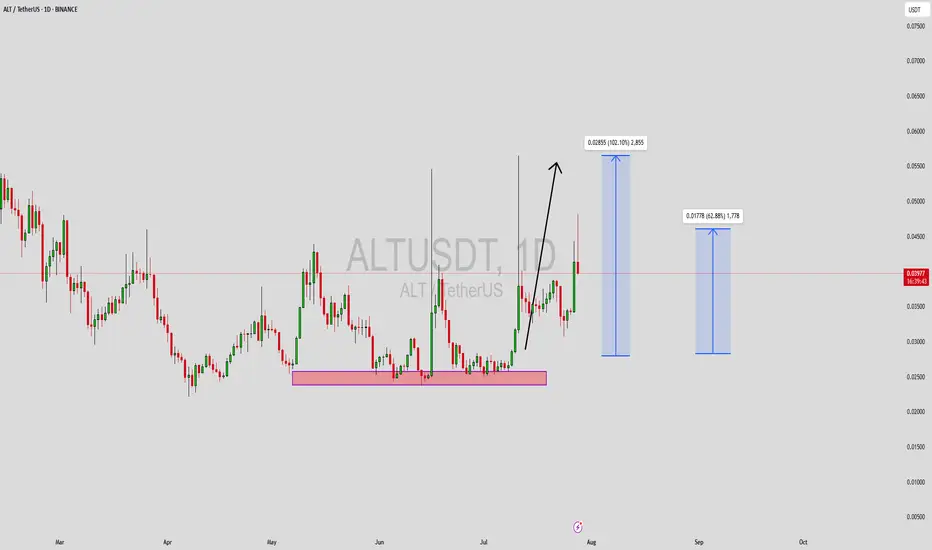
ALTUSDT Forming Bullish ReversalALTUSDT is currently displaying a bullish reversal pattern that may mark the beginning of a significant trend change. After a prolonged period of downward or sideways movement, the asset has shown signs of accumulation, with increasing volume and a shift in price structure. This type of reversal formation typically signals that buyers are stepping back into the market with strength, aiming to reclaim lost levels and push higher.
Technically, the chart structure supports a strong recovery potential, as the price is attempting to break out of a consolidation zone with solid momentum. The bullish reversal pattern suggests that sellers have likely exhausted their control, and a trend shift is underway. With increasing interest and engagement around the ALT project, both technically and sentimentally, a price surge in the range of 90% to 100% becomes a realistic expectation.
From a market sentiment perspective, ALT is regaining attention from crypto traders due to recent development updates and growing adoption potential in its ecosystem. Investors are beginning to identify ALT as a sleeper altcoin that may deliver above-average returns once the reversal is confirmed. This momentum is backed by improved volume and clear buying pressure on critical support levels.
A confirmed breakout above resistance, with sustained volume, could act as the catalyst for a parabolic move. Traders should monitor this setup closely, as it may offer one of the best reward-to-risk ratios in the current market cycle. ALTUSDT could be setting up for a major rally in the coming days or weeks.
✅ Show your support by hitting the like button and
✅ Leaving a comment below! (What is You opinion about this Coin)
Your feedback and engagement keep me inspired to share more insightful market analysis with you!
Beamx Dear Traders,
this coin have a nice potential it have breakout today
we may see it at 0.080 or 0.0085 in the future

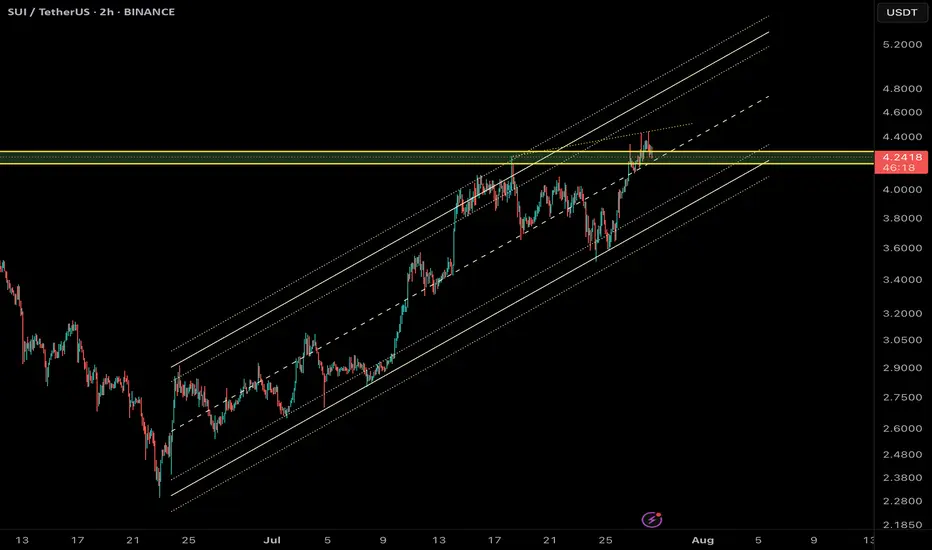
SUI Hits Key Liquidity Zone After – Correction Ahead?SUI has been climbing steadily inside a well-structured ascending channel for the past few weeks. The recent breakout above the $4.30 resistance zone – which was a key liquidity level – seems to have swept stop-losses and trapped late buyers.
🔎 Here's what we're watching:
- Price broke out of the ascending channel briefly and rejected from the upper parallel.
- The breakout above $4.30 was likely a liquidity grab (buy-side liquidity taken).
- Price is now pulling back, showing signs of distribution below resistance.
📉 Expecting a correction toward the lower channel line as price seeks rebalancing.
🧠 Strategy Notes:
- No reason to long here unless price reclaims $4.35 with volume.
- Ideal buy zone is near the midline or lower channel.
- A break below the channel could signal deeper correction toward $3.60 or lower.
📊 Always respect risk – don’t chase after price in these zones.
📡 Analysis by CryptoPilot – navigating the market with precision.
#CryptoPilot #SUI #SmartMoney #LiquidityGrab #CryptoTrading #TrendChannel #Altcoins
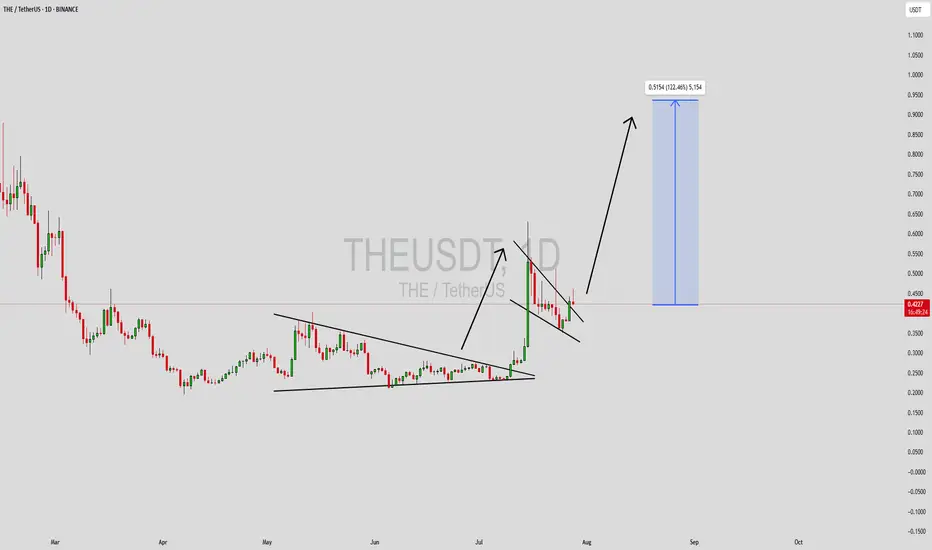
THEUSDT Forming Bullish PennantTHEUSDT is showing a highly promising structure, currently consolidating within a classic bullish pennant pattern. This type of formation typically follows a strong upward impulse, where price enters a phase of tight consolidation before potentially continuing its move higher. With strong volume observed throughout the recent price action and a well-defined pennant forming, the setup is aligning for a high-probability breakout to the upside.
Technical traders are paying close attention to this chart due to the textbook nature of the pattern and the potential for an explosive move. Bullish pennants are continuation patterns, and when combined with increasing volume and market interest, they often lead to powerful rallies. With the current market momentum and rising interest from investors, a breakout from this consolidation zone could trigger a 90% to 100% surge in the coming sessions.
Fundamentally, THE token has been attracting attention from both retail and institutional participants, thanks to its unique position in the Web3 and AI ecosystem. This renewed focus is not just technical but also driven by growing community engagement and strategic developments that hint at long-term sustainability. Investors looking for altcoins with strong upside potential are beginning to position early.
With the breakout point approaching, THEUSDT could soon confirm its bullish bias. Keep an eye on volume spikes and clean breaks above resistance lines to validate the move. If confirmed, this could be one of the top-performing setups in the current market cycle.
✅ Show your support by hitting the like button and
✅ Leaving a comment below! (What is You opinion about this Coin)
Your feedback and engagement keep me inspired to share more insightful market analysis with you!
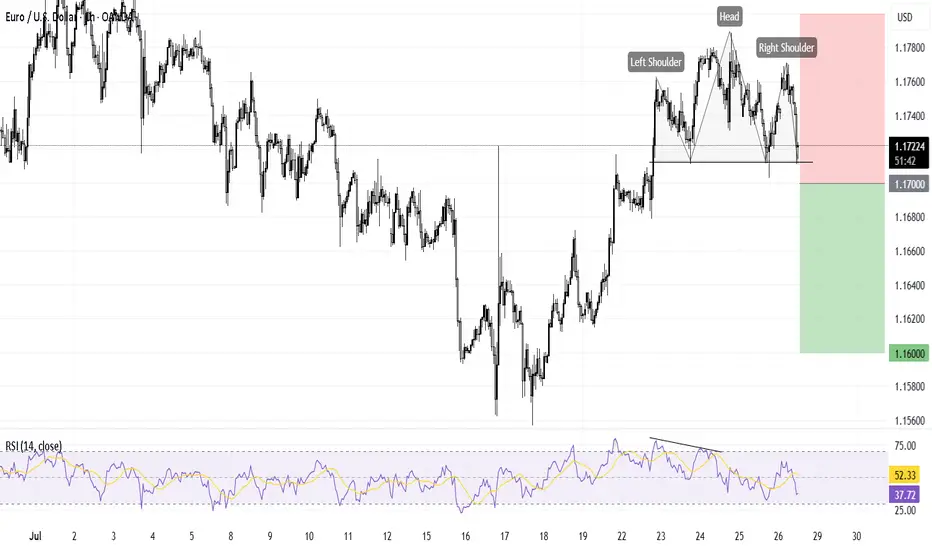
EUR/USD Bearish Reversal SetupEUR/USD is forming a head and shoulders pattern with bearish divergence, indicating a potential price drop. A sell below the neckline confirms the breakout of the last higher low.
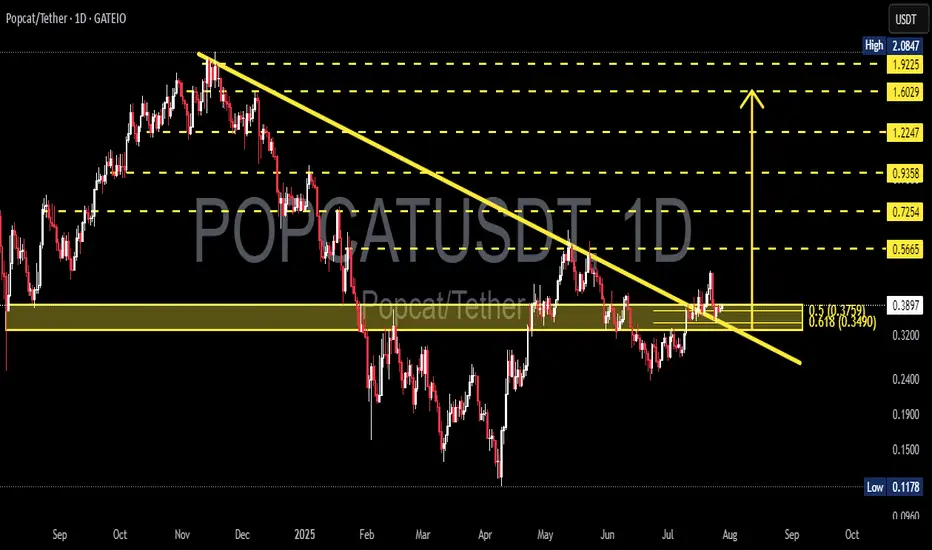
POPCATUSDT – Breakout Confirmation or False Signal?On the daily chart of POPCATUSDT, the price has recently broken out of a descending trendline that has been acting as resistance since December 2024. This breakout signals a potential trend reversal from bearish to bullish.
Currently, the price is in a retest phase, revisiting the breakout zone, which also aligns with a strong support and Fibonacci retracement area:
Support zone: $0.34 – $0.38
Fibonacci 0.618: $0.3490 (major technical support)
Fibonacci 0.5: $0.3759 (typical retest level after breakout)
If the price holds above this zone and forms a bullish confirmation candle, it strengthens the case for continued upward momentum.
---
Pattern and Market Structure:
Descending Triangle Breakout: The price has broken out of a long-standing descending triangle pattern, which is typically a bullish reversal signal — especially if supported by volume (not shown in chart but crucial).
Neckline Retest: The current move is retesting the breakout zone, a common behavior after significant breakouts.
---
Bullish Scenario:
If the price holds above the $0.34–$0.38 zone and forms bullish price action:
Potential targets based on Fibonacci levels:
Target 1: $0.5665
Target 2: $0.7254
Target 3: $0.9358
Major targets: $1.2247 and possibly $1.6029 if bullish momentum sustains
---
Bearish Scenario:
If the price fails to hold above $0.34 and breaks down below the support:
Potential downside towards $0.26 – $0.20 zone
If selling pressure intensifies, it may revisit the key support low around $0.1178
---
Conclusion:
POPCATUSDT is at a critical decision point. The breakout from the descending trendline is an early bullish signal, but confirmation from the $0.34–$0.38 retest zone is essential. If it holds, a strong bullish rally may follow. However, a failure to hold could signal a false breakout and resume the bearish trend.
#POPCAT #POPCATUSDT #CryptoBreakout #AltcoinAnalysis #ChartPatterns #TechnicalAnalysis #FibonacciLevels #CryptoTrading #BullishSetup #BearishScenario
MOVEUSDT Long-Term Downtrend Line – Breakout or Downside Ahead?📊 MOVE/USDT Chart Analysis (1D Timeframe)
On the daily chart, MOVEUSDT has been locked in a strong downtrend since early 2025. The dominant descending trendline (yellow) clearly outlines the continuous selling pressure, with a series of lower highs and lower lows.
Price is currently trading just below this trendline and hasn’t confirmed a breakout yet. However, there are signs of accumulation in the lower zone, indicating a possible trend reversal if a breakout is confirmed.
---
📌 Identified Pattern
A descending triangle has formed in the medium term, though its bearish momentum seems to be weakening.
A potential double bottom pattern may be developing near the $0.1200–$0.1300 support area.
---
📈 Bullish Scenario
If the price manages to break above the descending trendline and close above the key resistance at $0.1841, we could see a bullish continuation toward:
Target 1: $0.2200
Target 2: $0.2465
Target 3: $0.4018
Further upside could aim for Fibonacci retracement levels like $0.6170, $0.8188, and potentially $1.1246 if volume confirms the breakout.
A strong bullish confirmation would come with high volume and a daily candle close above the trendline.
---
📉 Bearish Scenario
If the price gets rejected at the trendline again and breaks down below the $0.1200 support:
Next support levels to watch: $0.0900
Followed by $0.0650 and $0.0490 if bearish momentum increases.
A breakdown below these zones may signal a continuation of the long-term downtrend.
---
💡 Conclusion
MOVEUSDT is at a crucial decision point. A breakout from this long-standing downtrend could trigger a significant trend reversal, while another rejection might continue the bearish cycle. Watch for volume spikes and daily closes above the trendline to confirm the next move.
#MOVEUSDT #CryptoChart #TechnicalAnalysis #CryptoBreakout #AltcoinWatch #TradingStrategy #DescendingTrendline #FibonacciLevels #CryptoSupportResistance #BullishSetup #BearishSetup

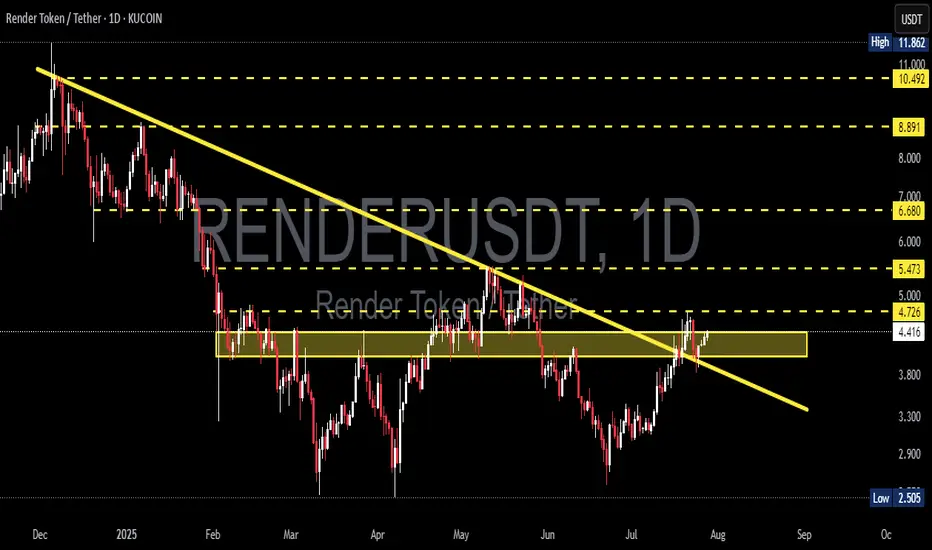
RENDERUSDT Breaks Major Downtrend – Will Bulls Sustain!🧠 Market Context & Structure:
RENDERUSDT is currently presenting one of the most technically compelling setups in recent months. After enduring a prolonged downtrend since late 2024, price action has finally broken above the major descending trendline that has acted as dynamic resistance for over 7 months.
This breakout signals a potential shift in market control from sellers to buyers, marking a critical phase transition from bearish pressure to a possible bullish reversal.
---
📊 Key Technical Levels:
Descending Trendline (Breakout Confirmed): Clean breakout with bullish momentum—first signal of a structural shift.
Major Consolidation Zone (Supply Zone): $4.41 – $4.72
↪ Previously acted as strong resistance; now being tested as potential support reclaim.
Critical Support (Retest Area): $3.80 – $4.00
↪ If the breakout fails, this zone will be the next major defense for the bulls.
Upside Resistance Targets:
⚡ $5.47 – Minor horizontal resistance
🚀 $6.68 – Key resistance from prior swing highs
🧨 $8.89 and $10.49 – Mid-term bullish targets if trend continuation holds
---
🔍 Pattern Analysis:
Descending Trendline Breakout
A textbook reversal pattern, where a successful breakout above the long-term trendline signals a shift in momentum.
Supply Zone Reclaim
Price is now attempting to reclaim a previously rejected supply zone. If successful, it may indicate the beginning of a Wyckoff-style markup phase.
---
🟢 Bullish Scenario (Optimistic Outlook):
Price holds above $4.72, validating the breakout with strength and possibly retesting the area as new support.
A clear continuation may drive the price toward $5.47 and $6.68 in the short to medium term.
Rising volume and strong bullish candlesticks (e.g., marubozu or bullish engulfing) will further confirm momentum.
---
🔴 Bearish Scenario (Caution Required):
If price fails to hold above $4.41 – $4.72 and closes back below the breakout zone:
This would suggest a false breakout (bull trap).
Potential downside toward $4.00 or even $3.50.
Selling pressure could re-emerge, especially if broader market sentiment turns negative.
---
🧠 Market Psychology:
Traders are watching closely to see if this breakout is real or a trap.
This is a decision zone, where early profit-taking clashes with new momentum entries.
A strong close above $4.72 with increasing volume may invite more participation and confirmation of a trend reversal.
---
🧭 Conclusion:
RENDERUSDT is at a critical technical crossroads. The breakout from the long-standing descending trendline is a major bullish signal—but the real test lies in whether bulls can hold and flip resistance into support.
If successful, we could witness the early stages of a mid-term bullish trend, with potential targets reaching up to $10.49 in the coming weeks. However, caution is advised in case of a breakdown back below the key zone.
#RENDERUSDT #RenderToken #CryptoBreakout #TrendReversal #TechnicalAnalysis #BullishBreakout #DescendingTrendline #SupportResistance #CryptoCharts #WyckoffMethod #Altcoins
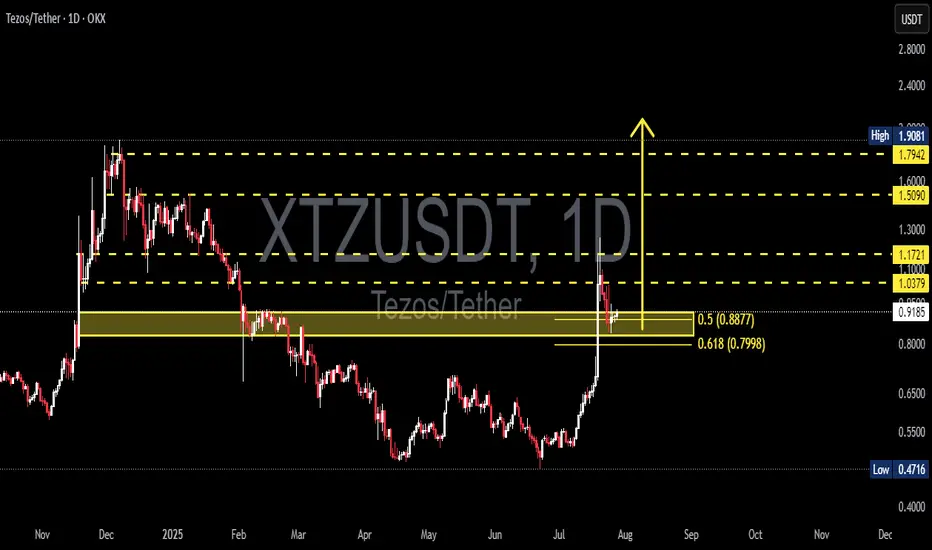
XTZUSDT Fibonacci Retest and Rebound Potential: Is Tezos Ready?Detailed Analysis of XTZ/USDT Chart (Daily Timeframe):
The XTZUSDT pair (Tezos vs USDT) has shown strong momentum following a breakout above previous support zones, with a sharp rally toward $1.17 before retracing.
Currently, the price is testing the Fibonacci Retracement levels, specifically the 0.5 ($0.8877) and 0.618 ($0.7998) zones — which also align with a key previous demand zone. This zone is critical for determining the next directional move.
---
🟢 Bullish Scenario:
If the price holds above the $0.80–$0.88 zone (Fibonacci support area), this could confirm a valid breakout retest.
Potential upside targets include:
$1.0379 (minor resistance)
$1.1721 (recent local high)
Further targets: $1.5090 – $1.7942, and potentially the major high at $1.9081.
This structure may form a bullish continuation pattern, especially if supported by volume.
---
🔴 Bearish Scenario:
A breakdown below $0.7998 may trigger further selling pressure toward $0.70 – $0.65.
A deeper retracement could take price back into the previous accumulation zone between $0.55 – $0.50.
Failure to hold the Fibonacci levels may confirm a bull trap, invalidating the recent breakout.
---
📌 Pattern Insights:
The current price action resembles a Bullish Flag / Retest Structure.
The 0.5–0.618 Fibonacci levels serve as a key confluence area for potential trend continuation.
This is a common setup before a major upside move — if the support holds.
---
Conclusion: XTZ is at a decisive moment. As long as the price stays above $0.80, the bullish trend remains intact. However, a drop below could shift momentum back to the bears. Traders should watch this zone closely for confirmation.
#XTZUSDT #Tezos #CryptoAnalysis #AltcoinSeason #FibonacciRetracement #BreakoutRetest #TechnicalAnalysis #CryptoTrading #BullishScenario #BearishScenario
CTKUSDT at Critical Retest After Major Trendline Break!CTK/USDT has successfully broken out of a long-term descending trendline that has dominated the price since November 2024, signaling a potential trend reversal from bearish to bullish. The price is now retesting a crucial supply-turned-demand zone in the $0.36 - $0.39 area, which now acts as new support.
📊 Pattern and Price Structure
Descending Trendline Breakout: A clear breakout above the long-term downtrend, indicating the start of bullish sentiment.
Key Zone (Yellow Box): The $0.36 - $0.39 area previously acted as resistance multiple times and is now being tested as support.
Potential Reversal Pattern: The overall structure resembles a possible Inverse Head & Shoulders, with a neckline around $0.43.
---
🟢 Bullish Scenario
If the price holds above $0.36 and breaks through the minor resistance at $0.4323:
Next bullish targets are:
$0.5217
$0.7036
$0.8826
Up to $1.0151 as a major historical resistance
A breakout above $0.4323 with strong volume would confirm the bullish continuation.
---
🔴 Bearish Scenario
If the $0.36 support fails to hold:
Potential downside levels to watch:
$0.31
$0.26
Down to the key low at $0.21
A breakdown of this zone would invalidate the reversal setup and suggest continuation of the downtrend.
---
📌 Conclusion
CTK is at a critical decision point. The breakout from the downtrend is an encouraging signal, but its validity depends on whether the price can hold the new support and push above the next resistance. Volume confirmation will be key to identifying the next move.
#CTKUSDT #CryptoBreakout #AltcoinAnalysis #TrendlineBreakout #TechnicalAnalysis #SupportResistance #CryptoSetup #BullishReversal #CTKAnalysis

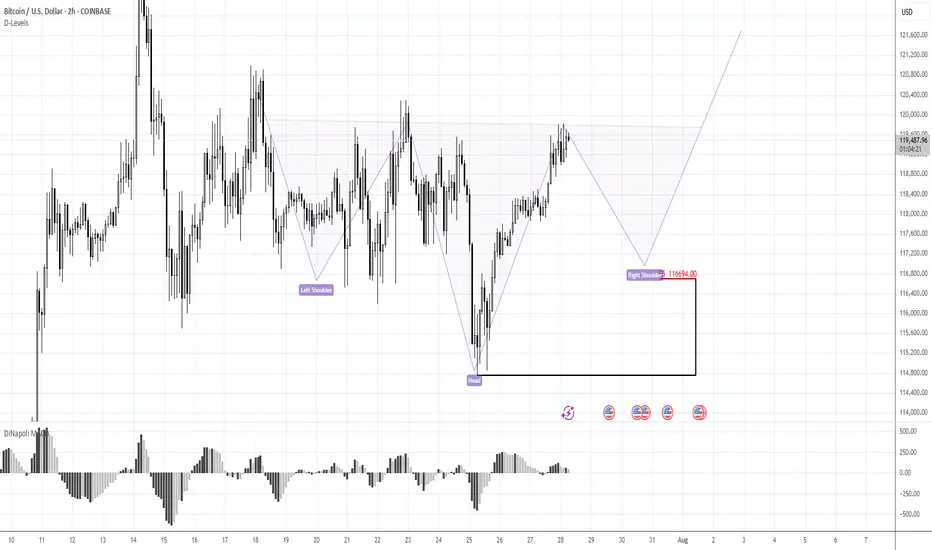
BTC 116.70K stands in focusMorning folks,
Once we've prepared the analysis, we've got upsetting squeeze down, thanks to Galaxy massive sell-off. I don't know what they were trying to do - either hunted for stops under 116K, or just sold in most unwelcome moment... but unfortunately such an issues are out of our control.
For now - BTC totally reversed this sell-off and once again shows positive sentiment. Now we consider same reverse H&S pattern, but this time of a bigger scale. 116.70K support area, where, the right arm should be formed now stands in our focus for long entry. We consider no shorts by far. Hopefully no more tricks will follow from old Donny or somebody else...
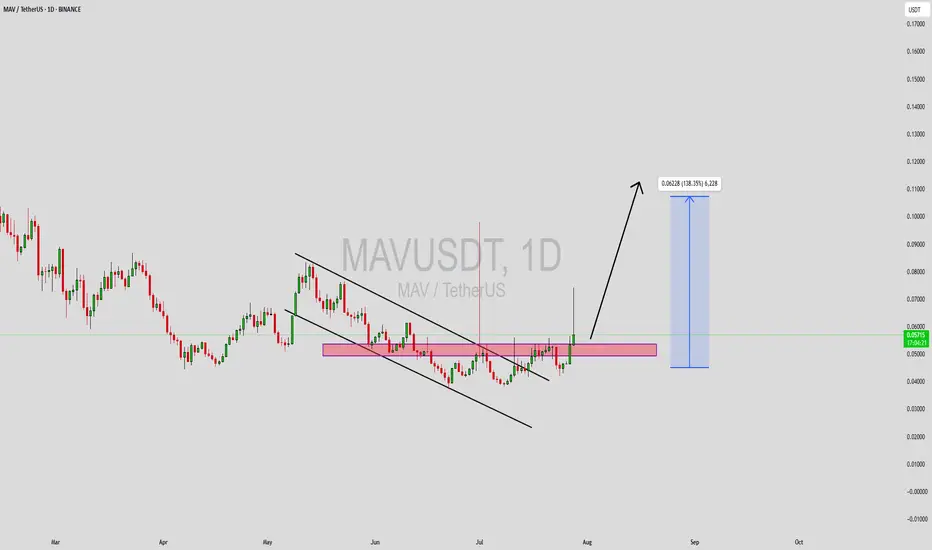
MAVUSDT Forming Falling ChannelMAVUSDT has recently broken out of a falling channel pattern, signaling a potential trend reversal from its prolonged downtrend. This breakout is supported by a noticeable surge in trading volume, adding strength to the bullish momentum. The chart shows that price has successfully retested the previous resistance zone, now acting as strong support. This structural shift provides a compelling setup for an explosive upward move, especially as momentum builds across the altcoin market.
Traders are closely watching MAV due to its technical setup, as well as the broader interest in decentralized finance (DeFi) protocols. The current price action hints at a high-probability bullish continuation, with a projected gain of 90% to 100%+ if bullish sentiment remains intact. The combination of solid support formation, high-volume breakout, and clear upside potential makes this a high-conviction play among smart money participants.
Maverick Protocol (MAV) is gaining attention for its unique approach to liquidity provisioning in DeFi. As the ecosystem matures and more investors look for efficient capital deployment strategies, protocols like MAV stand to benefit. The fundamentals, combined with the technical picture, suggest that the current levels may represent a key accumulation zone before a major breakout.
This setup could offer significant upside for early movers. Watching for follow-through candles and sustained volume above breakout zones will be key to validating the strength of this breakout move.
✅ Show your support by hitting the like button and
✅ Leaving a comment below! (What is You opinion about this Coin)
Your feedback and engagement keep me inspired to share more insightful market analysis with you!
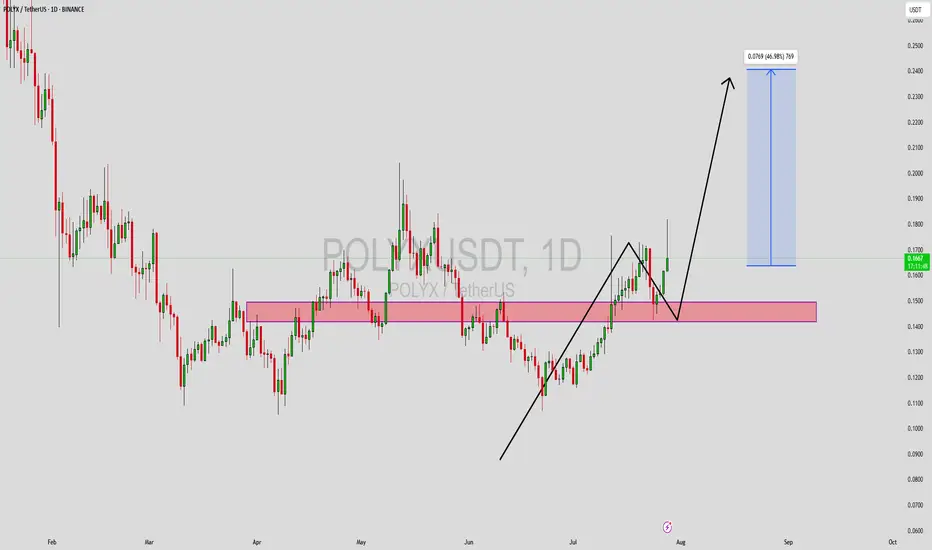
POLYXUSDT Forming Falling WedgePOLYXUSDT is currently showcasing a falling wedge pattern, a well-known bullish reversal setup that typically precedes a strong upward breakout. The chart structure reflects tightening price action with lower highs and lower lows, forming a wedge that has now broken to the upside. This pattern, coupled with a good spike in trading volume, supports the probability of a trend reversal. Price action has also respected the previous demand zone, reinforcing the likelihood of a sustained bullish movement.
Traders are increasingly turning their attention to POLYXUSDT due to its historical tendency to rally after consolidation phases like this. With a potential gain of 30% to 40% projected from the current levels, it offers an attractive setup for swing traders aiming to catch early entries before broader market participation. The chart also suggests that the token has reclaimed key support-turned-resistance zones, a critical bullish indicator in technical analysis.
The sentiment surrounding POLYX is improving as the broader altcoin market shows signs of recovery. As regulatory clarity improves and blockchain adoption expands, projects like Polymesh—which POLYX is native to—gain stronger traction. The falling wedge breakout, along with healthy volume and favorable macro signals, indicates that POLYX could be poised for a solid mid-term rally. It remains important for traders to watch retests of the breakout zone as confirmation before scaling in.
This technical opportunity could evolve into a strong move if bullish momentum continues to build across the market. Monitor volume surges and daily candle confirmations as catalysts to further validate this potential breakout trade.
✅ Show your support by hitting the like button and
✅ Leaving a comment below! (What is You opinion about this Coin)
Your feedback and engagement keep me inspired to share more insightful market analysis with you!