28.07.25 Morning ForecastPairs on Watch -
FX:EURCAD
FX:GBPUSD
OANDA:XAUUSD
FX:EURUSD
A short overview of the instruments I am looking at for today, multi-timeframe analysis down to what I will be looking at for an entry. Enjoy!
Harmonic Patterns

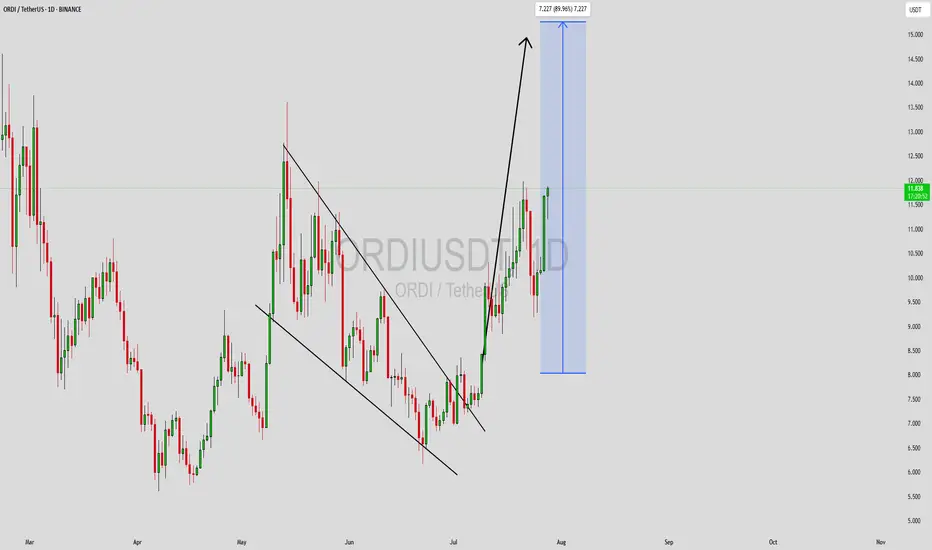
ORDIUSDT Forming Falling WedgeORDIUSDT is currently displaying a classic falling wedge pattern on the charts, a formation typically associated with bullish reversals. This technical setup suggests that the recent downtrend may be nearing exhaustion, with potential for a strong upward breakout. The wedge has been forming with lower highs and lower lows converging toward a breakout point, and recent candles suggest bullish pressure is beginning to build. With good volume supporting the structure, the conditions look ripe for a breakout rally.
A breakout from this falling wedge could see ORDIUSDT gaining between 70% to 80% in the coming weeks, based on historical price action and wedge height projections. The increased investor interest and healthy trading volume add conviction to this scenario, making it an attractive setup for both short-term swing traders and long-term crypto investors. The asset appears to be forming a base, and if the breakout confirms above key resistance levels, it could rapidly advance toward new highs.
What further adds to the bullish thesis is the growing attention toward Ordinals and Bitcoin-native assets, of which ORDI is a prominent player. Market participants are gradually shifting focus back to unique infrastructure and innovation-driven tokens, and ORDIUSDT may benefit from this shift in sentiment. With bullish divergence on indicators and confirmation of a breakout, this could be a strong candidate for a high-risk, high-reward opportunity.
Traders should keep an eye on volume spikes and confirmation candles for a safer entry. As always, risk management is key in volatile conditions, but technically, ORDIUSDT shows a promising structure that deserves close monitoring.
✅ Show your support by hitting the like button and
✅ Leaving a comment below! (What is You opinion about this Coin)
Your feedback and engagement keep me inspired to share more insightful market analysis with you!
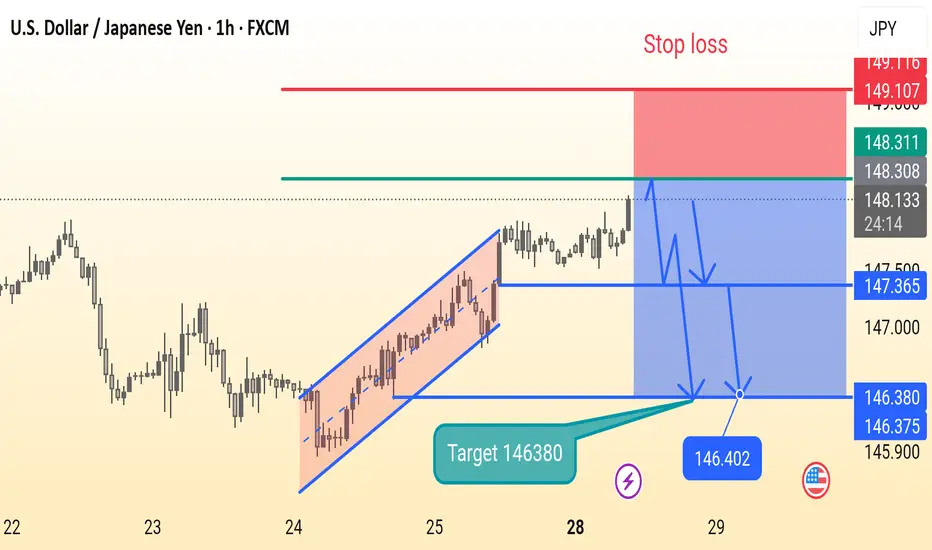
Usdjpy setupThis is a 1-hour USD/JPY chart showing a potential short (sell) trade setup. After a rising channel breakout, the price is consolidating. The chart suggests a bearish move with a target at 146.380 and a stop loss at 149.107. Key support levels are marked at 147.365 and 146.380.
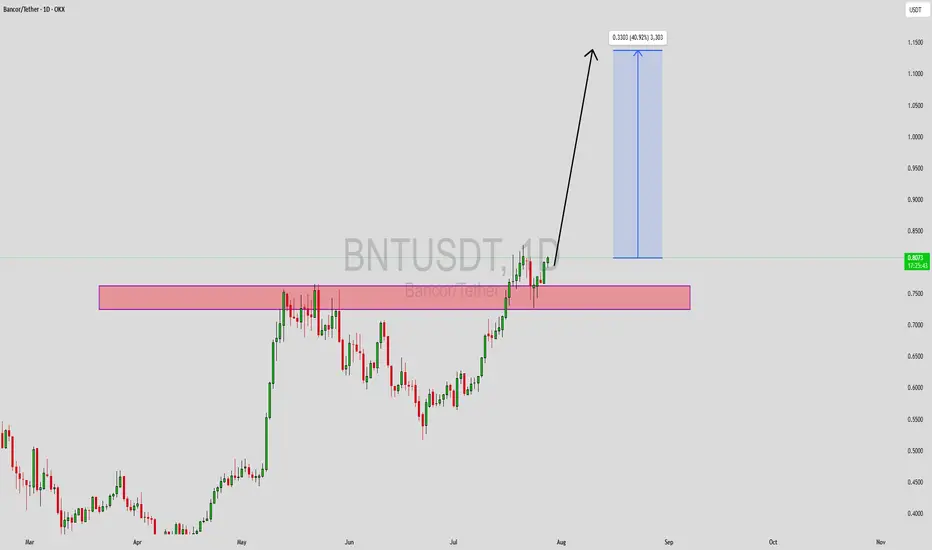
BNTUSDT Forming Bullish ContinuationBNTUSDT (Bancor/USDT) has recently broken out above a major resistance zone that previously acted as a supply area, which is now expected to serve as a strong support base. The breakout is supported by consistent bullish candles and increasing volume, hinting at institutional interest or strong retail buying. The clean break and consolidation above the $0.75 level provide a solid technical foundation for further upside movement. The current price structure aligns with the characteristics of a bullish continuation setup.
As depicted in the chart, the pair is showing potential for a gain of approximately 30% to 40% in the short-to-medium term. The recent price action forms a classic breakout and retest pattern, indicating buyers are stepping in after confirming the breakout zone as support. These technical formations are often followed by impulsive upward moves, especially when volume supports the trend.
Market sentiment surrounding BNT is improving, likely driven by broader ecosystem developments or renewed interest in DeFi protocols. If momentum continues and the current bullish structure holds, BNTUSDT could surge towards the $1.15 area, as projected by the breakout target shown in the chart. This target also aligns with previous structural highs, which may act as the next resistance zone.
Given its technical strength, investor interest, and a favorable risk-to-reward ratio, BNTUSDT stands out as a solid opportunity for trend-following traders. It's wise to monitor volume and any macro crypto market catalysts, as they could accelerate the move or provide added confirmation.
✅ Show your support by hitting the like button and
✅ Leaving a comment below! (What is You opinion about this Coin)
Your feedback and engagement keep me inspired to share more insightful market analysis with you!
OMNIUSDT Forming Bullish WaveOMNIUSDT is currently forming a classic bullish wave pattern, signaling strong upward momentum building in the background. This pattern often marks the continuation of a larger uptrend and is typically observed in assets preparing for aggressive breakouts. The structure implies that the market has completed its correction phase and is now entering an impulsive wave, aiming for a significant price expansion.
Volume analysis supports this bullish thesis, as increasing volume around support zones often indicates accumulation by smart investors. The steady buy-side interest hints that institutional or large traders may be positioning for a breakout. With market sentiment shifting favorably and technical indicators aligning, OMNIUSDT has attracted attention across trading communities, reinforcing the strength behind this move.
The expected gain of 160% to 170% highlights the bullish potential of this setup. The coin’s price action is aligning well with historical bullish wave formations, which in the past have led to explosive gains once resistance levels are breached. Traders looking for high-reward opportunities should keep a close eye on this pair, especially if confirmation breaks above recent swing highs.
Given the confluence of technical strength and market interest, OMNIUSDT presents a promising opportunity for mid- to long-term traders. Timing entries with breakout confirmation and volume surges could maximize profit potential while managing risk effectively.
✅ Show your support by hitting the like button and
✅ Leaving a comment below! (What is You opinion about this Coin)
Your feedback and engagement keep me inspired to share more insightful market analysis with you!

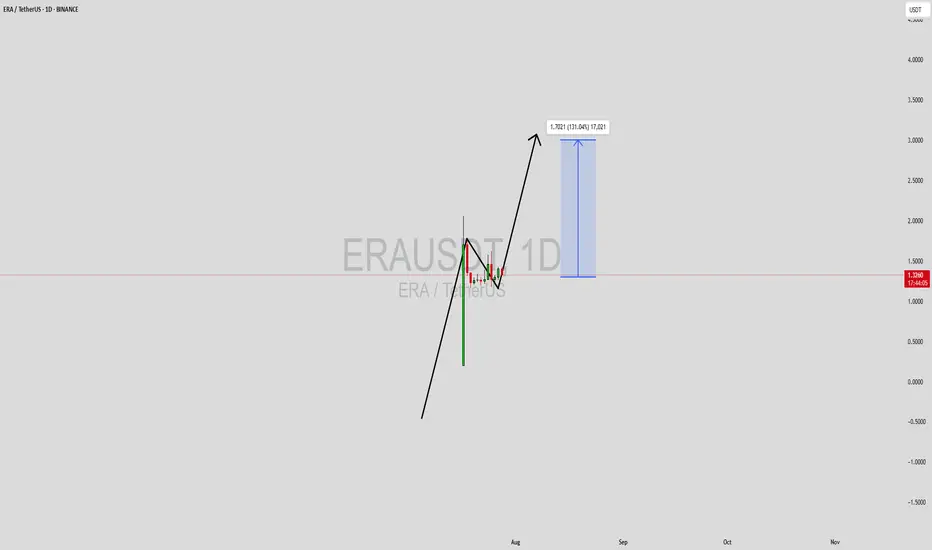
ERAUSDT Forming Bullish WaveERAUSDT is currently showcasing a strong bullish wave pattern, a powerful continuation signal that indicates the potential for significant upside momentum. This wave formation suggests that the recent corrective phase has completed, and the asset is preparing for the next impulsive leg upward. The market structure is aligning with common Elliott Wave principles, highlighting early accumulation followed by an expected breakout phase.
The trading volume around key support and resistance levels has remained healthy, confirming the strength of current price action. ERA’s steady volume profile supports the view that smart money may be positioning ahead of the next bullish breakout. Historically, bullish wave patterns combined with consistent volume inflows have led to sharp price accelerations, especially in altcoins with strong technical bases.
With an expected gain of 90% to 100%+, ERAUSDT appears well-positioned for a mid-term rally. Traders are closely watching this pair for confirmation of the breakout from its current structure. If the next wave holds and follows through on momentum, this coin could deliver significant returns for both swing traders and position holders. The technical outlook is further boosted by increased investor attention and social buzz surrounding the project.
This setup offers a favorable risk-reward ratio, especially if entries are managed with breakout confirmation and appropriate stop levels. As always, it's essential to monitor volume spikes and resistance reactions as the price moves upward.
✅ Show your support by hitting the like button and
✅ Leaving a comment below! (What is You opinion about this Coin)
Your feedback and engagement keep me inspired to share more insightful market analysis with you!
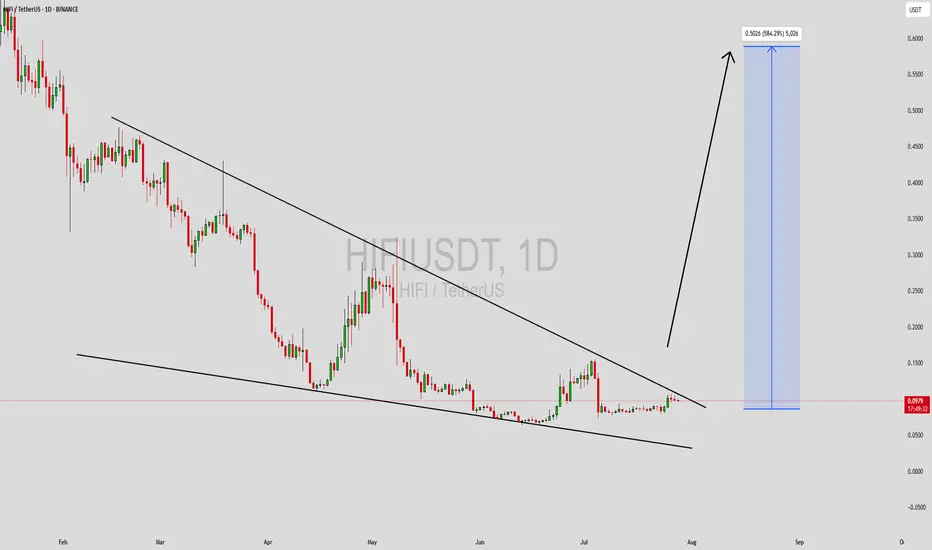
HIFIUSDT Forming Falling WedgeHIFIUSDT is currently displaying a classic falling wedge pattern, a powerful bullish technical setup that often precedes a major trend reversal. This pattern forms as price compresses within converging trendlines, indicating declining volatility and seller exhaustion. Falling wedges are known for their high breakout success rate, and the current structure on HIFIUSDT is pointing toward a potential explosive upside move once resistance is broken.
The volume profile also supports the bullish case. There has been a noticeable increase in buy-side activity around key support zones, reflecting renewed investor confidence and accumulation at lower levels. When paired with a falling wedge, this kind of volume behavior often marks the beginning of a strong upward rally. Traders and investors anticipating a breakout could potentially see a remarkable 490% to 500%+ gain if the momentum continues to build.
The market interest in HIFI is growing rapidly, with increased mentions across trading communities and social platforms. The fundamentals of the project, combined with this bullish technical setup, are attracting both short-term speculators and long-term holders. The current structure also aligns with historical breakout patterns seen in similar altcoins before major bull runs, making it a compelling chart to watch closely.
For technical traders, a confirmed breakout with above-average volume from the wedge resistance will likely trigger a wave of buying pressure. Managing entries on breakout retests and using proper stop levels will be key to navigating this setup with discipline.
✅ Show your support by hitting the like button and
✅ Leaving a comment below! (What is You opinion about this Coin)
Your feedback and engagement keep me inspired to share more insightful market analysis with you!
MORNING FORECASTING LESSONSIt's important to recognise that the position of our trades is just as critical as the entry point. We need to clearly understand how to get involved and have a solid grasp of our trade setups. of our trade setups!

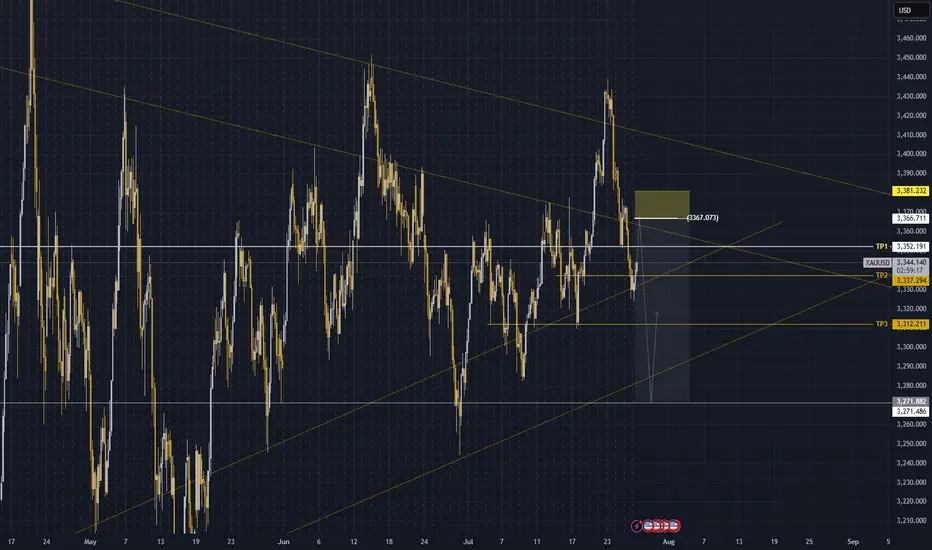
Gold (XAUUSD) Setup waiting sell zone at 3,367
Price is rebounding from key support around 3,312, and I’m expecting a corrective bounce toward 3,367 before resuming the downtrend.
🎯 Targets
TP1: 3,352
TP2: 3,337
Final target around 3,272
Final push into the yellow zone (3,367) could trigger the next sell setup.
🔻 If price fails to hold, the breakdown below 3,272 opens the way to deeper lows.
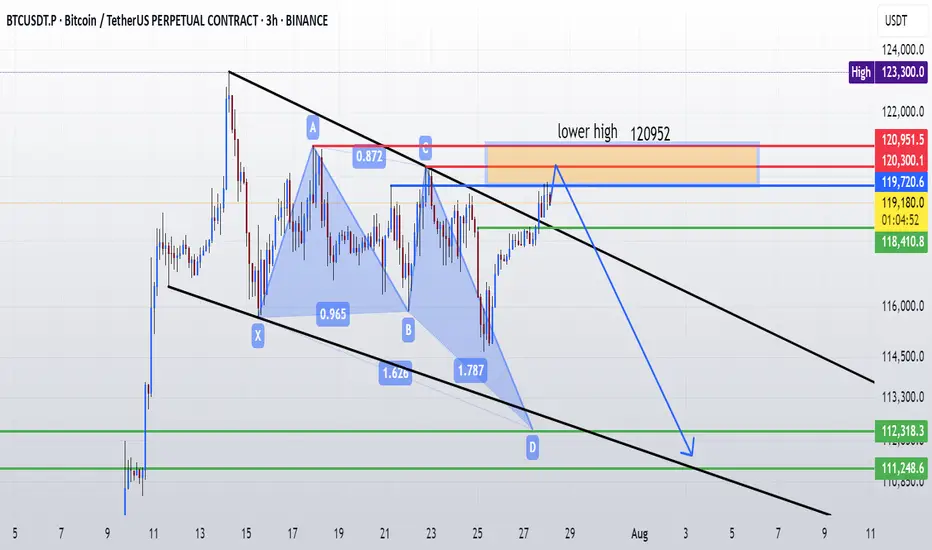
btcusdtbtc might form deep crab harmin pattern. so far our lower high is 120952 .until this level is breached we may go lower to 112 k area
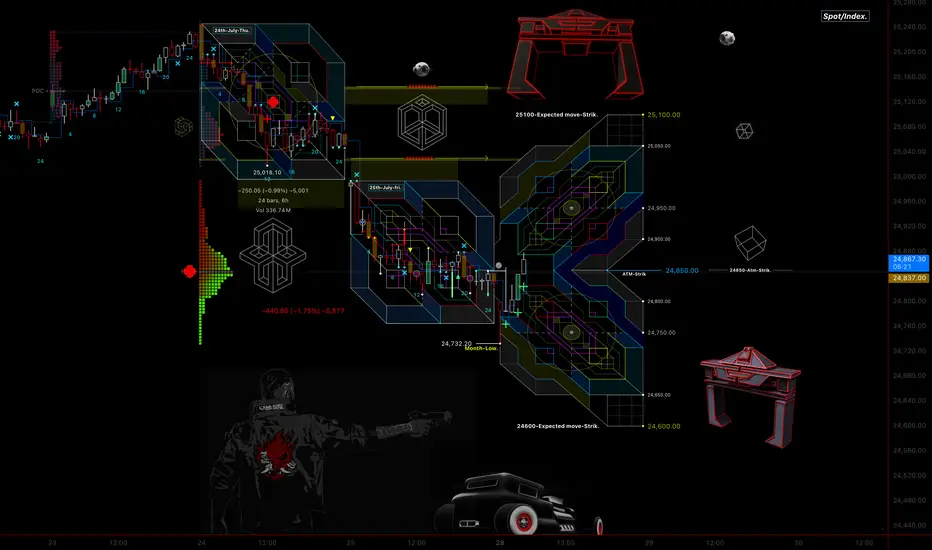
Nifty50 Index Monthly expiry week Grid projection.(July 2025)Hello everyone !!
Welcome to Nifty50 Index Grid projection for last week of July (Monthly expiry week)
this Grid is based on the Expected move reverse engineered from option pricing for the week
our market has been breaking the lows
today its been the lowest in the whole month
so expecting this to be not only the day's low but also the Month's low
Thank you
Grid-_-Work's.
safety first
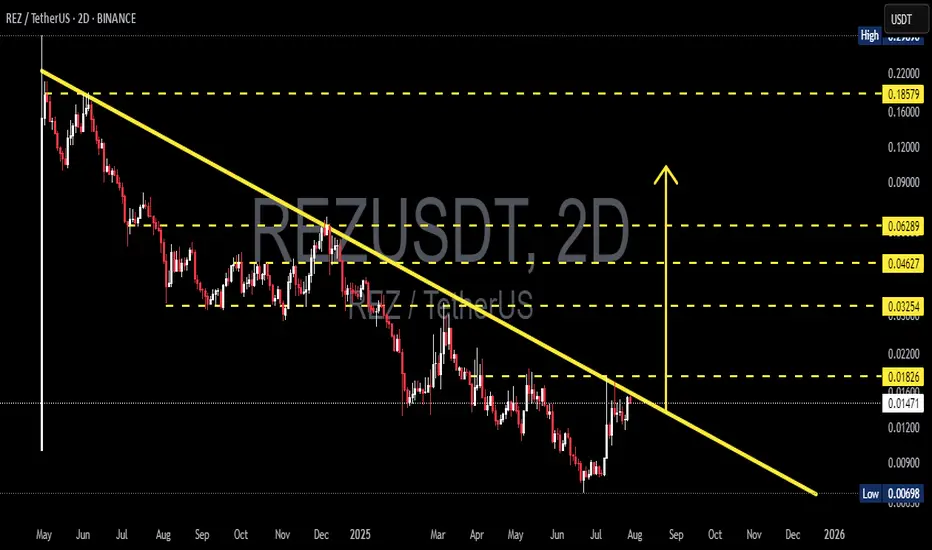
REZUSDT at a Critical Point– Testing a Major Long-Term TrendlineComplete Analysis:
The REZUSDT pair is currently showing a highly compelling setup, as price approaches a long-term descending trendline that has held since May 2024. This is a pivotal moment that could dictate the next significant move—either a bullish breakout or a bearish rejection continuation.
---
📉 Pattern and Structure
The chart is forming a large Descending Triangle pattern, with the descending trendline consistently pushing the price lower for over a year.
Price is now nearing a key horizontal resistance at approximately 0.01826 USDT, which also intersects with the long-term trendline.
The lowest support level sits at 0.00698 USDT, marking the bottom from a major previous decline.
---
📈 Bullish Scenario
If the price successfully breaks and closes above the trendline (~0.01826 USDT), then:
The next potential upside targets could be:
0.03254 USDT
0.04627 USDT
0.06289 USDT
This breakout could signal a trend reversal in the medium term, especially if accompanied by strong volume.
---
📉 Bearish Scenario
However, if the price gets rejected at this resistance area:
It could pull back toward:
The minor support at 0.01200 USDT
The major support at 0.00698 USDT
A rejection at this trendline would confirm the continuation of the bearish descending triangle pattern, which traditionally favors further downside.
---
🧠 Conclusion:
REZUSDT is currently in a make-or-break zone. The market’s reaction to the descending trendline will be crucial in determining the next move. Traders should monitor volume and wait for a solid candle confirmation before entering any position.
#REZUSDT #CryptoAnalysis #TechnicalAnalysis #AltcoinBreakout #DescendingTriangle #CryptoTrading #TrendlineBreak #SupportResistance #REZAnalysis #BreakoutWatch
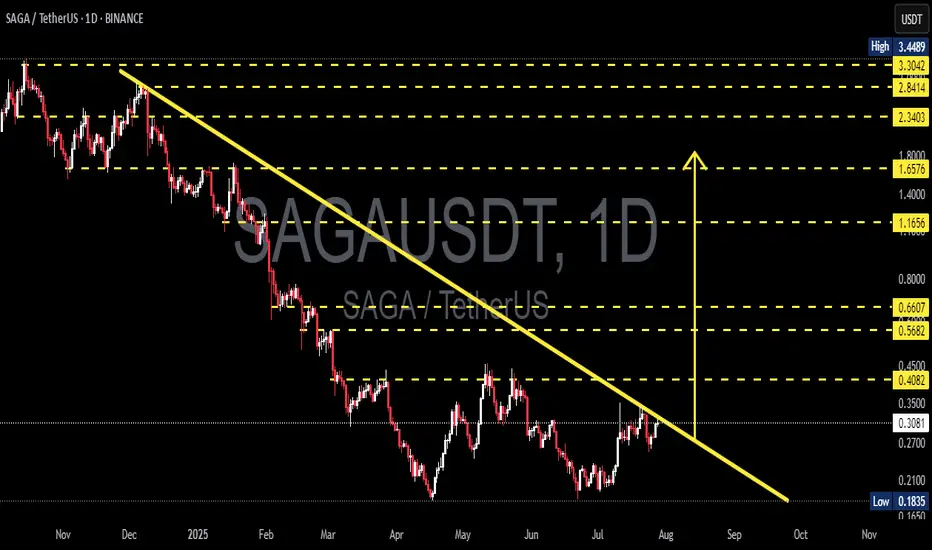
SAGAUSDT – Testing Major Trendline Resistance: Breakout?Chart Description:
SAGAUSDT (SAGA vs USDT) is currently retesting a long-term descending trendline (yellow line) that has acted as strong resistance since November 2024. The price is now approaching a critical zone, with potential for either a breakout or a strong rejection, which could define the next major move.
---
📊 Pattern & Structure Overview:
Downtrend Line (Major Resistance): The diagonal trendline reflects consistent bearish pressure over the past several months.
Current Price: ~0.30 USDT
Key Support Level: 0.1835 USDT (Yearly Low)
Immediate Resistance Zones: 0.3066 – 0.4082 USDT
Horizontal yellow lines indicate potential target levels if the price breaks out and sustains upward momentum.
---
🐂 Bullish Scenario:
A confirmed breakout above the trendline resistance would signal a possible trend reversal or a strong bullish continuation.
Bullish confirmation strengthens if the price breaks and holds above:
0.4082 (structural resistance)
0.5682 and 0.6607 (key mid-range resistance zones)
If momentum continues, extended targets lie around 1.1656 – 1.6576 USDT and beyond.
---
🐻 Bearish Scenario:
Failure to break the trendline or a clear rejection from this level could trigger another downward move.
Potential support zones include:
0.2700
0.2100
0.1835 (key yearly low)
A breakdown below 0.1835 may open the door for deeper bearish continuation.
---
🧠 Conclusion:
SAGAUSDT is at a critical decision point, approaching the descending trendline that has defined its bearish trend. A breakout could initiate a new bullish phase, while rejection could resume the downtrend. Watch for volume and price action over the coming days to confirm the direction.
#SAGAUSDT #CryptoBreakout #TrendlineResistance #AltcoinAnalysis #TechnicalAnalysis #CryptoTrading #BullishSetup #BearishSetup #SAGA #PriceAction
IOTA/USDT – Major Breakout from Long-Term Downtrend!📊 Chart Overview
After spending several months under pressure within a long-term descending trendline since December 2024, IOTA has finally shown a highly promising technical signal. The recent breakout didn’t just pierce the trendline — it was confirmed by a successful retest of the golden Fibonacci zone, a classic reversal trigger in technical analysis.
> This is a classic early sign of a potential trend reversal, often followed by strong momentum plays.
---
🧠 Structure & Pattern: Signs of a Macro Reversal
✅ Descending Trendline Breakout
Price has broken through a major downtrend line that had held for over 7 months, signaling a shift in market dynamics from sellers to buyers.
✅ Fibonacci Golden Pocket Retest (0.5–0.618)
The pullback landed perfectly at the golden pocket (0.2054–0.1931), a highly watched confluence area for reversals. Price bounced right from this support, showing buy-side strength.
✅ Demand Zone Activation
The yellow box highlights a previous accumulation zone that now acts as strong demand, reinforcing the potential for an upward continuation.
---
🟢 Bullish Scenario (Structured Upside Potential)
If the price holds above 0.2054:
Short-Term Targets:
📈 0.2542 → Minor resistance & previous breakout area
📈 0.2805 → Key psychological zone and past rejection area
Mid–Long-Term Targets:
💰 0.3144 → Historical resistance
💰 0.3983 → Fibonacci extension zone
💰 0.4946 → Final major resistance before the previous macro downtrend
Confirmation:
A daily candle close above 0.2542 with increasing volume would strongly validate the bullish continuation.
---
🔴 Bearish Scenario (Potential Fakeout Risk)
If the price fails to hold above the 0.1931 zone:
⚠️ It may turn into a fake breakout, indicating that buyers weren’t strong enough to sustain the breakout.
Downside targets to watch:
🧱 0.1700 → Minor psychological support
🧱 0.1308 → Previous macro low and critical support
---
🎯 Conclusion & Trading Strategy
IOTA is currently at a critical decision point, balancing between a confirmed macro reversal and a possible fakeout. However, the technical breakout above a long-standing trendline — combined with a retest of the golden pocket zone — puts bulls in a favorable position for a potential rally.
🔍 What to watch next:
Price action above 0.2200–0.2540
Volume confirmation on breakout levels
This setup is ideal for early trend traders, swing traders, or position traders looking to ride a larger bullish wave with well-defined risk.
#IOTAUSDT #CryptoBreakout #MacroReversal #FibonacciSupport #BullishSetup #AltcoinAnalysis #CryptoTechnicalAnalysis #TrendlineBreak #BuyTheDip
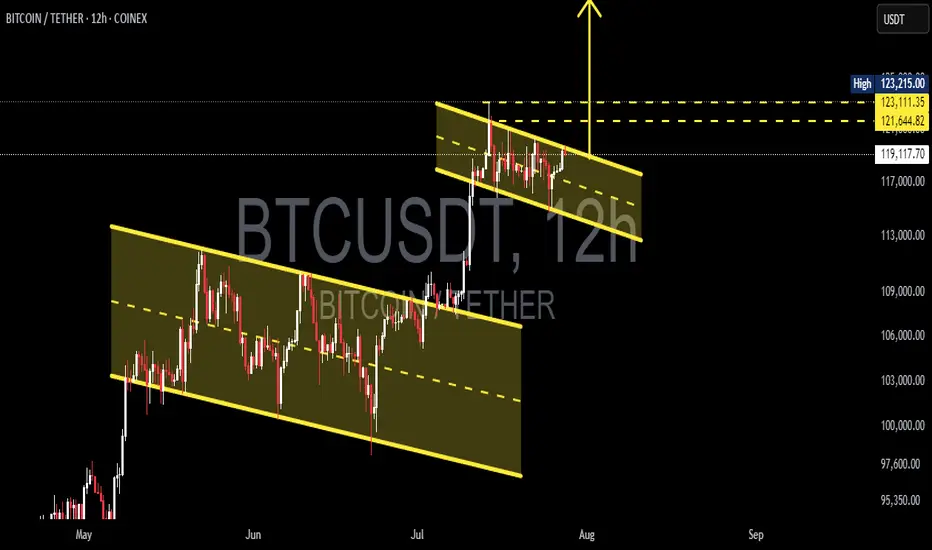
Double Bullish Flag on Bitcoin — Next Rally to $135K?📊 BTCUSDT (12H) In-Depth Analysis: Major Momentum Brewing
Bitcoin (BTC) is currently exhibiting a very promising technical structure — a Double Bullish Flag, a rare yet powerful continuation formation that often precedes strong upside momentum.
This dual-pattern structure reflects market strength and smart accumulation, with bulls maintaining control while allowing for healthy pauses before potential expansion to higher levels.
---
🔍 Technical Breakdown: Double Bullish Flag Structure
🔸 1. Primary Bullish Flag:
Formed after a sharp rally from around $95,000 to $113,000 (flagpole).
Price then consolidated within a clear descending channel, forming a classic Bullish Flag pattern.
Breakout from this pattern occurred in early July, confirming bullish continuation.
🔸 2. Secondary Bullish Flag (Mini Flag):
After the breakout from the main flag, BTC formed a second smaller flag pattern — a narrow descending channel from ~$123K to ~$119K.
This is known as bullish flag stacking — a pattern of "flag on top of flag", signaling trend strength and smart consolidation.
This mini-flag now acts as a launchpad for the next potential breakout.
---
🚀 Bullish Scenario: Preparing for a Breakout
If BTC breaks above the upper resistance of the mini flag (~$123,200), it will signal a fresh bullish continuation.
🎯 Potential Upside Targets:
Conservative target: $126,000 – $128,000
Full measured move target (from flagpole): $132,000 – $135,000
✅ Confirmation criteria:
Strong candle close above $123.2K
Accompanied by rising volume and upward RSI momentum (but not overbought)
---
🧨 Bearish Scenario: Breakdown and Retest
If BTC fails to break above the flag and instead drops below the flag support (~$119,400), we may see a short-term correction.
🔻 Key Support Levels:
$117,000 – minor horizontal support
$113,000 – $115,000 – strong demand zone and previous breakout area
⚠️ As long as price holds above $113K, the broader bullish trend remains intact. A pullback to this zone could offer a prime retest-buying opportunity.
---
📌 Key Price Levels to Watch:
Level Role
$123,200 Mini-flag resistance (breakout trigger)
$121,600 Mid-range resistance
$119,400 Flag support
$117,000 Horizontal retest zone
$113,000 Major support (trend invalidation if lost)
$132K – $135K Projected breakout target
---
💡 Conclusion: BTC in Critical Zone Before Potential Expansion
This Double Bullish Flag formation is one of the most technically constructive setups BTC has shown in weeks. It reflects a strong, patient market — with bulls preparing for another leg higher.
If the breakout from the second flag confirms, Bitcoin could rally toward $135,000, backed by momentum, volume, and clean structure. However, a breakdown would only signal a short-term cooldown unless support at $113K is lost.
🧭 Stay focused on breakout confirmation, volume spikes, and market sentiment. This could be the calm before a bullish storm.
#BTCUSDT #BitcoinBreakout #BullishFlag #TechnicalAnalysis #DoubleBullFlag #BTCMomentum #BitcoinRally #CryptoOutlook #BitcoinTo135K
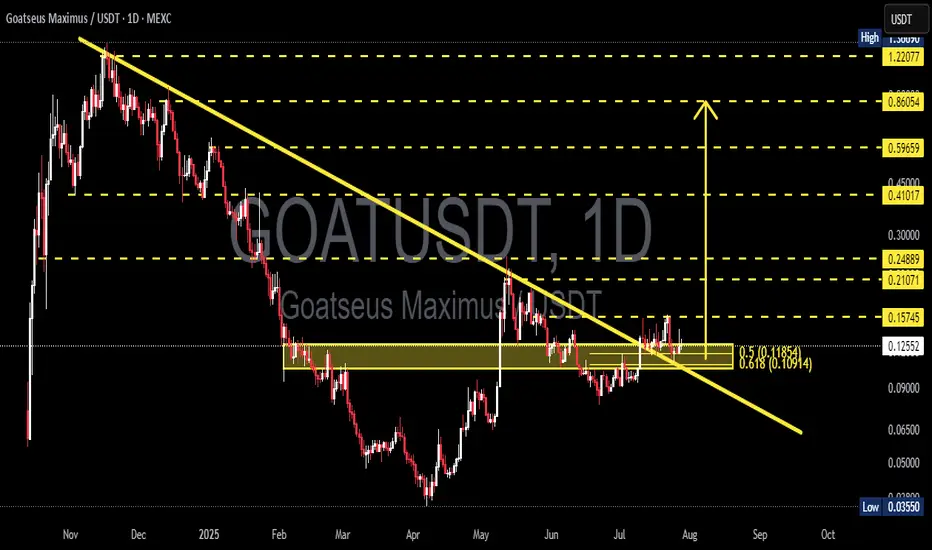
GOATUSDT Breakout Retest: Ready for the Next Bullish Leg?The daily chart of GOATUSDT reveals a significant technical development as price breaks out of a long-term descending trendline and is now performing a crucial retest of a key support zone. This movement is attracting attention from swing traders and mid-term investors alike.
---
🔍 Pattern Analysis & Market Structure
Main Pattern: Breakout from a long-standing descending trendline (yellow line) that has capped price action since November 2024.
Key Consolidation Zone: A visible accumulation area (yellow box) between 0.10914 (Fib 0.618) and 0.11864 (Fib 0.5), now being retested as new support.
Fibonacci Retracement: Applied from the peak to the bottom to identify logical target zones and potential resistance.
Breakout Confirmation: Price cleanly broke above the trendline, pulled back to retest support, and is showing signs of holding — a potential bullish continuation signal.
---
🟢 Bullish Scenario
If price holds above the 0.11–0.12 zone:
The breakout is validated and opens room for a continued rally.
Key upside targets based on Fibonacci levels:
🔼 0.15745 – first resistance
🔼 0.21071 to 0.24889 – mid-range resistance cluster
🔼 0.41017 to 0.86054 – longer-term price targets
Bullish confirmation via price action or volume spikes can solidify this outlook.
---
🔴 Bearish Scenario
If price fails to hold the support zone:
A breakdown below 0.10914 invalidates the breakout, indicating a false breakout trap.
Downside targets may include:
0.09000 – local support
0.06500 and 0.03550 – major historical support zones
This scenario would likely reignite bearish momentum.
---
⚠️ Conclusion
GOATUSDT is currently at a critical technical crossroad. The recent breakout and retest could signify a structural trend reversal. If the current support holds, the potential for upside is significant. However, a failure here could lead to deeper correction or consolidation.
---
📌 Key Levels to Watch:
Support: 0.109 – 0.118
Resistance: 0.15745 / 0.21071 / 0.24889 / 0.41017
#GOATUSDT #CryptoBreakout #TechnicalAnalysis #AltcoinSeason #TrendlineBreakout #SupportResistance #FibonacciLevels #SwingTrade #PriceAction #CryptoTA
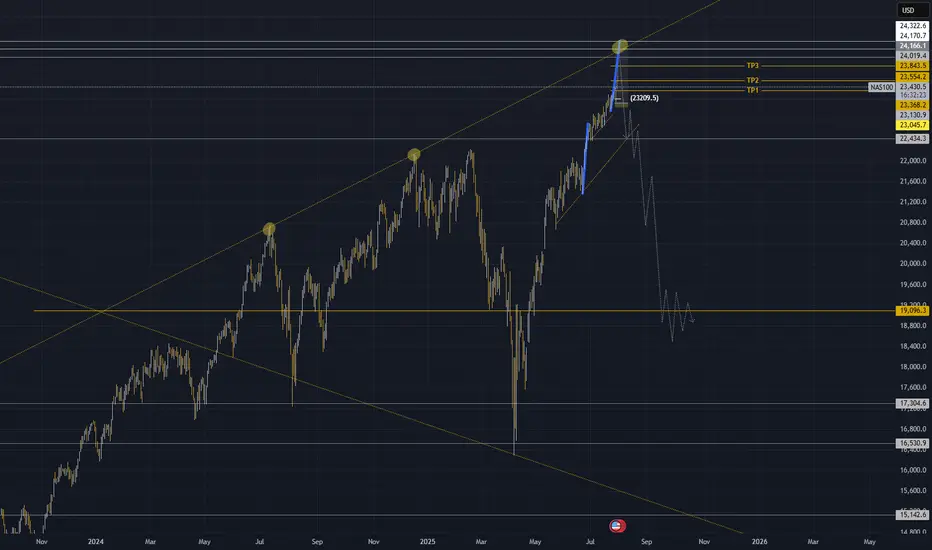
NAS100 Technical Outlook — Final Impulse Before the Fall?
The NAS100 has just completed its 5th touch on a long-term ascending trendline, forming a clear rising wedge pattern. Historically, each touch of this structure has triggered significant bearish reversals — and this time looks no different.
🔹 However, before the major drop, I'm expecting a final impulsive wave of around 1,000 pips— a last bullish move that could stretch toward the 24,300–24,400 zone. This would complete the wave structure and offer a strong sell opportunity.
🔻 After that, a deeper correction is likely, targeting the 19,000 area, which aligns perfectly with:
The midpoint of the wedge on the daily chart
A strong historical support zone
A potential area for medium-term consolidation
⚠️ As long as price remains below 24,400, the bearish scenario remains valid. Any daily close above that level would force a re-evaluation.
🧠 This setup reflects a classic distribution phase followed by a high-probability breakdown.
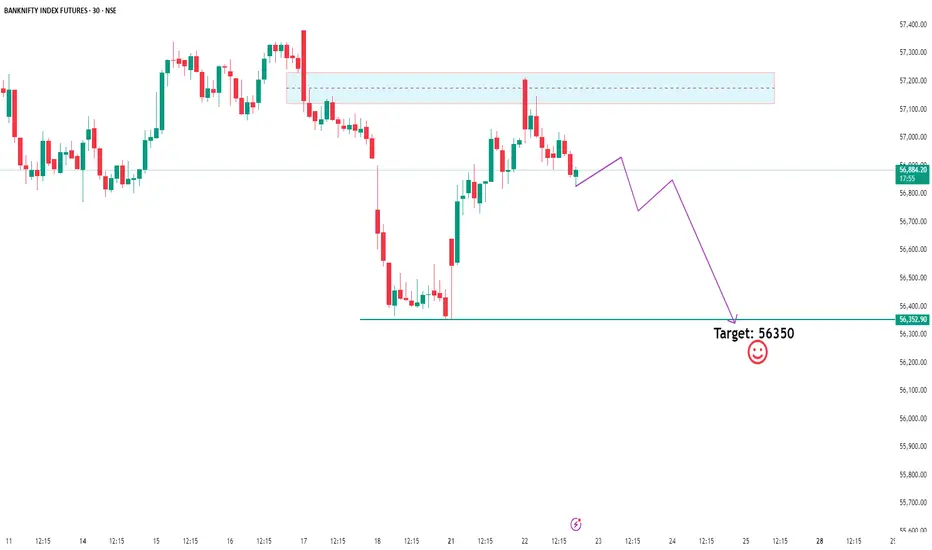
Bank Nifty Breakdown? Eyeing 56,350 –Time to Ride the Sell Wave!Bank Nifty is showing clear signs of distribution as Smart Money appears to be offloading positions near recent highs. Price has swept liquidity above the previous highs and is now rejecting key supply zones, confirming a potential sell-side shift in market structure.
With a break in internal structure and premium zones being respected, we're now watching the 56,350 level as a high-probability target for downside liquidity.
If you're trading with the Smart Money Concept in mind — this could be the move where retail gets trapped while institutions ride the wave down. Stay sharp and manage your risk accordingly. 👀🔥
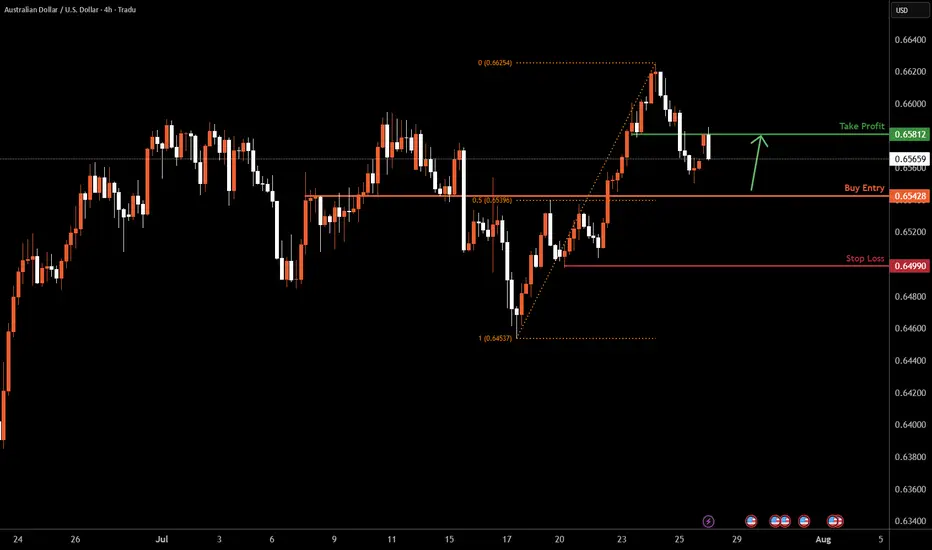
AUDUSD H4 I Bullish Bounce Off the 50% Fib Based on the H4 chart analysis, we can see that the price is falling toward our buy entry at 0.6542, which is a pullback support that aligns with the 50% Fib retracement.
Our take profit will be at 0.6581, an overlap resistance.
The stop loss will be placed at 0.6499, a swing low support.
High Risk Investment Warning
Trading Forex/CFDs on margin carries a high level of risk and may not be suitable for all investors. Leverage can work against you.
Stratos Markets Limited (tradu.com ):
CFDs are complex instruments and come with a high risk of losing money rapidly due to leverage. 66% of retail investor accounts lose money when trading CFDs with this provider. You should consider whether you understand how CFDs work and whether you can afford to take the high risk of losing your money.
Stratos Europe Ltd (tradu.com ):
CFDs are complex instruments and come with a high risk of losing money rapidly due to leverage. 66% of retail investor accounts lose money when trading CFDs with this provider. You should consider whether you understand how CFDs work and whether you can afford to take the high risk of losing your money.
Stratos Global LLC (tradu.com ):
Losses can exceed deposits.
Please be advised that the information presented on TradingView is provided to Tradu (‘Company’, ‘we’) by a third-party provider (‘TFA Global Pte Ltd’). Please be reminded that you are solely responsible for the trading decisions on your account. There is a very high degree of risk involved in trading. Any information and/or content is intended entirely for research, educational and informational purposes only and does not constitute investment or consultation advice or investment strategy. The information is not tailored to the investment needs of any specific person and therefore does not involve a consideration of any of the investment objectives, financial situation or needs of any viewer that may receive it. Kindly also note that past performance is not a reliable indicator of future results. Actual results may differ materially from those anticipated in forward-looking or past performance statements. We assume no liability as to the accuracy or completeness of any of the information and/or content provided herein and the Company cannot be held responsible for any omission, mistake nor for any loss or damage including without limitation to any loss of profit which may arise from reliance on any information supplied by TFA Global Pte Ltd.
The speaker(s) is neither an employee, agent nor representative of Tradu and is therefore acting independently. The opinions given are their own, constitute general market commentary, and do not constitute the opinion or advice of Tradu or any form of personal or investment advice. Tradu neither endorses nor guarantees offerings of third-party speakers, nor is Tradu responsible for the content, veracity or opinions of third-party speakers, presenters or participants.
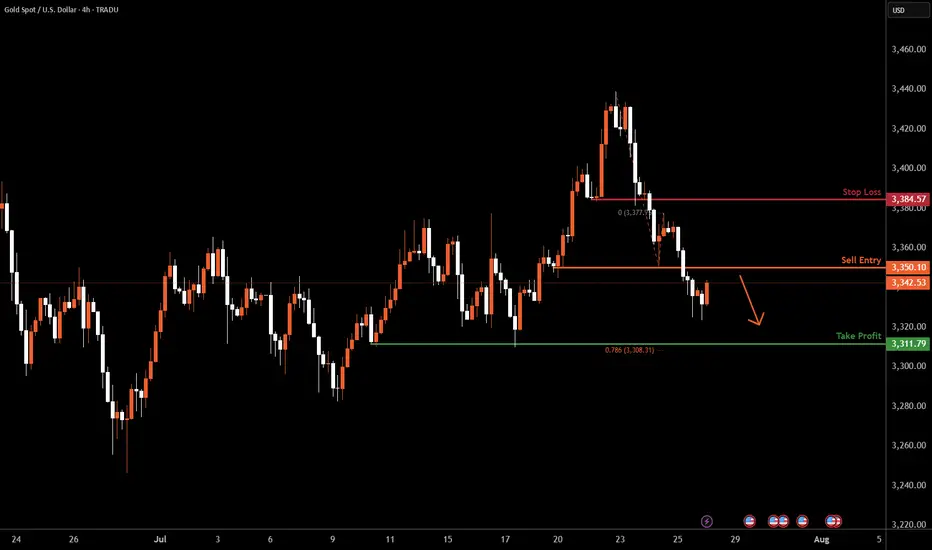
XAUUSD H4 | Bearish Reversal OffBased on the H4 chart analysis, we can see that the price is rising toward our sell entry at 3350.10, which is a pullback resistance.
Our take profit will be at 3311.79, a swing low support level.
The stop loss will be placed at 3384.57, a pullback resistance.
High Risk Investment Warning
Trading Forex/CFDs on margin carries a high level of risk and may not be suitable for all investors. Leverage can work against you.
Stratos Markets Limited (tradu.com ):
CFDs are complex instruments and come with a high risk of losing money rapidly due to leverage. 66% of retail investor accounts lose money when trading CFDs with this provider. You should consider whether you understand how CFDs work and whether you can afford to take the high risk of losing your money.
Stratos Europe Ltd (tradu.com ):
CFDs are complex instruments and come with a high risk of losing money rapidly due to leverage. 66% of retail investor accounts lose money when trading CFDs with this provider. You should consider whether you understand how CFDs work and whether you can afford to take the high risk of losing your money.
Stratos Global LLC (tradu.com ):
Losses can exceed deposits.
Please be advised that the information presented on TradingView is provided to Tradu (‘Company’, ‘we’) by a third-party provider (‘TFA Global Pte Ltd’). Please be reminded that you are solely responsible for the trading decisions on your account. There is a very high degree of risk involved in trading. Any information and/or content is intended entirely for research, educational and informational purposes only and does not constitute investment or consultation advice or investment strategy. The information is not tailored to the investment needs of any specific person and therefore does not involve a consideration of any of the investment objectives, financial situation or needs of any viewer that may receive it. Kindly also note that past performance is not a reliable indicator of future results. Actual results may differ materially from those anticipated in forward-looking or past performance statements. We assume no liability as to the accuracy or completeness of any of the information and/or content provided herein and the Company cannot be held responsible for any omission, mistake nor for any loss or damage including without limitation to any loss of profit which may arise from reliance on any information supplied by TFA Global Pte Ltd.
The speaker(s) is neither an employee, agent nor representative of Tradu and is therefore acting independently. The opinions given are their own, constitute general market commentary, and do not constitute the opinion or advice of Tradu or any form of personal or investment advice. Tradu neither endorses nor guarantees offerings of third-party speakers, nor is Tradu responsible for the content, veracity or opinions of third-party speakers, presenters or participants.
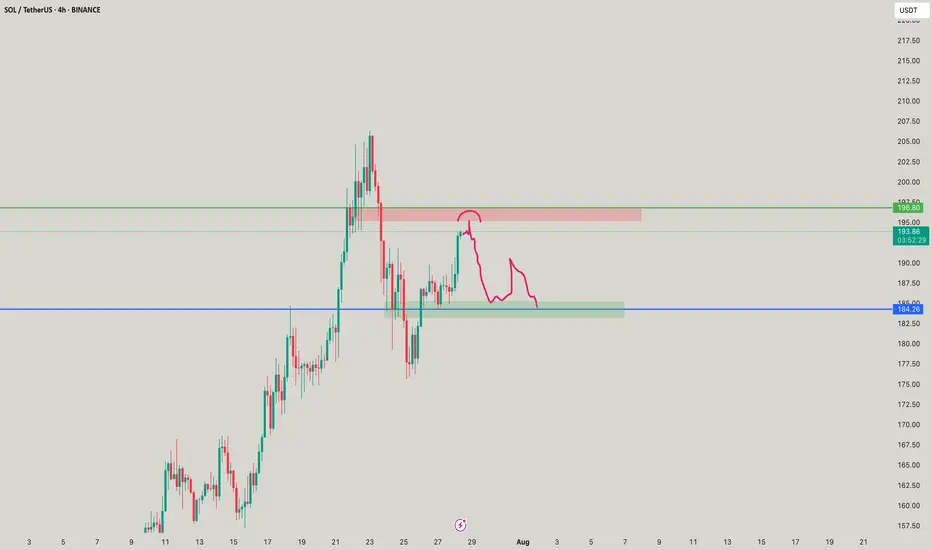
SOL - YOUR Choice of SOUL! LOLSOL as usual, pretty straight forward, short on the red, buy on the green, lines abbreviated for you to understand where
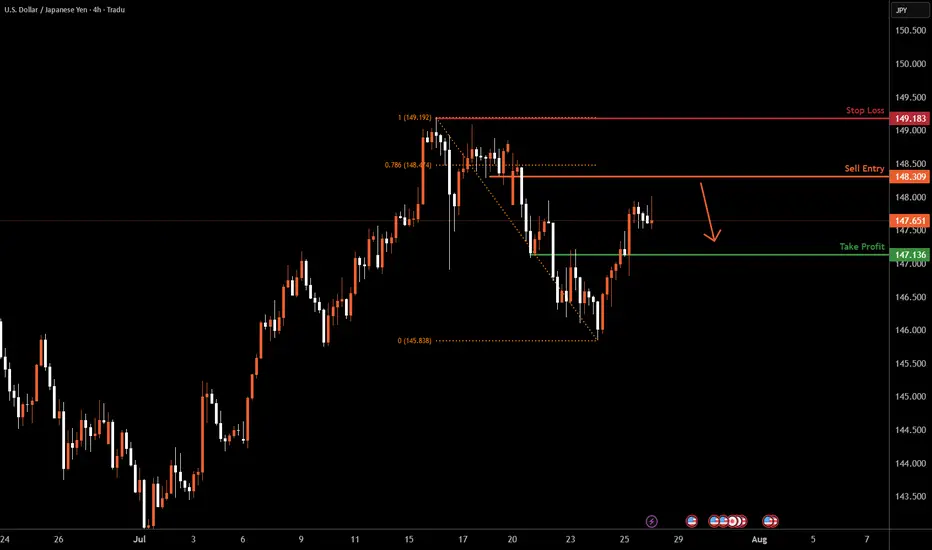
USDJPY H4 I Bearish Reversal off the 78.6% Based on the H4 chart analysis, we can see that the price is rising toward our sell entry at 148.30, which is a pullback resistance that aligns closely with the 78.6% Fibo retracement.
Our take profit will be at 147.13, a pullback support level.
The stop loss will be placed at 149.18, a swing-high resistance level.
High Risk Investment Warning
Trading Forex/CFDs on margin carries a high level of risk and may not be suitable for all investors. Leverage can work against you.
Stratos Markets Limited (tradu.com ):
CFDs are complex instruments and come with a high risk of losing money rapidly due to leverage. 66% of retail investor accounts lose money when trading CFDs with this provider. You should consider whether you understand how CFDs work and whether you can afford to take the high risk of losing your money.
Stratos Europe Ltd (tradu.com ):
CFDs are complex instruments and come with a high risk of losing money rapidly due to leverage. 66% of retail investor accounts lose money when trading CFDs with this provider. You should consider whether you understand how CFDs work and whether you can afford to take the high risk of losing your money.
Stratos Global LLC (tradu.com ):
Losses can exceed deposits.
Please be advised that the information presented on TradingView is provided to Tradu (‘Company’, ‘we’) by a third-party provider (‘TFA Global Pte Ltd’). Please be reminded that you are solely responsible for the trading decisions on your account. There is a very high degree of risk involved in trading. Any information and/or content is intended entirely for research, educational and informational purposes only and does not constitute investment or consultation advice or investment strategy. The information is not tailored to the investment needs of any specific person and therefore does not involve a consideration of any of the investment objectives, financial situation or needs of any viewer that may receive it. Kindly also note that past performance is not a reliable indicator of future results. Actual results may differ materially from those anticipated in forward-looking or past performance statements. We assume no liability as to the accuracy or completeness of any of the information and/or content provided herein and the Company cannot be held responsible for any omission, mistake nor for any loss or damage including without limitation to any loss of profit which may arise from reliance on any information supplied by TFA Global Pte Ltd.
The speaker(s) is neither an employee, agent nor representative of Tradu and is therefore acting independently. The opinions given are their own, constitute general market commentary, and do not constitute the opinion or advice of Tradu or any form of personal or investment advice. Tradu neither endorses nor guarantees offerings of third-party speakers, nor is Tradu responsible for the content, veracity or opinions of third-party speakers, presenters or participants.
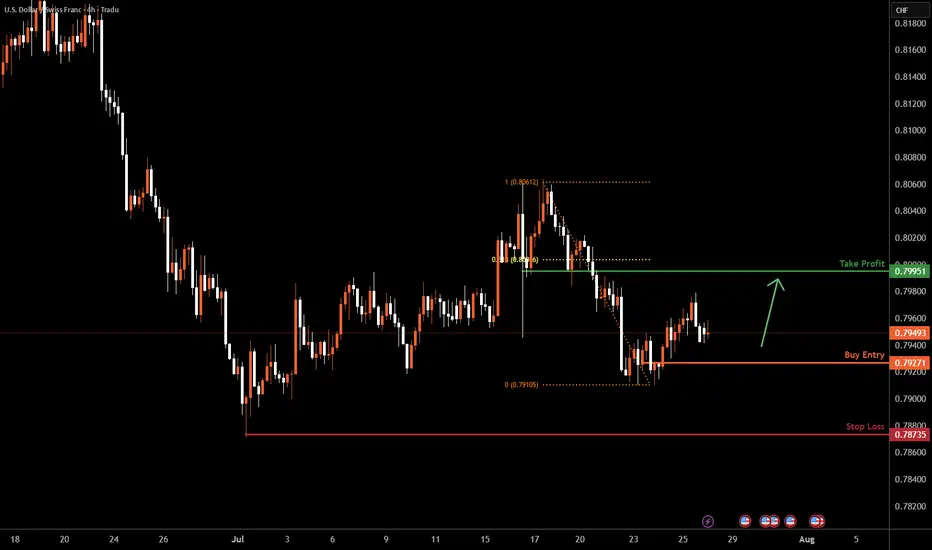
USDCHF H4 I Bullish Bounce Off Based on the H4 chart analysis, we can see that the price is falling toward our buy entry at 0.7927, which is a pullback support.
Our take profit will be at 0.7995, which is a pullback resistance that aligns closely with the 61.8% Fib retracement.
The stop loss will be placed at 0.7873, a swing low support.
High Risk Investment Warning
Trading Forex/CFDs on margin carries a high level of risk and may not be suitable for all investors. Leverage can work against you.
Stratos Markets Limited (tradu.com ):
CFDs are complex instruments and come with a high risk of losing money rapidly due to leverage. 66% of retail investor accounts lose money when trading CFDs with this provider. You should consider whether you understand how CFDs work and whether you can afford to take the high risk of losing your money.
Stratos Europe Ltd (tradu.com ):
CFDs are complex instruments and come with a high risk of losing money rapidly due to leverage. 66% of retail investor accounts lose money when trading CFDs with this provider. You should consider whether you understand how CFDs work and whether you can afford to take the high risk of losing your money.
Stratos Global LLC (tradu.com ):
Losses can exceed deposits.
Please be advised that the information presented on TradingView is provided to Tradu (‘Company’, ‘we’) by a third-party provider (‘TFA Global Pte Ltd’). Please be reminded that you are solely responsible for the trading decisions on your account. There is a very high degree of risk involved in trading. Any information and/or content is intended entirely for research, educational and informational purposes only and does not constitute investment or consultation advice or investment strategy. The information is not tailored to the investment needs of any specific person and therefore does not involve a consideration of any of the investment objectives, financial situation or needs of any viewer that may receive it. Kindly also note that past performance is not a reliable indicator of future results. Actual results may differ materially from those anticipated in forward-looking or past performance statements. We assume no liability as to the accuracy or completeness of any of the information and/or content provided herein and the Company cannot be held responsible for any omission, mistake nor for any loss or damage including without limitation to any loss of profit which may arise from reliance on any information supplied by TFA Global Pte Ltd.
The speaker(s) is neither an employee, agent nor representative of Tradu and is therefore acting independently. The opinions given are their own, constitute general market commentary, and do not constitute the opinion or advice of Tradu or any form of personal or investment advice. Tradu neither endorses nor guarantees offerings of third-party speakers, nor is Tradu responsible for the content, veracity or opinions of third-party speakers, presenters or participants.