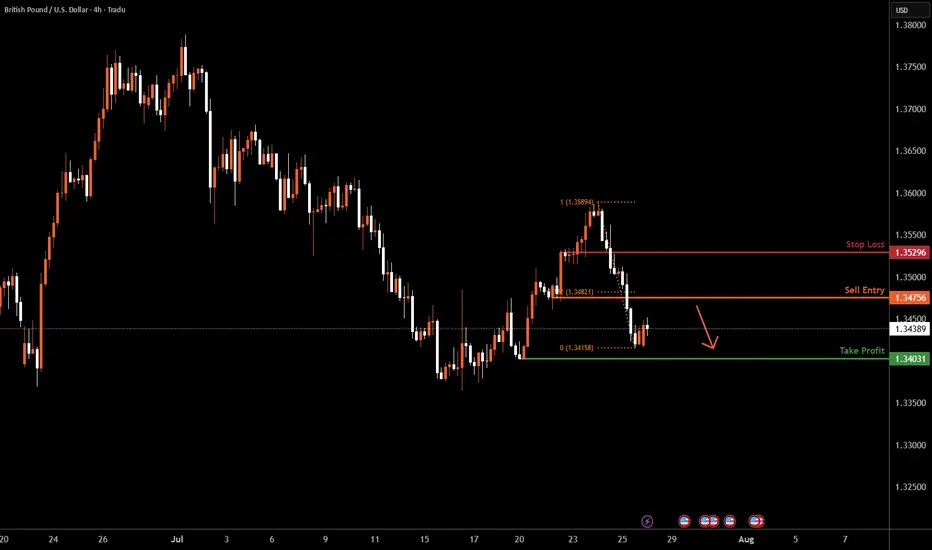
GBPUSD H4 I Bearish Continuation?Based on the H4 chart analysis, we can see that the price is rising toward our sell entry at 1.3475, which is a pullback resistance aligning with a 38.2% Fibo retracement.
Our take profit will be at 1.3403, a swing low support level.
The stop loss will be placed at 1.3529, a pullback support.
High Risk Investment Warning
Trading Forex/CFDs on margin carries a high level of risk and may not be suitable for all investors. Leverage can work against you.
Stratos Markets Limited (tradu.com ):
CFDs are complex instruments and come with a high risk of losing money rapidly due to leverage. 66% of retail investor accounts lose money when trading CFDs with this provider. You should consider whether you understand how CFDs work and whether you can afford to take the high risk of losing your money.
Stratos Europe Ltd (tradu.com ):
CFDs are complex instruments and come with a high risk of losing money rapidly due to leverage. 66% of retail investor accounts lose money when trading CFDs with this provider. You should consider whether you understand how CFDs work and whether you can afford to take the high risk of losing your money.
Stratos Global LLC (tradu.com ):
Losses can exceed deposits.
Please be advised that the information presented on TradingView is provided to Tradu (‘Company’, ‘we’) by a third-party provider (‘TFA Global Pte Ltd’). Please be reminded that you are solely responsible for the trading decisions on your account. There is a very high degree of risk involved in trading. Any information and/or content is intended entirely for research, educational and informational purposes only and does not constitute investment or consultation advice or investment strategy. The information is not tailored to the investment needs of any specific person and therefore does not involve a consideration of any of the investment objectives, financial situation or needs of any viewer that may receive it. Kindly also note that past performance is not a reliable indicator of future results. Actual results may differ materially from those anticipated in forward-looking or past performance statements. We assume no liability as to the accuracy or completeness of any of the information and/or content provided herein and the Company cannot be held responsible for any omission, mistake nor for any loss or damage including without limitation to any loss of profit which may arise from reliance on any information supplied by TFA Global Pte Ltd.
The speaker(s) is neither an employee, agent nor representative of Tradu and is therefore acting independently. The opinions given are their own, constitute general market commentary, and do not constitute the opinion or advice of Tradu or any form of personal or investment advice. Tradu neither endorses nor guarantees offerings of third-party speakers, nor is Tradu responsible for the content, veracity or opinions of third-party speakers, presenters or participants.
Harmonic Patterns
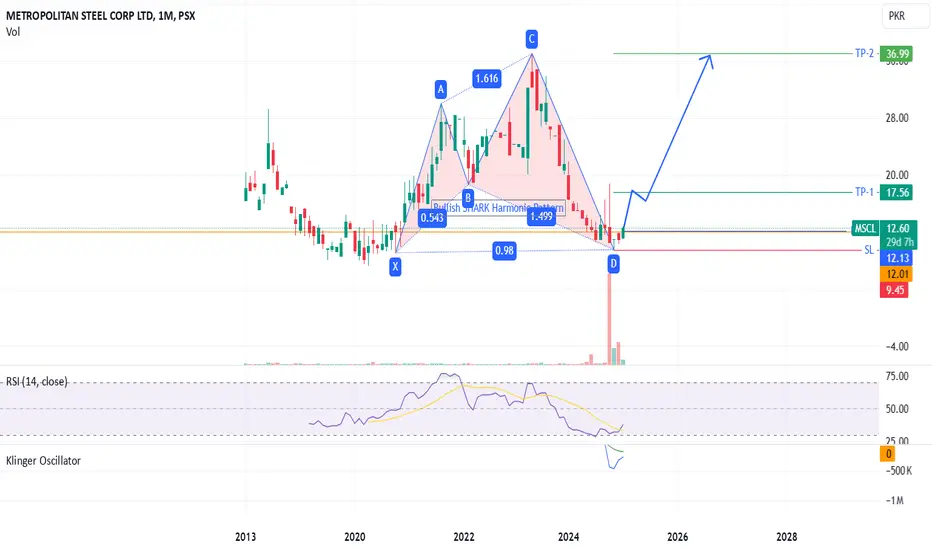
MSCL - PSX - Buy Trade Call - Bullish SHARK Harmonic PatternOn monthly TF, MSCL has completed the Bullish SHARK harmonic pattern (93% compliant). Now it has started its reversal journey and is at ideal price to buy for substantial gains in couple of months. RSI is at 35 level moving upwards. KVO is although below zero level but has started to look upwards as well. As soon as KVO Blue line crosses the trigger Green line sharp bull run will begin.
Trade Values
Buy: 12.70 (current Market price)
TP-1: 17.56 (60% gain by mid March 2025)
TP-2: 36.99 (300% gain by end Sep 2026)
SL: 9.45
#Bitcoin – What’s Really Happening? Daily Structure + Macro#Bitcoin – What’s Really Happening?
Daily Structure + Macro Setup = Big Move Loading
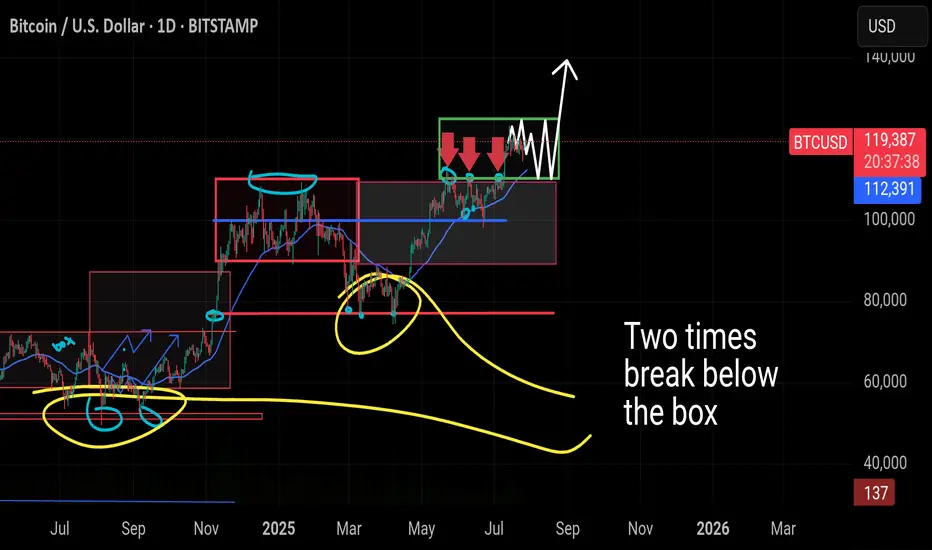
🔸 1D Chart: CRYPTOCAP:BTC Range-Bound Between $125K–$110K
Bitcoin is currently trading inside a tight sideways range, marked by resistance near $125,000 and support around $110,000. This is now the third time we've seen price consolidate in this green zone.
🔸 In the previous two attempts, BTC briefly dipped below support before quickly reclaiming the level — classic fakeouts, not real breakdowns. The current price behavior mirrors that same structure.
🔸 What If CRYPTOCAP:BTC Drops Again?
A dip below $110K or even toward $100K should not trigger panic. Historically, these wicks below the range are liquidity grabs — not signs of weakness. As long as the 200 MA holds and price doesn’t sustain under $100K, the macro trend remains bullish.
🔸 Key Zones:
– Immediate support: $112,398
– Major support: $100K psychological level
– Structure invalidation: Sustained loss below $100K (not expected)
🔸 Macro Outlook: Still Bullish
While BTC chops sideways, the broader environment is heating up:
🔸 Trump-EU Mega Trade Deal
Markets just got a major catalyst — a massive U.S.–EU agreement that includes:
– $750B in U.S. energy exports
– $600B in EU investment
– $150B in energy purchases from U.S.
This clears out tariff fears and opens the door for stocks and crypto to run. Risk appetite is returning fast.
🔸 Whale Activity Panic = Noise
Galaxy Digital wallet movement spooked the market temporarily, pushing BTC to $114,500. But zoom out:
– ETF inflows still dominate daily sell volume
– BlackRock continues absorbing supply
– Long-term whales haven’t sold — they’re holding
This was not a breakdown. It was a shakeout. Accumulation is still happening.
🔸 The Real Fuel: M2 Money Supply
Here’s where things really align for the bulls:
– In 2020, a 25% rise in M2 → BTC 800% rally
– In 2025 so far: +2.3% increase, and we’re still in “tightening”
– Largest M2 spike: +0.63% in June
Given BTC typically lags M2 by 60–90 days, the June print is setting up for a 15–17.5% upside over the coming weeks. That puts us on a clear path toward $130,000+
🔸 Bitcoin is sideways, not weak. Range-bound price action is accumulation, not distribution. Macro signals are aligning, M2 is expanding, and whale panic was short-lived.
We’re not just holding a range — we’re coiling for the breakout.
You’re early. Stay ready.
#bitcoin
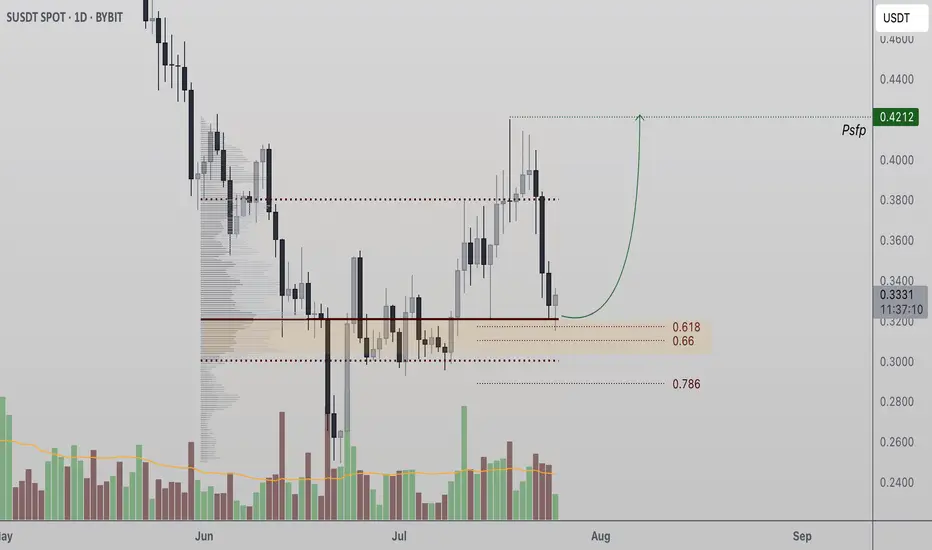
Sonic Token Tests Critical Support at Point of Control Sonic Token (S) is holding a major confluence support zone that could act as the foundation for a bullish reversal. A strong bounce here may lead to a retest of the $0.42 swing high.
Sonic Token (S) has corrected into a significant support region, aligning with both the Point of Control (POC) and the 0.618 Fibonacci retracement level. This confluence of technical factors marks a decisive zone where the current bullish structure could either confirm or break down. For bulls to remain in control, price must continue closing daily candles above this support in the coming sessions.
Key Technical Points:
- Key Support Zone: POC and 0.618 Fibonacci retracement form a strong support base
- Market Structure at Risk: Losing support would invalidate the current bullish structure
- Upside Target at $0.42: A reclaim of the swing high confirms continuation with a higher high
This level has become a make-or-break point for Sonic Token’s trend. From a structural perspective, holding this zone would confirm a higher low, preserving the uptrend and increasing the likelihood of a rotation toward the swing high at $0.42. Multiple high time frame indicators now intersect at this support region, making it a vital area for bulls to defend.
The volume profile supports this level’s importance, as historical price action shows significant accumulation and trade density in this range. So far, there are signs that support is holding — but what’s missing is a consistent pattern of daily candle closes above this level. Until that happens, any bounce should be viewed with cautious optimism rather than full confirmation.
If Sonic Token fails to maintain this level, the market risks entering a deeper corrective phase, potentially breaking below the bullish structure that’s been in place since the last major swing low. This would delay any retest of $0.42 and could invite further selling pressure.
On the other hand, if the token manages to hold the confluence zone and reclaim momentum, a move back toward $0.42 would not only retest the previous high but potentially trigger a breakout and continuation of the larger bullish trend. What’s needed now is clear evidence of strength, both in candle structure and volume support.
What to Expect in the Coming Price Action
Sonic Token needs to hold its current support zone on a daily close basis to maintain bullish structure. If it does, a rotation toward $0.42 is likely. A breakdown risks a deeper correction.
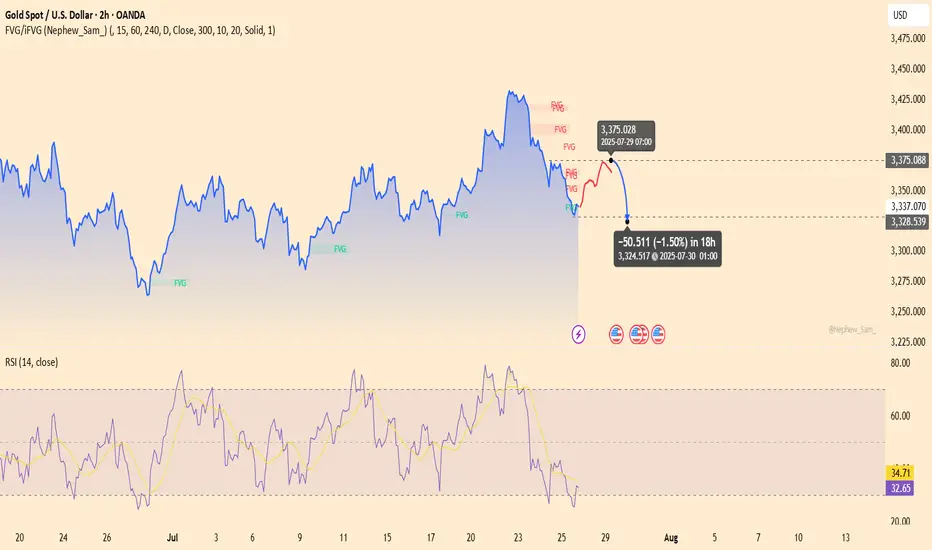
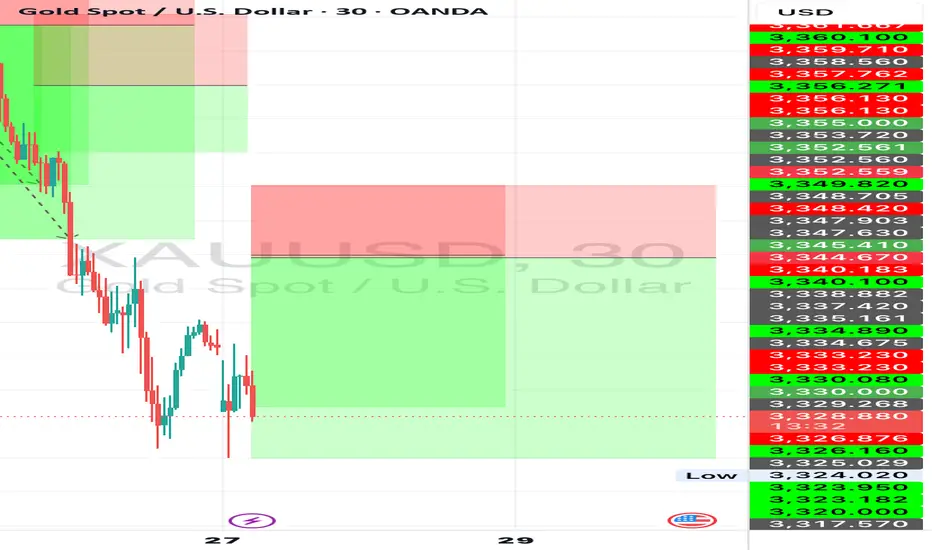
XAUUSD – The assassin returnsGold is showing a weak reaction around the 3,375 zone — a previous supply area — with RSI dipping into oversold territory but failing to bounce significantly. The chart reveals layered FVG traps, hinting at a potential -1.5% drop toward 3,324 within the next 18 hours.
Bearish catalyst: The U.S. jobless claims have dropped to a 3-month low → labor market remains strong → Fed likely to keep interest rates high → stronger USD, weaker gold.
Preferred setup:
SELL if price gets rejected at 3,375
SL: 3,390
TP: 3,324 – 3,310
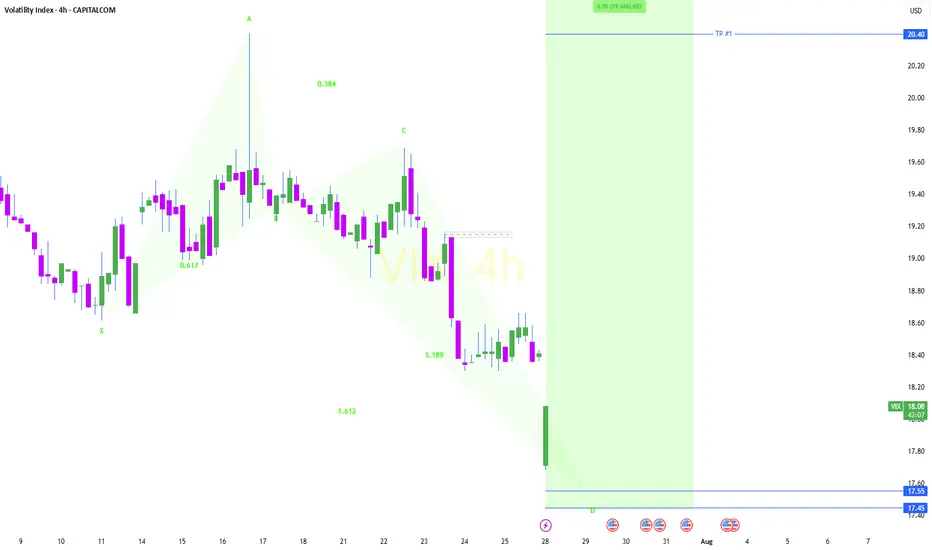
VIX Crab VIX is likely to rise from $17.4 upon reaching it, positioned at the leg of the Crab Pattern, potentially advancing towards the targets (TP #1 - TP #3).
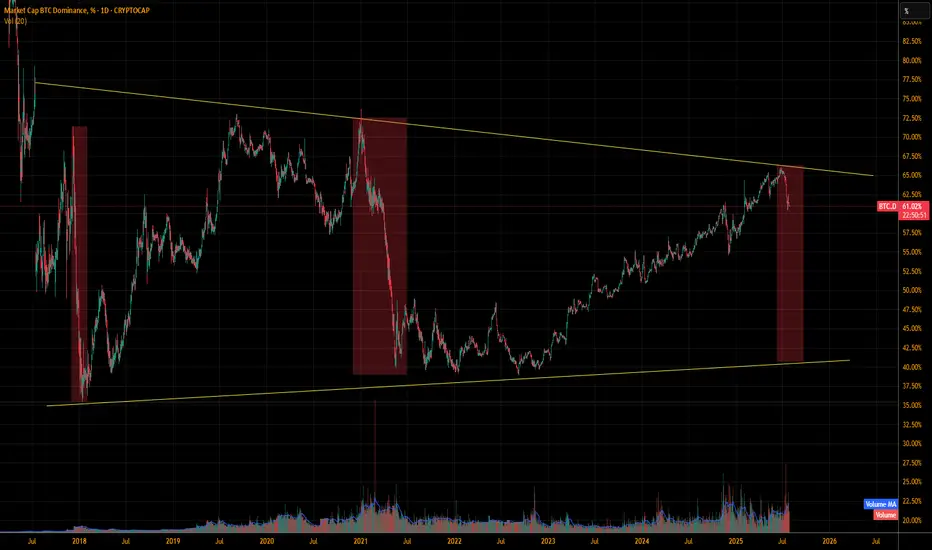
ALT SeasonWhat are these red boxes indicating guys?
Lets hope for the best. Next few months approx. through range analysis are good for the alts.
You guys can check through back-testing whenever the BTC.D falls the ALTS rise.
We are at the top and we might free fall from here.
Keep Following me for more. Show your support i will post the best ALTS analysis. Message me to know more.
Follow me = Support me = encouragement = more analysis.
We all need something to get something.
BTC | Long | Target: + 121500This technical analysis is for informational and educational purposes only. It does not constitute financial advice. Remember to always research and consult with a professional before making investment decisions. Good luck! 📈💼🚀
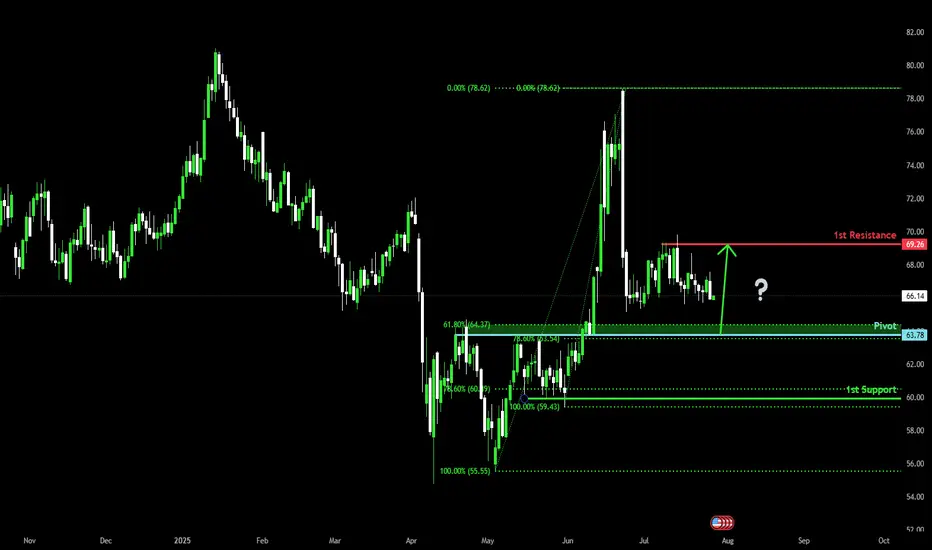
Bullish bounce off pullback support?WTI Oil (XTI/USD) is falling towards the pivot, which has been identified as a pullback support and could bounce to the 1st resistance.
Pivot: 63.78
1st Support: 59.94
1st Resistance: 69.26
Risk Warning:
Trading Forex and CFDs carries a high level of risk to your capital and you should only trade with money you can afford to lose. Trading Forex and CFDs may not be suitable for all investors, so please ensure that you fully understand the risks involved and seek independent advice if necessary.
Disclaimer:
The above opinions given constitute general market commentary, and do not constitute the opinion or advice of IC Markets or any form of personal or investment advice.
Any opinions, news, research, analyses, prices, other information, or links to third-party sites contained on this website are provided on an "as-is" basis, are intended only to be informative, is not an advice nor a recommendation, nor research, or a record of our trading prices, or an offer of, or solicitation for a transaction in any financial instrument and thus should not be treated as such. The information provided does not involve any specific investment objectives, financial situation and needs of any specific person who may receive it. Please be aware, that past performance is not a reliable indicator of future performance and/or results. Past Performance or Forward-looking scenarios based upon the reasonable beliefs of the third-party provider are not a guarantee of future performance. Actual results may differ materially from those anticipated in forward-looking or past performance statements. IC Markets makes no representation or warranty and assumes no liability as to the accuracy or completeness of the information provided, nor any loss arising from any investment based on a recommendation, forecast or any information supplied by any third-party.
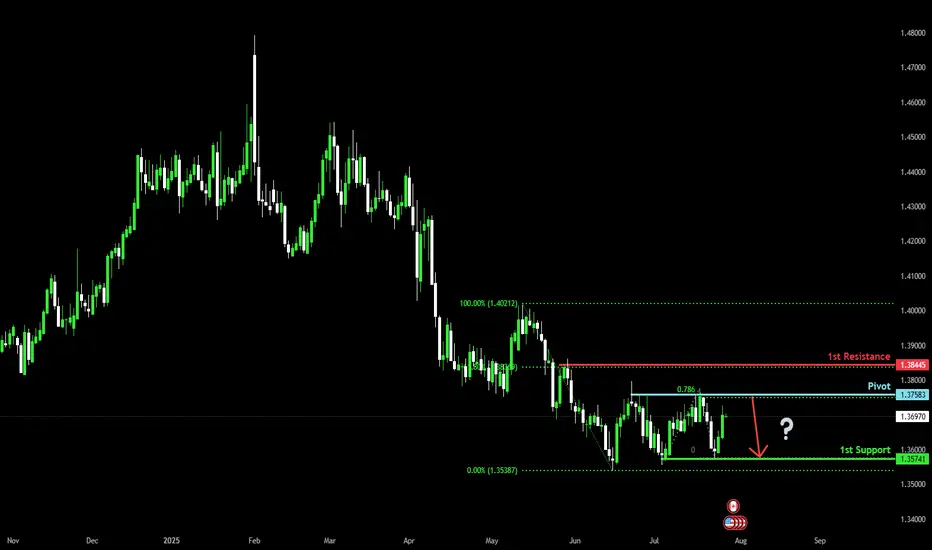
Heading into multi swing high resistance?The Loonie (USD/CAD) is rising towards the pivot and could reverse to the 1st support, which acts as a multi-swing high support.
Pivot: 1.3758
1st Support: 1.3574
1st Resistance: 1.3844
Risk Warning:
Trading Forex and CFDs carries a high level of risk to your capital and you should only trade with money you can afford to lose. Trading Forex and CFDs may not be suitable for all investors, so please ensure that you fully understand the risks involved and seek independent advice if necessary.
Disclaimer:
The above opinions given constitute general market commentary, and do not constitute the opinion or advice of IC Markets or any form of personal or investment advice.
Any opinions, news, research, analyses, prices, other information, or links to third-party sites contained on this website are provided on an "as-is" basis, are intended only to be informative, is not an advice nor a recommendation, nor research, or a record of our trading prices, or an offer of, or solicitation for a transaction in any financial instrument and thus should not be treated as such. The information provided does not involve any specific investment objectives, financial situation and needs of any specific person who may receive it. Please be aware, that past performance is not a reliable indicator of future performance and/or results. Past Performance or Forward-looking scenarios based upon the reasonable beliefs of the third-party provider are not a guarantee of future performance. Actual results may differ materially from those anticipated in forward-looking or past performance statements. IC Markets makes no representation or warranty and assumes no liability as to the accuracy or completeness of the information provided, nor any loss arising from any investment based on a recommendation, forecast or any information supplied by any third-party.
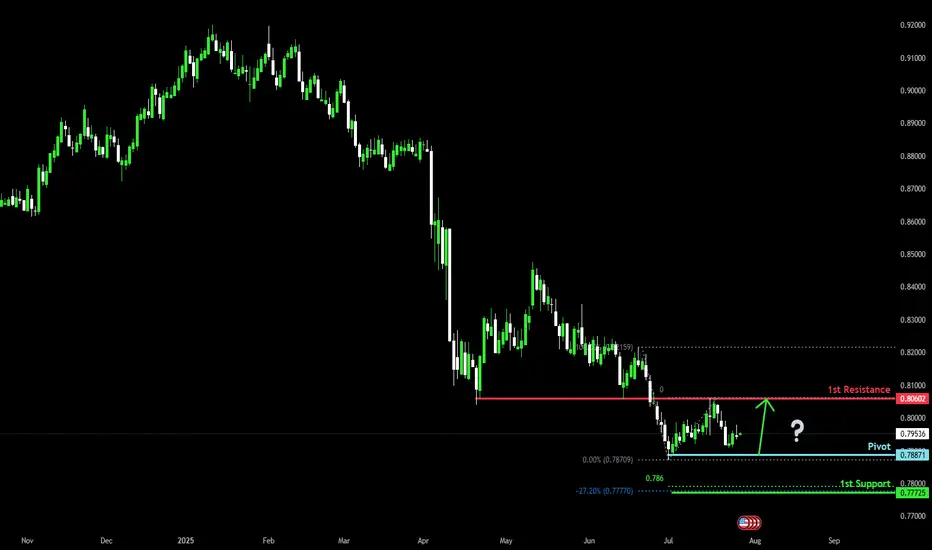
Could the Swissie bounce from here?The price is falling towards the pivot, which has been identified as a swing low support, and could bounce to the 1st resistance, which is an overlap resistance.
Pivot: 0.7887
1st Support: 0.7772
1st Resistance: 0.8060
Risk Warning:
Trading Forex and CFDs carries a high level of risk to your capital and you should only trade with money you can afford to lose. Trading Forex and CFDs may not be suitable for all investors, so please ensure that you fully understand the risks involved and seek independent advice if necessary.
Disclaimer:
The above opinions given constitute general market commentary, and do not constitute the opinion or advice of IC Markets or any form of personal or investment advice.
Any opinions, news, research, analyses, prices, other information, or links to third-party sites contained on this website are provided on an "as-is" basis, are intended only to be informative, is not an advice nor a recommendation, nor research, or a record of our trading prices, or an offer of, or solicitation for a transaction in any financial instrument and thus should not be treated as such. The information provided does not involve any specific investment objectives, financial situation and needs of any specific person who may receive it. Please be aware, that past performance is not a reliable indicator of future performance and/or results. Past Performance or Forward-looking scenarios based upon the reasonable beliefs of the third-party provider are not a guarantee of future performance. Actual results may differ materially from those anticipated in forward-looking or past performance statements. IC Markets makes no representation or warranty and assumes no liability as to the accuracy or completeness of the information provided, nor any loss arising from any investment based on a recommendation, forecast or any information supplied by any third-party.
GOLD stage is "downgraded" treatmentMarket confidence is gradually repairing, from a number of markets reflected in the panic indicators decline, liquidity can be known, risk aversion demand then weakened. Gold, as a defensive asset, is gradually losing its short-term support.
The signal is not only reflected in the transaction data, but also reflected in the social public opinion of the decline in the heat of gold. From our sentiment engine judgment, gold stage is "downgraded" treatment, institutional configuration strategy tends to wait and see or shrink positions.
The operation suggestion is to avoid, before the risk appetite falls again, the performance space of gold is limited. Positions can be controlled in a low-exposure state, reserved for operational flexibility.
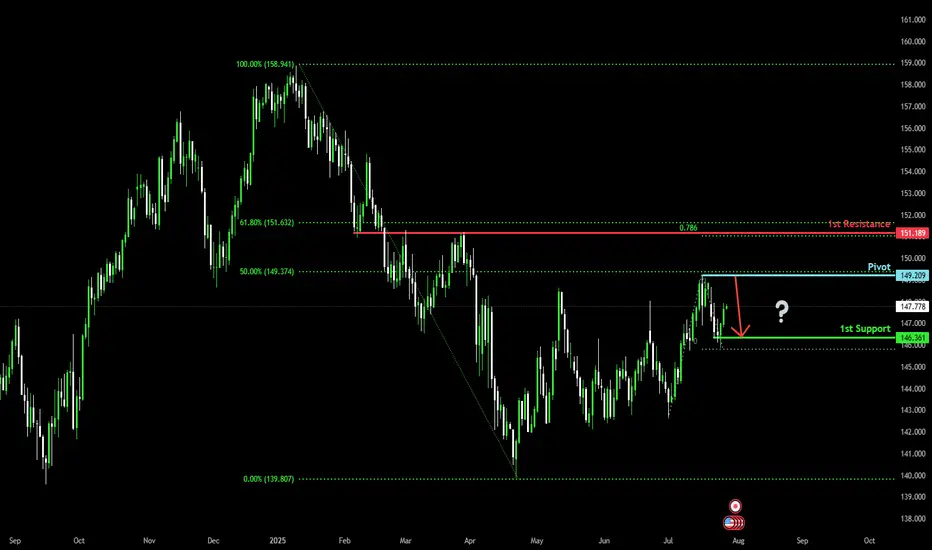
Bearish reversal off swing high resistance?USD/JPY is rising towards the pivot, which acts as a swing high resistance and could reverse to the pullback support.
Pivot: 149.20
1st Support: 146.36
1st Resistance: 151.18
Risk Warning:
Trading Forex and CFDs carries a high level of risk to your capital and you should only trade with money you can afford to lose. Trading Forex and CFDs may not be suitable for all investors, so please ensure that you fully understand the risks involved and seek independent advice if necessary.
Disclaimer:
The above opinions given constitute general market commentary, and do not constitute the opinion or advice of IC Markets or any form of personal or investment advice.
Any opinions, news, research, analyses, prices, other information, or links to third-party sites contained on this website are provided on an "as-is" basis, are intended only to be informative, is not an advice nor a recommendation, nor research, or a record of our trading prices, or an offer of, or solicitation for a transaction in any financial instrument and thus should not be treated as such. The information provided does not involve any specific investment objectives, financial situation and needs of any specific person who may receive it. Please be aware, that past performance is not a reliable indicator of future performance and/or results. Past Performance or Forward-looking scenarios based upon the reasonable beliefs of the third-party provider are not a guarantee of future performance. Actual results may differ materially from those anticipated in forward-looking or past performance statements. IC Markets makes no representation or warranty and assumes no liability as to the accuracy or completeness of the information provided, nor any loss arising from any investment based on a recommendation, forecast or any information supplied by any third-party.
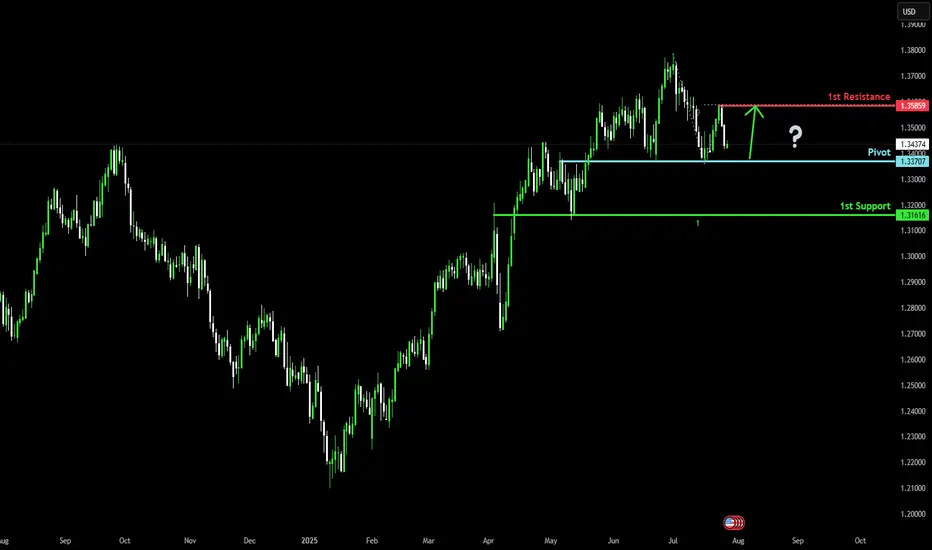
Bullish bounce off?The Cable (GBP/USD) is falling towards the pivot and could bounce to the swing high resistance.
Pivot: 1.3370
1st Support: 1.3161
1st Resistance: 1.3585
Risk Warning:
Trading Forex and CFDs carries a high level of risk to your capital and you should only trade with money you can afford to lose. Trading Forex and CFDs may not be suitable for all investors, so please ensure that you fully understand the risks involved and seek independent advice if necessary.
Disclaimer:
The above opinions given constitute general market commentary, and do not constitute the opinion or advice of IC Markets or any form of personal or investment advice.
Any opinions, news, research, analyses, prices, other information, or links to third-party sites contained on this website are provided on an "as-is" basis, are intended only to be informative, is not an advice nor a recommendation, nor research, or a record of our trading prices, or an offer of, or solicitation for a transaction in any financial instrument and thus should not be treated as such. The information provided does not involve any specific investment objectives, financial situation and needs of any specific person who may receive it. Please be aware, that past performance is not a reliable indicator of future performance and/or results. Past Performance or Forward-looking scenarios based upon the reasonable beliefs of the third-party provider are not a guarantee of future performance. Actual results may differ materially from those anticipated in forward-looking or past performance statements. IC Markets makes no representation or warranty and assumes no liability as to the accuracy or completeness of the information provided, nor any loss arising from any investment based on a recommendation, forecast or any information supplied by any third-party.
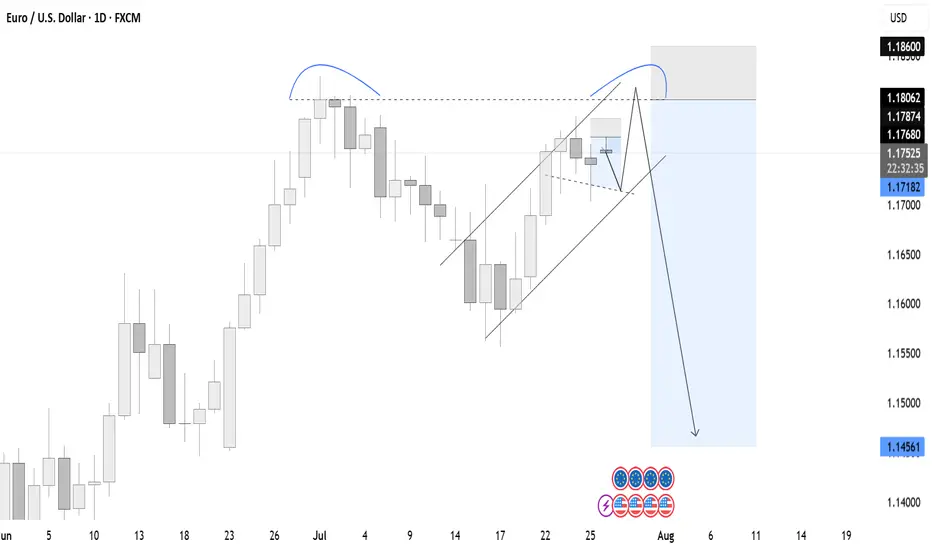
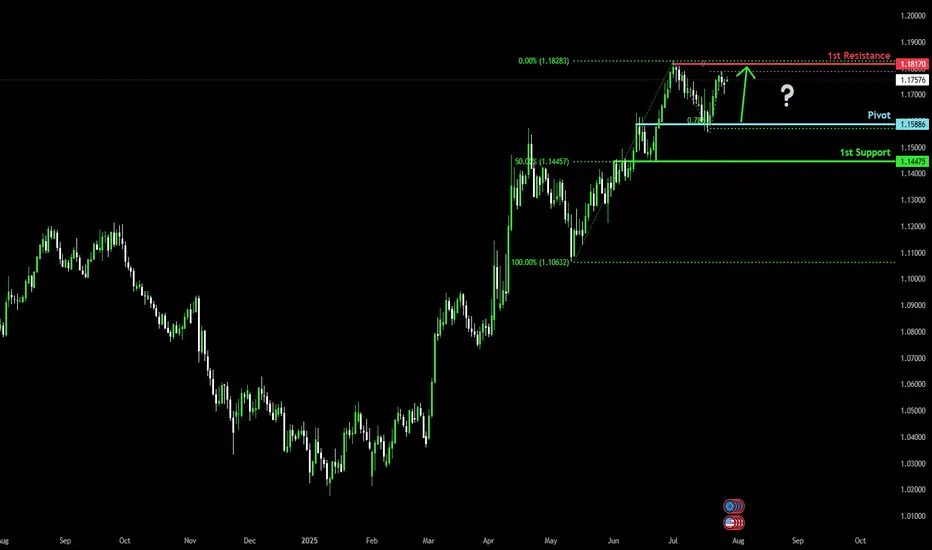
Bullish momentum to extend?The Fiber (EUR/USD) is falling towards the pivot, which acts as an overlap support and could rise to the 1st resistance, which has been identified as a swing high resistance.
Pivot: 1.1588
1st Support: 1.1447
1st Resistance: 1.1817
Risk Warning:
Trading Forex and CFDs carries a high level of risk to your capital and you should only trade with money you can afford to lose. Trading Forex and CFDs may not be suitable for all investors, so please ensure that you fully understand the risks involved and seek independent advice if necessary.
Disclaimer:
The above opinions given constitute general market commentary, and do not constitute the opinion or advice of IC Markets or any form of personal or investment advice.
Any opinions, news, research, analyses, prices, other information, or links to third-party sites contained on this website are provided on an "as-is" basis, are intended only to be informative, is not an advice nor a recommendation, nor research, or a record of our trading prices, or an offer of, or solicitation for a transaction in any financial instrument and thus should not be treated as such. The information provided does not involve any specific investment objectives, financial situation and needs of any specific person who may receive it. Please be aware, that past performance is not a reliable indicator of future performance and/or results. Past Performance or Forward-looking scenarios based upon the reasonable beliefs of the third-party provider are not a guarantee of future performance. Actual results may differ materially from those anticipated in forward-looking or past performance statements. IC Markets makes no representation or warranty and assumes no liability as to the accuracy or completeness of the information provided, nor any loss arising from any investment based on a recommendation, forecast or any information supplied by any third-party.
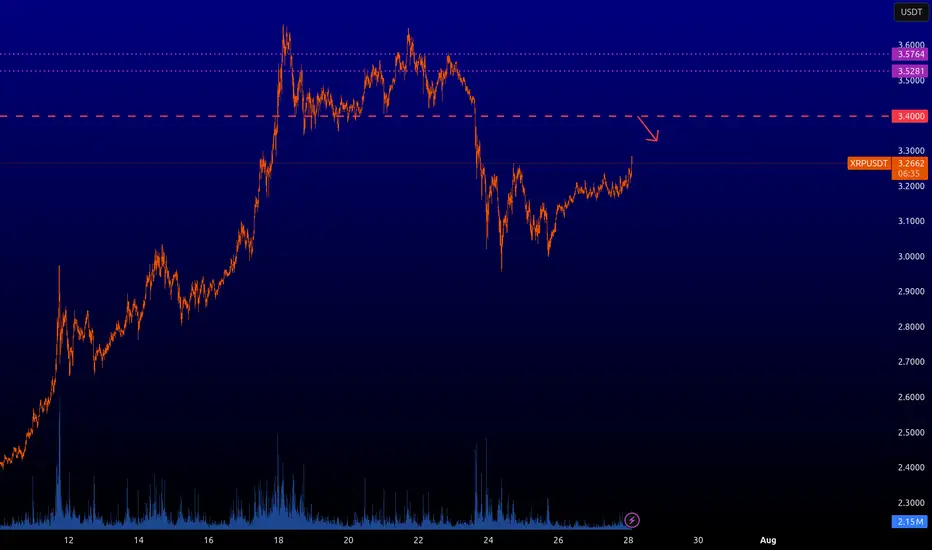
XRPUSD : Key levelsIt is possible to short from the red level with arrow, other levels are inactive for now.
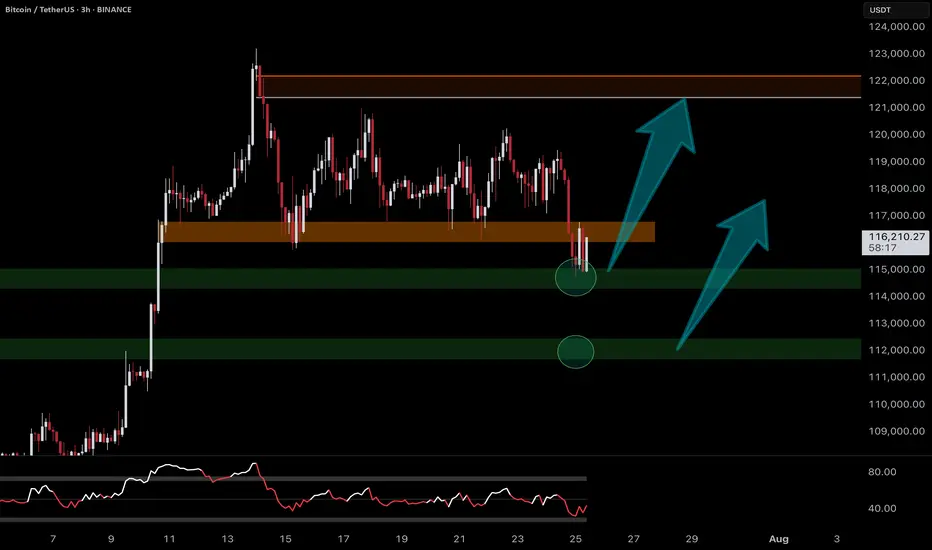
Bullish continuation?The Bitcoin (BTC/USD) has bounced off the pivot and could rise to the 1st resistance.
Pivot: 116,724.27
1st Support: 111,336.90
1st Resistance: 123,341.37
Risk Warning:
Trading Forex and CFDs carries a high level of risk to your capital and you should only trade with money you can afford to lose. Trading Forex and CFDs may not be suitable for all investors, so please ensure that you fully understand the risks involved and seek independent advice if necessary.
Disclaimer:
The above opinions given constitute general market commentary, and do not constitute the opinion or advice of IC Markets or any form of personal or investment advice.
Any opinions, news, research, analyses, prices, other information, or links to third-party sites contained on this website are provided on an "as-is" basis, are intended only to be informative, is not an advice nor a recommendation, nor research, or a record of our trading prices, or an offer of, or solicitation for a transaction in any financial instrument and thus should not be treated as such. The information provided does not involve any specific investment objectives, financial situation and needs of any specific person who may receive it. Please be aware, that past performance is not a reliable indicator of future performance and/or results. Past Performance or Forward-looking scenarios based upon the reasonable beliefs of the third-party provider are not a guarantee of future performance. Actual results may differ materially from those anticipated in forward-looking or past performance statements. IC Markets makes no representation or warranty and assumes no liability as to the accuracy or completeness of the information provided, nor any loss arising from any investment based on a recommendation, forecast or any information supplied by any third-party.

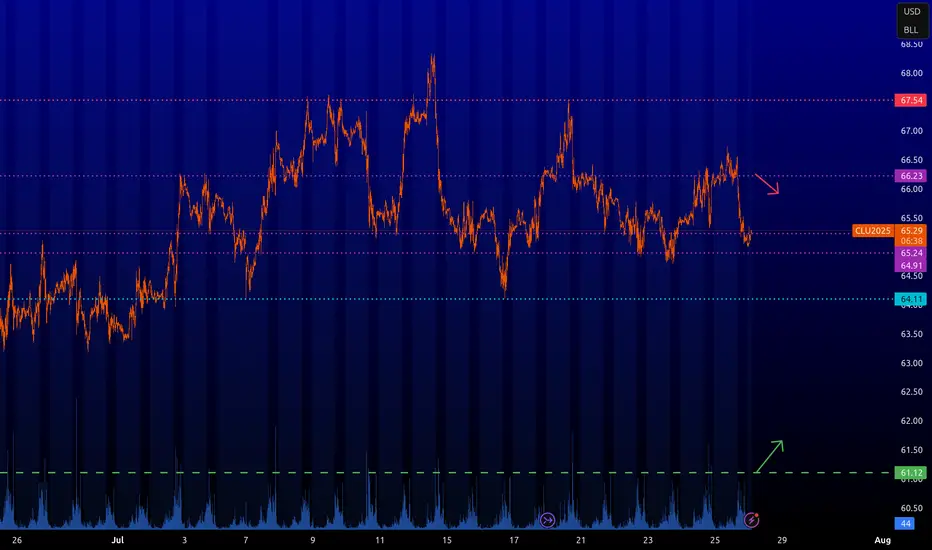
CL : Key levelsFrom the level of 66.23 we can wait for short-term sales.
From the level of 61.12 you can at least buy short-term, and if the price draws certain patterns on it, you can expect a good long position.
The other levels are still inactive, but the market will see them. When they become active, I will inform you.
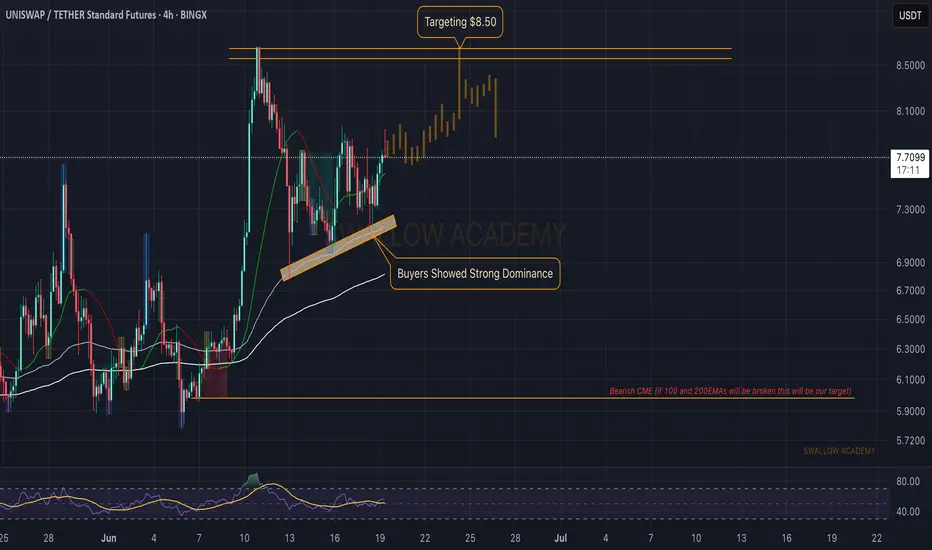
Uniswap (UNI): Buyers Showing Strong Dominance | Aiming at $8.50Uniswap is showing strong buyside momentum where recently near 100EMA we saw how dominant the buyers were, which is giving us a sign of possible further movement to local resistance area, so that's where we have set our targets as of now.
Now if we see any signs of weakenss then we will be shifting our view for Bearish CME.
Swallow Academy
ETH BUY SETUP ,Bought From $3805ETH BUY SETUP
Currently $3805
Bought From $3805
(Trading plan If ETH go down
to $3700 will add more longs)
Expecting target $3900 OR ABOVE
In the event of an early exit,
this analysis will be updated.
Its not a Financial advice

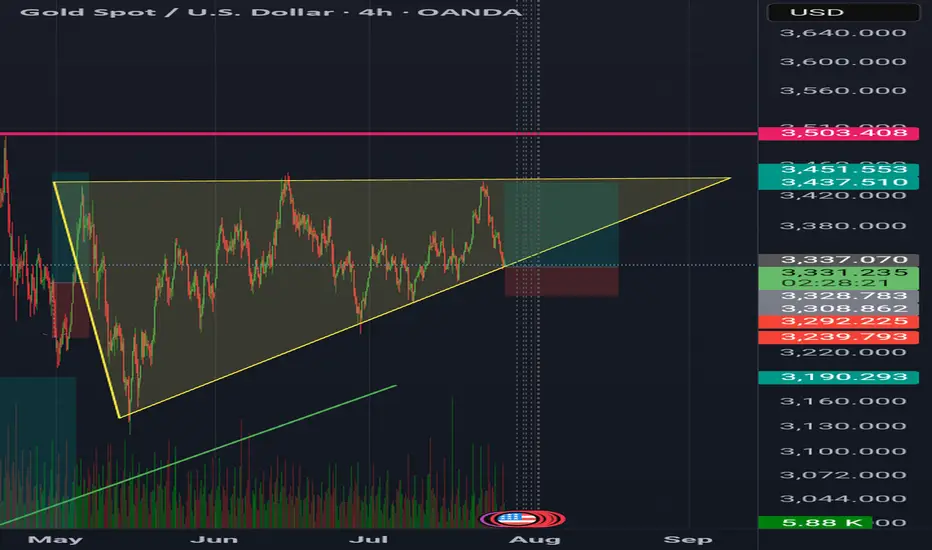
GoldXau usd daily analysis
Time frame 4 hours
Gold is moving up and down in the yellow triangle, you can see on the chart
I think Gold move up to 3450 $ and if we have no positive news, it will drop to the down side. This analysis has good benefit and Risk rewards ratio is 3
On the other hand if Gold break the 3320 $ my analysis is faild and must listen to the economic news
EURUSD End July BearsEURUSD will short this week and continue selling into AUGUST. A double top pattern on the daily chart confirms this trade. We sell from Wednesday.