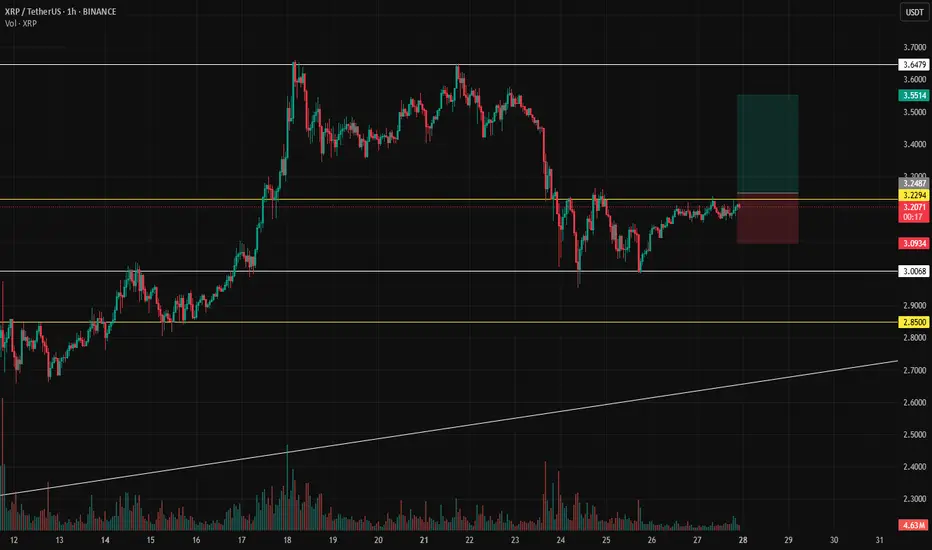
Toncoin (TON): Good Opportunity For Long Position | Good R:RToncoin is still looking good for upward movement, despite it moving rather sideways since the last time we checked the coin.
More in-depth info is in the video—enjoy!
Swallow Academy
Harmonic Patterns

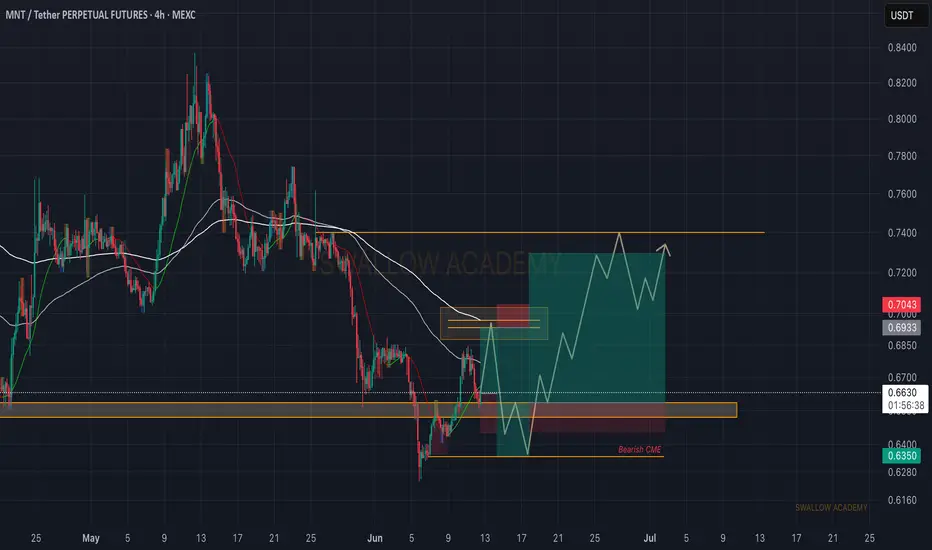
Mantle (MNT): Buyside Volume Gathering!Mantle coin has had a nasty dip recently, whereas as of now we see some kind of buyside volume gathering up.
We are targeting here the 200EMA line, after which we might be seeing some kind of weakness.
There are 3 possible times to take positions so let's wait out for proper confirmations now.
Swallow Academy
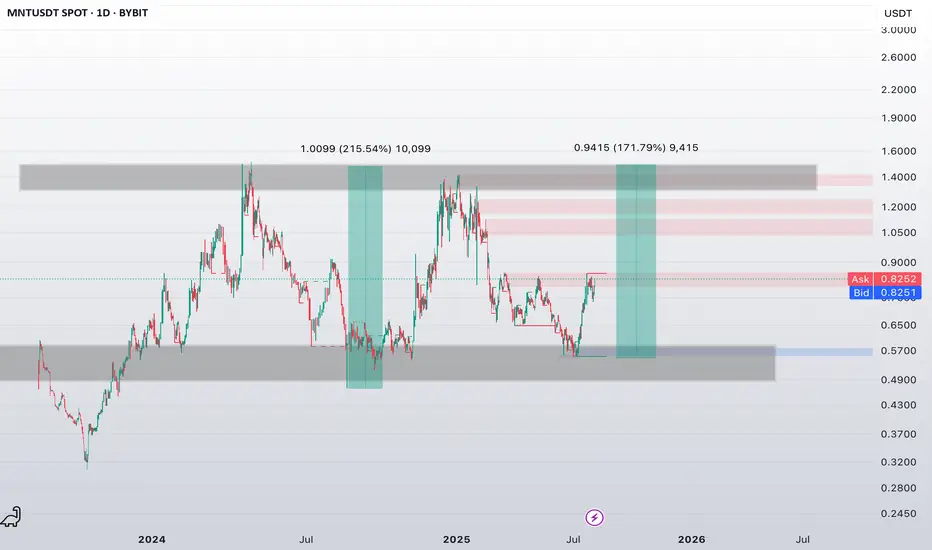
Mantle ($MNT) — Repeating the +170% Pattern?
TSX:MNT is once again testing a key resistance zone after a strong reversal from a deep support area 🔁
We've already seen two nearly identical breakout patterns:
🔹 1st pattern: +215% rally to $1.00
🔹 2nd pattern (currently in play): already +171%, targeting $1.40?
📊 Technical Breakdown:
🟦 Support: $0.55 — strong demand zone that held twice
🟥 Resistance: $0.83–$1.05 — key supply zone that previously triggered sharp rejections
🧠 Psychology: Many traders may doubt the pattern repeat — which often creates the perfect setup for a surprise breakout
🚀 What’s Next?
✅ If TSX:MNT breaks and holds above $0.85 — upside target toward $1.30–$1.40
❌ If rejected — likely a retest of the $0.65–$0.60 area to build strength
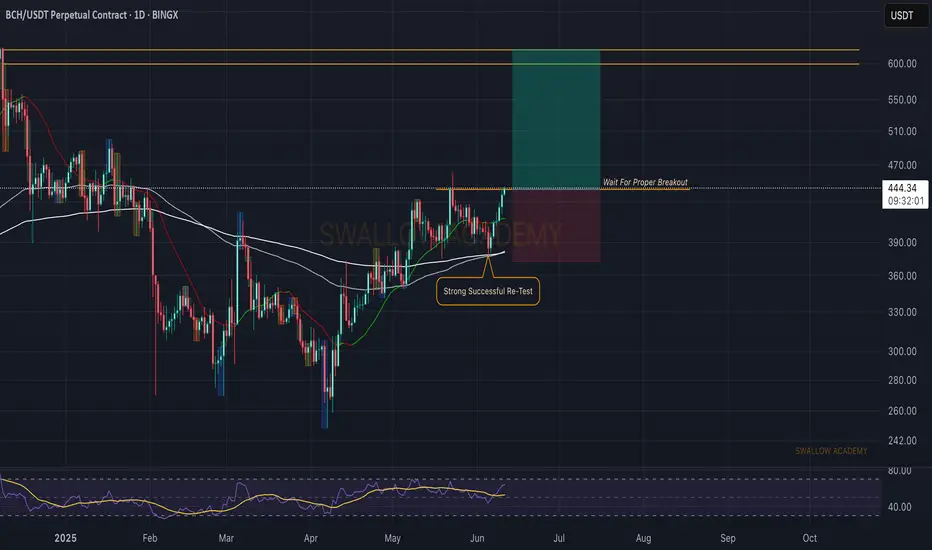
Bitcoin Cash (BCH): Breakout Incoming | Possible 1:4 TradeBCH is showing signs of a breakout where price is pushing and pushing, which eventually might result in a strong and volatile breakout from here.
As soon as we see it, we will be looking for further upward movement towards our target zone (resistance area).
Swallow Academy
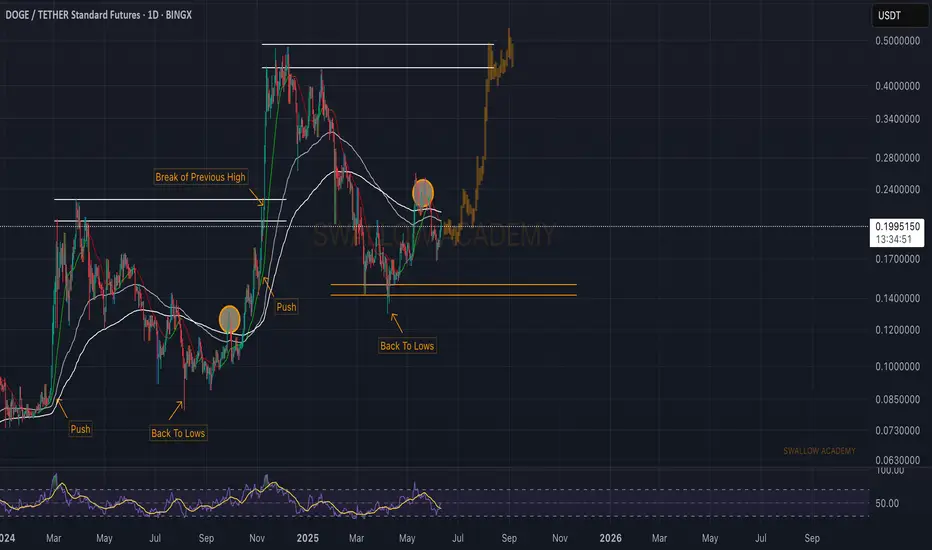
Dogecoin (DOGE): Getting Ready For Buyside Movement | $0.44Dogecoin is repeating its pattern where, after forming local lows and the first breakout above EMAs, the price is not getting ready for a proper push, it seems to us.
We are monitoring for the EMA line here, as once we see a proper break (the second one), we will be aiming for the $0.44 area.
Swallow Academy
EURUSD – Channel Forming at Trend Top?EURUSD remains bullish but is showing signs of topping out, possibly forming a downward channel. We’re eyeing a mid-channel entry near a weekly gap, looking for one more push higher before a potential reversal. Key levels could form a double top – a breakout or rejection here will be telling.

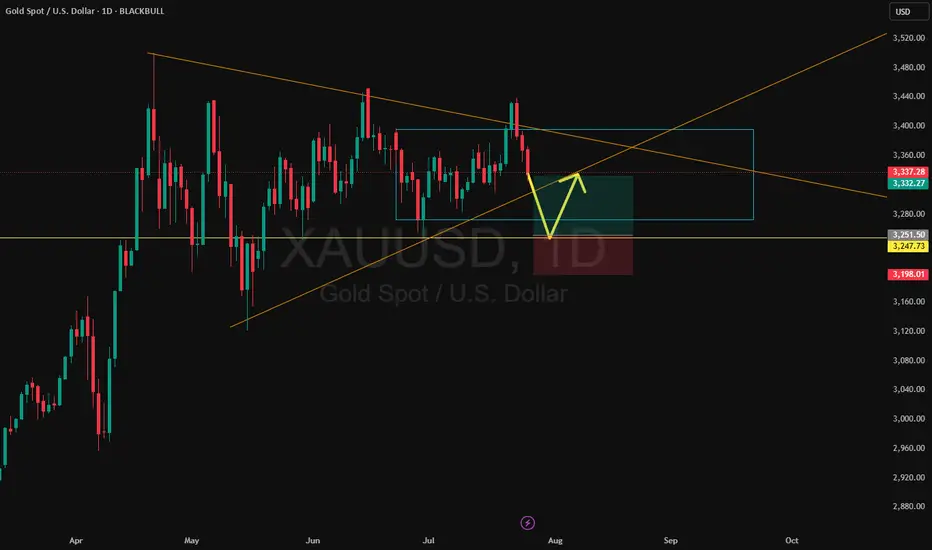
Gold – Range Break Incoming?Gold is still locked in a broad range, but recent price action suggests a possible breakdown. A break below the double bottom opens the door for a move toward the range midpoint.
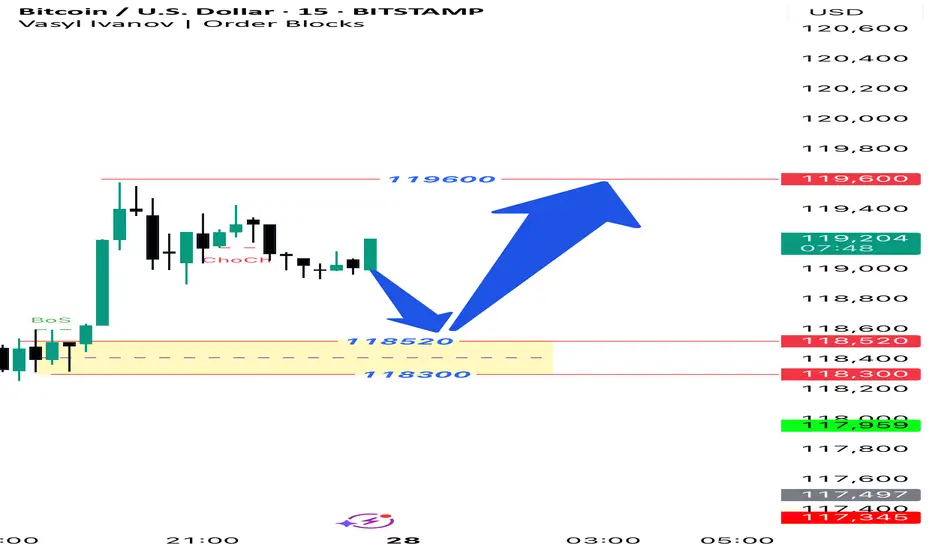
BTCUSD 15M Setup The trend is up in the 1-hour timeframe, so we are looking for buying opportunities in the 15-minute timeframe. We expect the price to fall to the range of 118,520 to 118,300 and then rise to the target of 119,600 and above.
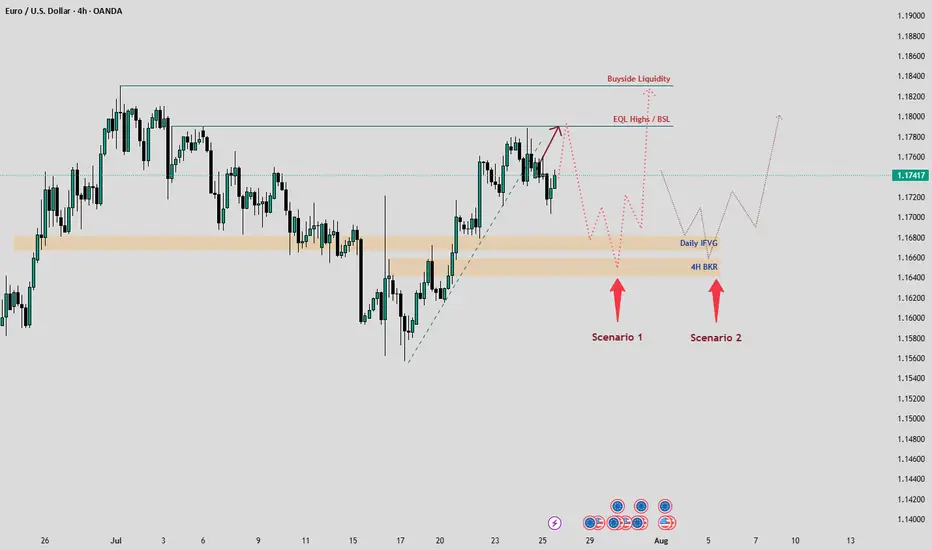
EURUSD Weekly Analysis: Key Levels and Scenarios to WatchHello, TradingView Community! 👋
Following our last EURUSD analysis, where we accurately predicted a bullish pullback from a key area within a descending channel, the price reacted as expected, delivering a solid move upward. Now, let’s dive into this week’s outlook, focusing on critical levels and two potential scenarios, keeping in mind the major economic events on the horizon. 📊
Current Market Context
EURUSD has recently reacted from a weekly Fair Value Gap (FVG) and is currently navigating the mid-range, with its sights set on Buyside Liquidity at the top. However, reaching this liquidity pool won’t be straightforward, as the price is likely to collect liquidity from lower Premium/Discount Arrays (PD Arrays) before making a significant move.
We’ve identified key levels to watch:
Daily Imbalance FVG (IFVG): A critical support zone where price could find buying interest.
4H Breaker Block: A high-probability reversal zone on the 4-hour chart.
Relative Equal Highs / Previous Week High (PWH) : Acting as a magnet for price action, especially early in the week.
With major economic events like the FED meeting and Non-Farm Payrolls (NFP) looming, volatility is expected. Let’s break down the two potential scenarios for EURUSD this week.
Scenario 1: Price Targets Equal Highs / PWH First 📈
In this scenario, we expect EURUSD to be drawn toward the relative equal highs or previous week’s high (PWH) early in the week, potentially on Monday, forming the high of the week. These levels act as a magnet for price due to trapped liquidity and stop orders.
What to Watch:
Price Action at Equal Highs / PWH: Look for rejection signals (e.g., bearish candlestick patterns, divergence, or liquidity sweeps) indicating a potential reversal.
Confirmation for Shorts: If the price reaches these highs and shows a strong bearish reaction, this could signal a drop toward the Daily IFVG or 4H Breaker Block.
Trading Plan:
Entry: Consider short positions if price rejects at equal highs or PWH with clear bearish confirmation.
Target: Aim for the Daily IFVG or 4H Breaker Block as initial downside targets.
Stop Loss: Place above the equal highs/PWH to protect against a breakout.
This scenario is more likely given the magnetic nature of equal highs and the upcoming economic catalysts driving volatility.
Scenario 2: Price Drops to Daily IFVG / 4H Breaker First 📉
Alternatively, EURUSD could move lower first, targeting the Daily IFVG and potentially the 4H Breaker Block. If the price fails to break above the equal highs and instead drops toward these lower PD Arrays, we could see the low of the week form by Monday or Tuesday.
What to Watch:
Price Action at PD Arrays: Monitor for bullish reversal signals (e.g., absorption, bullish engulfing, or liquidity grabs) at the Daily IFVG or 4H Breaker Block.
Confirmation for Longs: A strong bullish reaction at these levels could signal a move toward the Buyside Liquidity at the top.
Trading Plan:
Entry: Look for long positions if price reaches the Daily IFVG or 4H Breaker Block and shows bullish confirmation.
Target: Target the Buyside Liquidity or intermediate resistance levels.
Stop Loss: Place below the IFVG or Breaker Block to manage risk.
Risk Management: Stay Disciplined! ⚠️
With major economic events like the FED meeting and NFP this week, volatility could spike. Always prioritize risk management:
Position Sizing: Risk no more than 1-2% of your account per trade.
Stop Losses: Always use a stop loss to protect your capital.
Trade Confirmation: Wait for clear price action signals before entering trades.
Avoid Overtrading: Stick to high-probability setups and avoid chasing the market.
Call to Action (CTA) 📢
What do you think about these scenarios? Are you leaning toward Scenario 1 or Scenario 2? Drop your thoughts in the comments below, give this post a LIKE if you found it helpful, and FOLLOW for more weekly analyses! Let’s discuss and trade smarter together! 💬
Stay sharp, manage your risk, and let’s conquer the markets! 🚀
#EURUSD #Forex #TechnicalAnalysis #TradingView
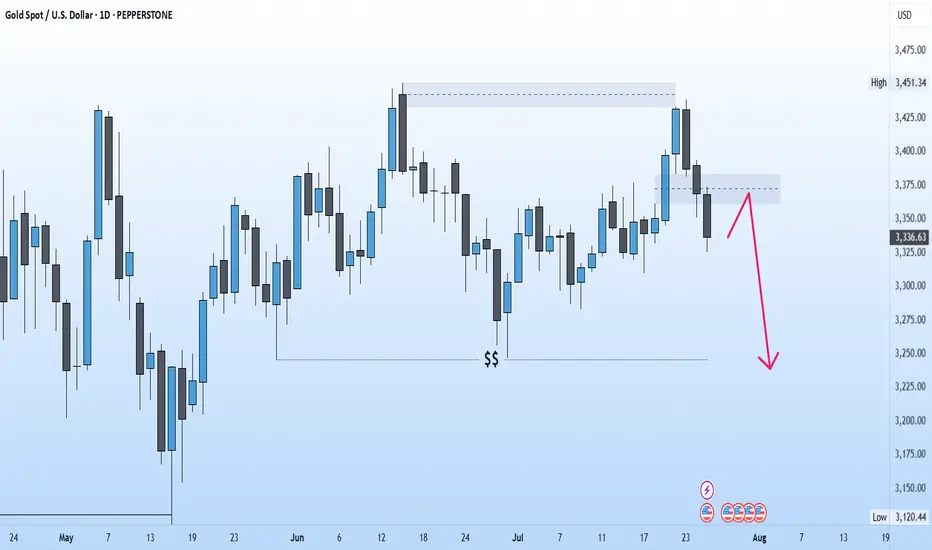
XAUUSD: Bearish Continuation in Play Toward 3,250Gold closed last week with a strong bearish weekly candle, rejecting from the 3,440 supply zone and closing below the key Fair Value Gap at 3,360. This confirms downside pressure, especially in the context of a strengthening dollar.
For this week, we may see a bullish opening early in the week toward 3,370, followed by a deeper bearish move targeting the major low and liquidity pool at 3,250.
Bias: Bearish
Key Zones:
• Resistance / Retest: 3,370
• Target: 3,250
• Supply Rejection: 3,440
Momentum favors further downside unless bulls reclaim key levels.

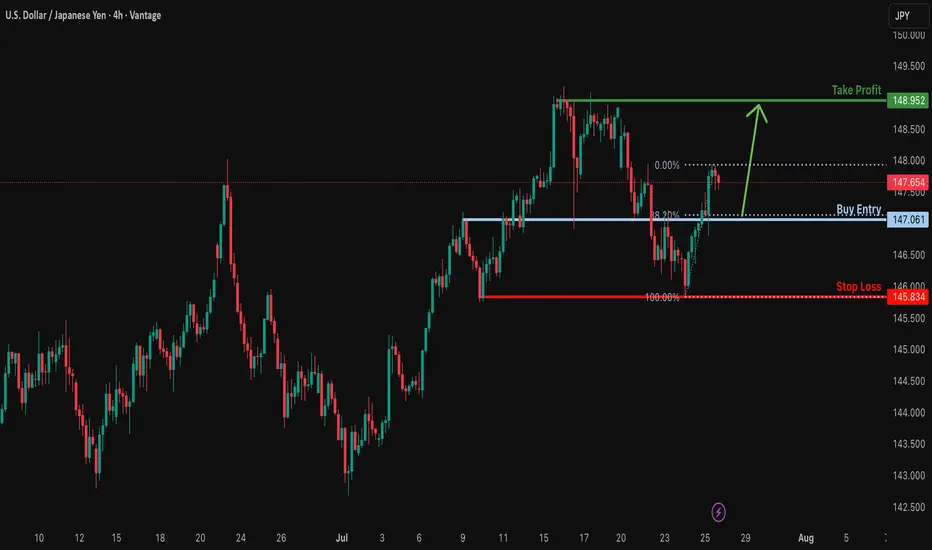
Could the price bounce from here?USD/JPY is falling towards the support level, which is an overlap support that aligns with the 38.2% Fibonacci retracement and could bounce from this level to our take-profit.
Entry: 147.06
Why we like it:
There is an overlap support that aligns with the 38.2% Fibonacci retracement.
Stop loss: 145.83
Why we like it:
There is a multi-swing low support.
Take profit: 148.95
Why we like it:
There is high swing resistance.
Enjoying your TradingView experience? Review us!
Please be advised that the information presented on TradingView is provided to Vantage (‘Vantage Global Limited’, ‘we’) by a third-party provider (‘Everest Fortune Group’). Please be reminded that you are solely responsible for the trading decisions on your account. There is a very high degree of risk involved in trading. Any information and/or content is intended entirely for research, educational and informational purposes only and does not constitute investment or consultation advice or investment strategy. The information is not tailored to the investment needs of any specific person and therefore does not involve a consideration of any of the investment objectives, financial situation or needs of any viewer that may receive it. Kindly also note that past performance is not a reliable indicator of future results. Actual results may differ materially from those anticipated in forward-looking or past performance statements. We assume no liability as to the accuracy or completeness of any of the information and/or content provided herein and the Company cannot be held responsible for any omission, mistake nor for any loss or damage including without limitation to any loss of profit which may arise from reliance on any information supplied by Everest Fortune Group.
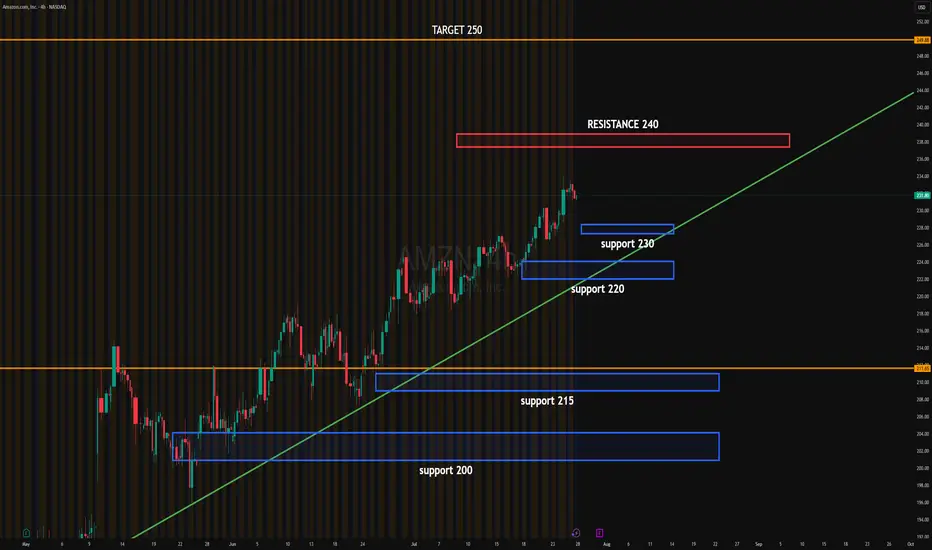
AMZN EARNINGSAMZN price action update:
Price is consolidating below the 240 resistance after a steady climb. Buyers are defending the 230 level, showing signs of absorption just above the ascending trendline.
The 233.50 breakout level could trigger momentum towards the 240 resistance. If breached, institutional targets extend toward 250.
Current consolidation suggests the Market Maker is trapping liquidity below 230 while buying time for a directional move.
Upside target: 250
Downside target: 220 if 230 fails
#AMZN #globaltrade #investment #investing #stockmarket #wealth #realestate #markets #economy #finance #money #forex #trading #price #business #currency #blockchain #crypto #cryptocurrency #airdrop #btc #ethereum #ico #altcoin #cryptonews #Bitcoin #ipo
Bearish drop off pullback resistance?USD/CHF is rising towards the resistance level, which is a pullback resistance that aligns with the 50% Fibonacci retracement and could drop from this level to our take-profit.
Entry: 0.7985
Why we like it:
There is a pullback resistance that aligns with the 50% Fibonacci retracement.
Stop loss: 0.8067
Why we like it:
There is an overlap resistance.
Take profit: 0.7888
Why we like it:
There is a swing low support that aligns with the 127.2% Fibonacci extension.
Enjoying your TradingView experience? Review us!
Please be advised that the information presented on TradingView is provided to Vantage (‘Vantage Global Limited’, ‘we’) by a third-party provider (‘Everest Fortune Group’). Please be reminded that you are solely responsible for the trading decisions on your account. There is a very high degree of risk involved in trading. Any information and/or content is intended entirely for research, educational and informational purposes only and does not constitute investment or consultation advice or investment strategy. The information is not tailored to the investment needs of any specific person and therefore does not involve a consideration of any of the investment objectives, financial situation or needs of any viewer that may receive it. Kindly also note that past performance is not a reliable indicator of future results. Actual results may differ materially from those anticipated in forward-looking or past performance statements. We assume no liability as to the accuracy or completeness of any of the information and/or content provided herein and the Company cannot be held responsible for any omission, mistake nor for any loss or damage including without limitation to any loss of profit which may arise from reliance on any information supplied by Everest Fortune Group.

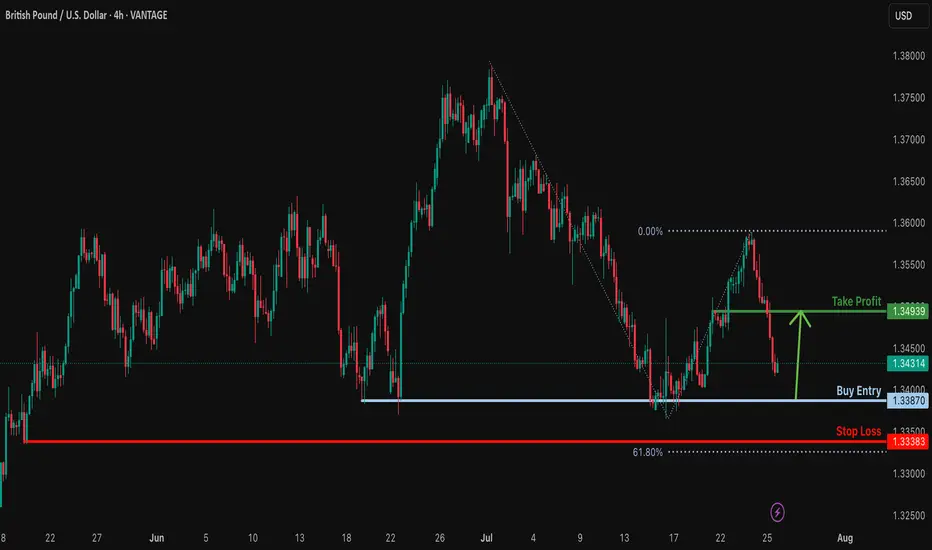
Bullish bounce?GBP/USD is falling towards the support level which is a multi swing low support and could bounce from this level to our take profit.
Entry: 1.3387
Why we like it:
There is a multi swing low support.
Stop loss: 1.3338
Why we like it:
There is a swing low support that is slightly above the 61.8% Fibonacci projection.
Take profit: 1.3493
Why we like it:
There is a pullback resistance.
Enjoying your TradingView experience? Review us!
Please be advised that the information presented on TradingView is provided to Vantage (‘Vantage Global Limited’, ‘we’) by a third-party provider (‘Everest Fortune Group’). Please be reminded that you are solely responsible for the trading decisions on your account. There is a very high degree of risk involved in trading. Any information and/or content is intended entirely for research, educational and informational purposes only and does not constitute investment or consultation advice or investment strategy. The information is not tailored to the investment needs of any specific person and therefore does not involve a consideration of any of the investment objectives, financial situation or needs of any viewer that may receive it. Kindly also note that past performance is not a reliable indicator of future results. Actual results may differ materially from those anticipated in forward-looking or past performance statements. We assume no liability as to the accuracy or completeness of any of the information and/or content provided herein and the Company cannot be held responsible for any omission, mistake nor for any loss or damage including without limitation to any loss of profit which may arise from reliance on any information supplied by Everest Fortune Group.
X on its way to 100 dollars a share!The new updates on the website since 2021 has made the ability for someone to make money while posting, they have just added a Job board for people to seek employment. The X team also has one of the best Paid adertisements that are helpful for the viewer who is on the computer on their profile to help them and above all the website is full of very pretty girls to talk to. This makes tender look like its better for finding Boys / Girls, Its better for Finding jobs and above all its great for content and making money as a poster on X.
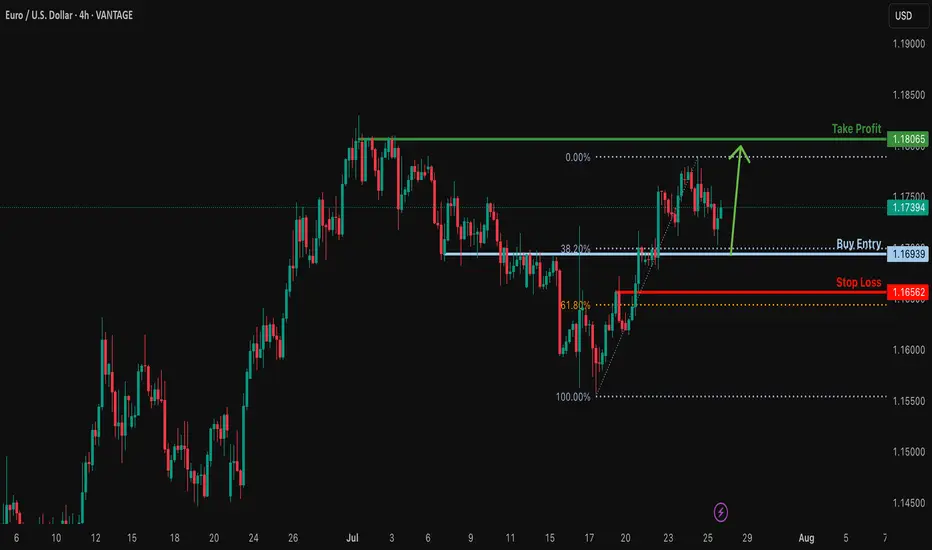
Bullish bounce off 38.2% Fibonacci support?EUR/USD is falling towards the support level, which is an overlap support that aligns with the 38.2% Fibonacci retracement and could bounce from this level to our take-profit.
Entry: 1.1693
Why we like it:
There is an overlap support that lines up with the 38.2% Fibonacci retracement.
Stop loss: 1.1656
Why we like it:
There is a pullback support that is slightly above the 61.8% Fibonacci retracement.
Take profit: 1.1806
Why we like it:
There is a swing high resistance.
Enjoying your TradingView experience? Review us!
Please be advised that the information presented on TradingView is provided to Vantage (‘Vantage Global Limited’, ‘we’) by a third-party provider (‘Everest Fortune Group’). Please be reminded that you are solely responsible for the trading decisions on your account. There is a very high degree of risk involved in trading. Any information and/or content is intended entirely for research, educational and informational purposes only and does not constitute investment or consultation advice or investment strategy. The information is not tailored to the investment needs of any specific person and therefore does not involve a consideration of any of the investment objectives, financial situation or needs of any viewer that may receive it. Kindly also note that past performance is not a reliable indicator of future results. Actual results may differ materially from those anticipated in forward-looking or past performance statements. We assume no liability as to the accuracy or completeness of any of the information and/or content provided herein and the Company cannot be held responsible for any omission, mistake nor for any loss or damage including without limitation to any loss of profit which may arise from reliance on any information supplied by Everest Fortune Group.
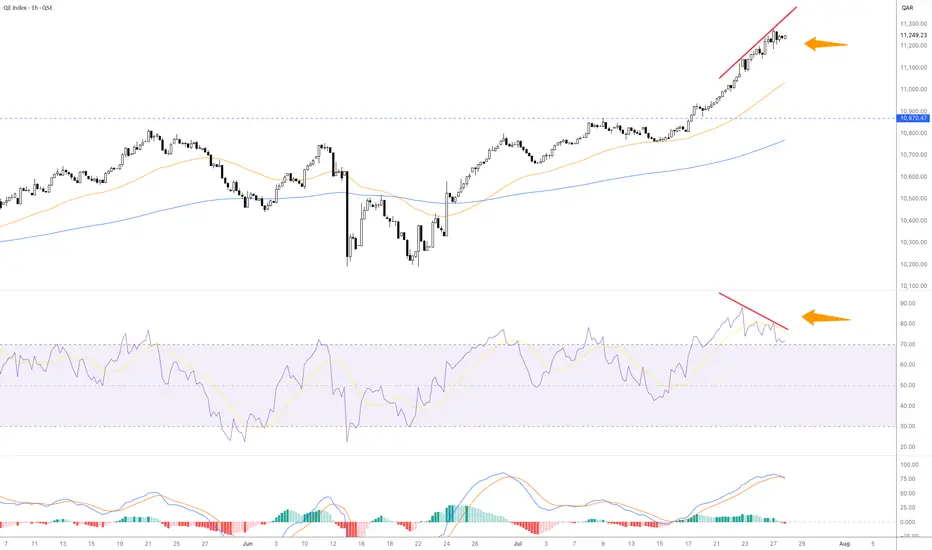
GNRI QAThis bearish divergence suggests that momentum is fading, even as prices continue to rise.
A pullback or consolidation is likely unless strong buying volume breaks above the 11,489 resistance decisively.
Potential support lies near 10,870.
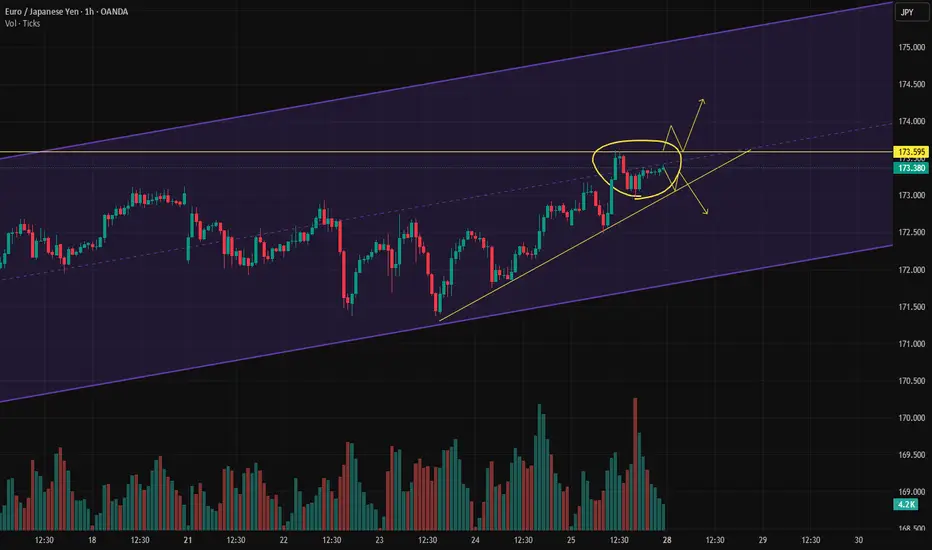
4-hour channel midlineThe price has reached the midline of the 4-hour channel, and buying volume has decreased in this area.
We need to see whether the price can break above the midline or not.
If it breaks to the upside, our first target will be the top of the channel.
If it gets rejected, our target will be the bottom of the channel.
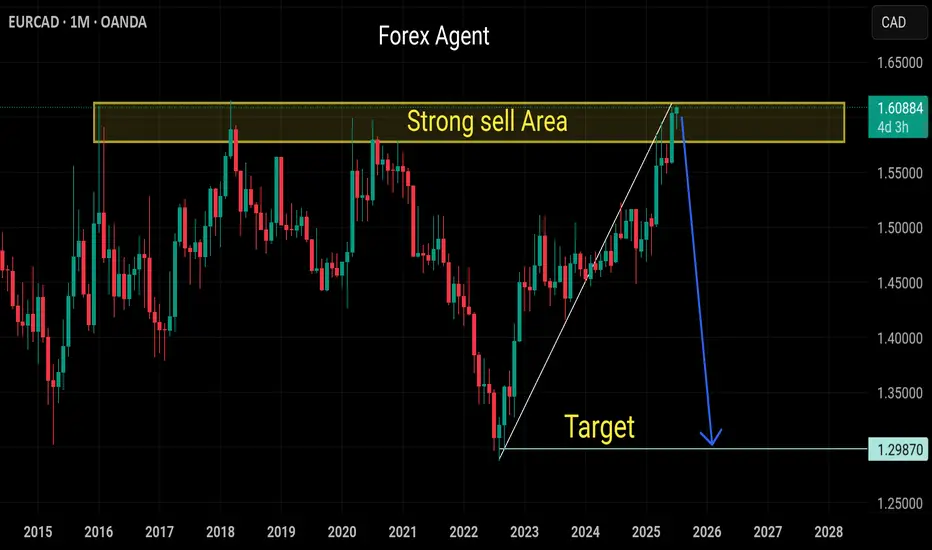
Sell eurcadStrong sell expected from next month
Monthly overbought indicators
Strong selling area minimum drop expected 500 pips