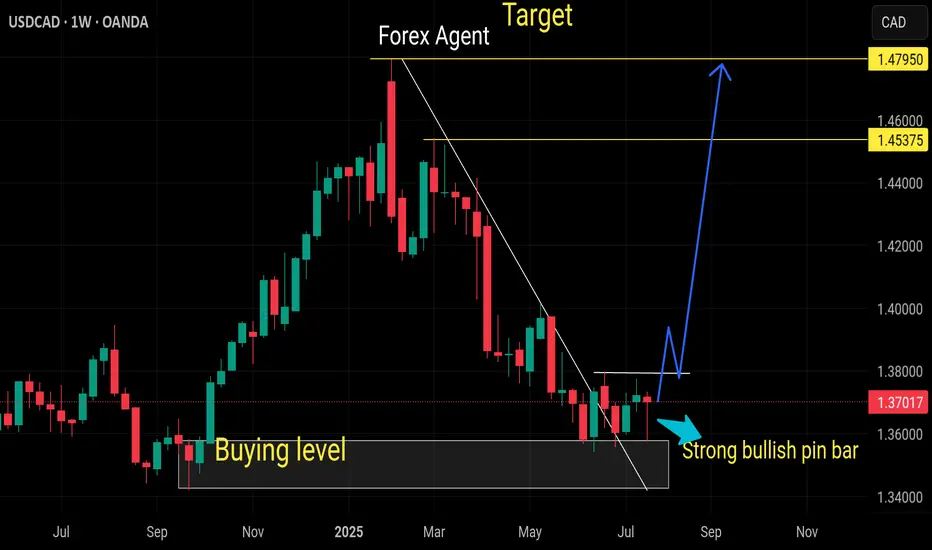
Buy usdcadStrong buyers coming now
Weekly pin rejection
Monthly oversold pair
Daily trend already breaks
Harmonic Patterns
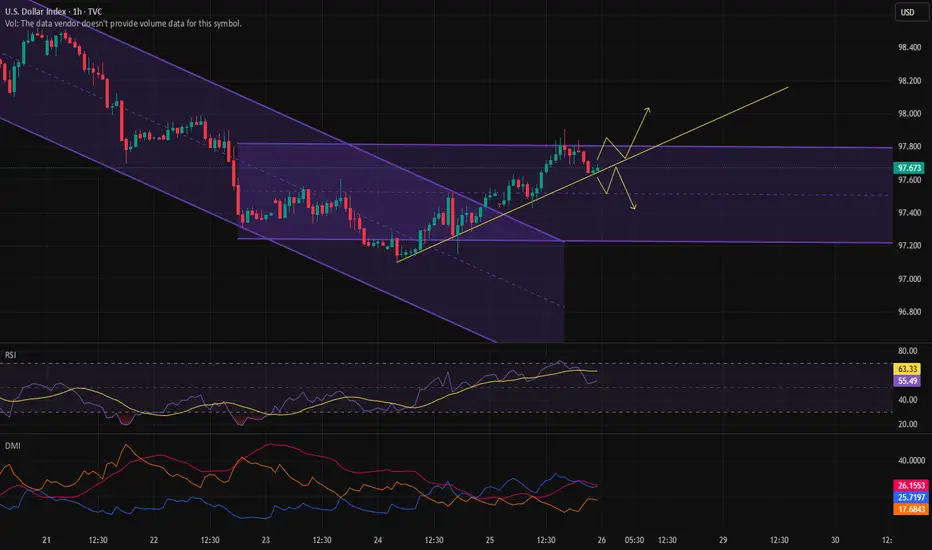
Breakout of the channelAfter the DXY broke out of the channel, it formed a range.
We can see a yellow trendline where the price is moving exactly along it.
If this trendline breaks to the downside, we can take a short position targeting the bottom of the channel.
Otherwise, it would mean the trend reversal in DXY is confirmed.
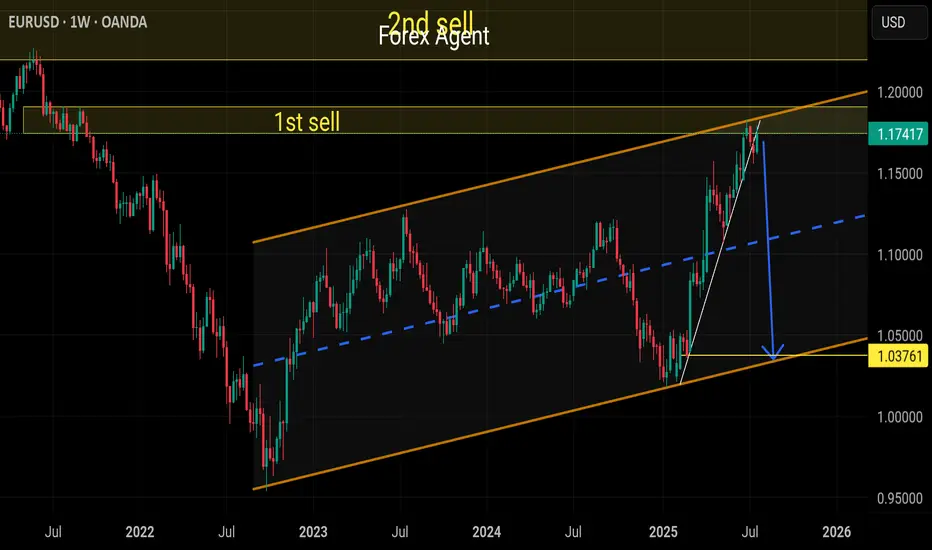
Sell eurusdBearish wave expected now
Daily support trend already breaks
Still monthly overbought pair
Strong bearish correction expected
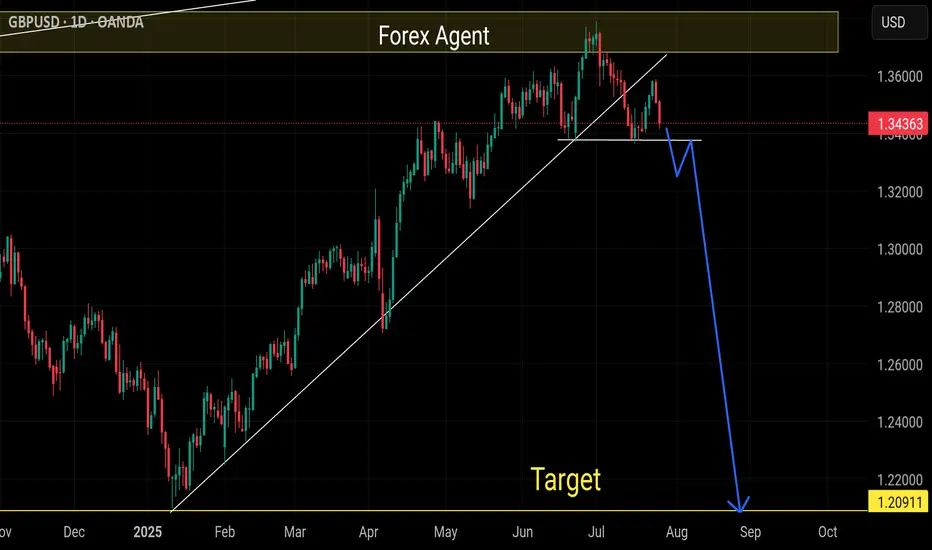
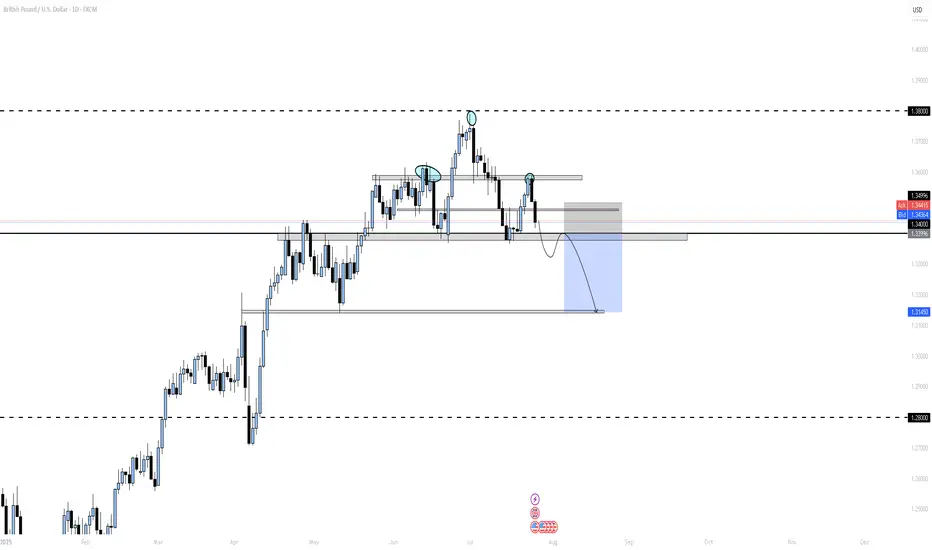
Sell gbpusdStrong selling wave expected for long term
Trend seems to be change the trend now
Monthly still overbought pair
Daily support trend break and retested
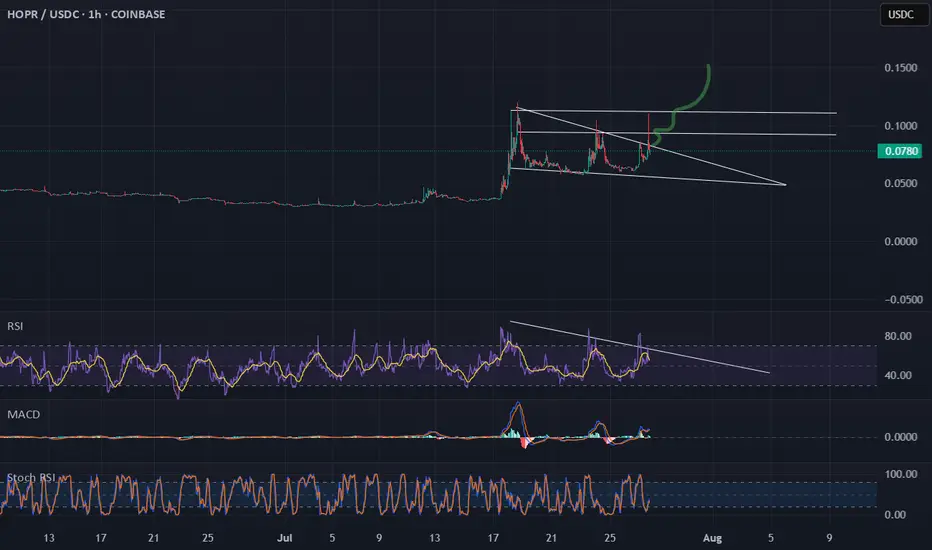
HOPR chart bullishHOPR chart bullish
Currently trading at $0.78
Next resistance $0.90 and $0.10
Rsi = Bullish
Stoch = Rsi Bullish
Macd = Bullish
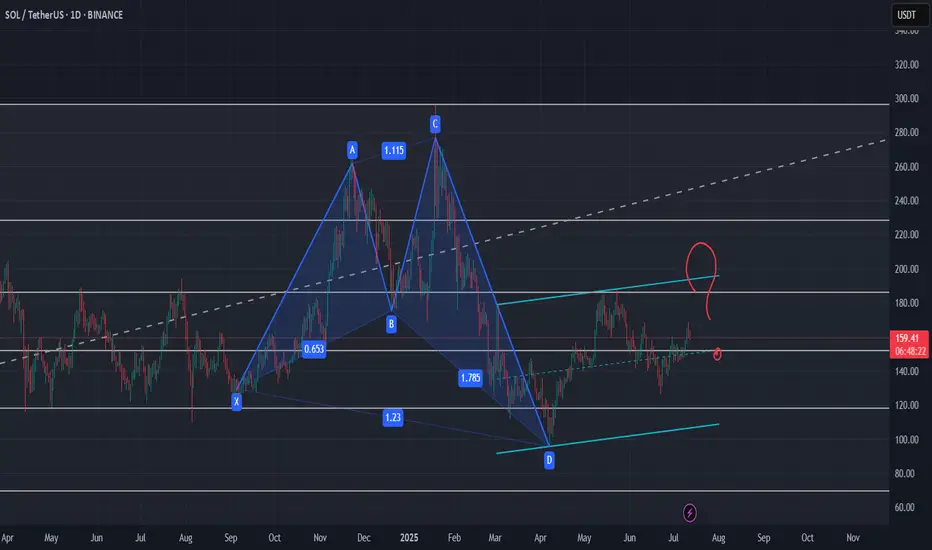
HARMONIC PATTERN on Daily for SOL ?I wonder if this pattern is the one which is highlighted by our friend and chart analyst @The_Alchemist_Trader_
Let's see if it need to test one last time the support of this channel or if it will break out for the long waited rally.
Level to keep an eye :
0.5 Fib support need to hold and clean breakout of the 0.382 Fib
Indicators : RSI, volume and volatility (liquidations)
Gold. GC1! Weekly Outlook. 27.07.2025, SundayCOMEX:GC1!
Outlining gold on HTF. Waiting for FOMC and NFP

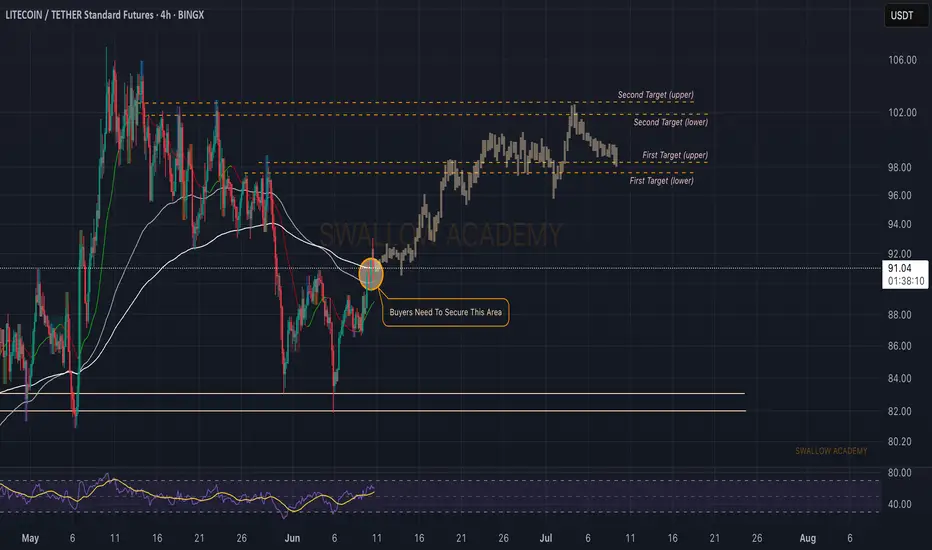
Litecoin (LTC): Looking for Breakout + Targets to be ReachedLitecoin has done very well recently, where the current price is testing the branch of EMAs, where we are expecting to see a breakout, after which we will be looking for upward movement toward our first and second targets.
Swallowa Acaademy
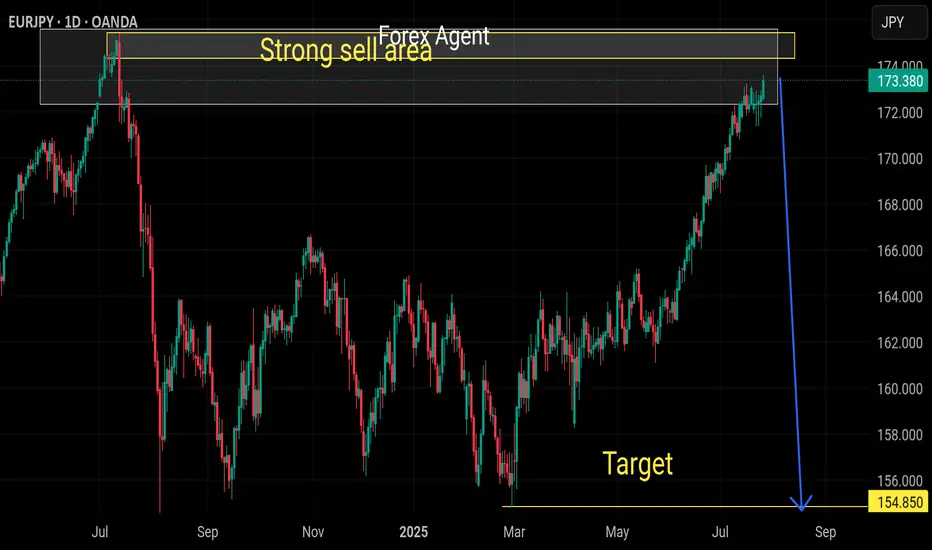
Strong sell eurjpyStrong selling wave coming in next weeks minimum 800 pips drop expected
Strong selling level reached
Strong bearish engulfing level
Weekly overbought pair
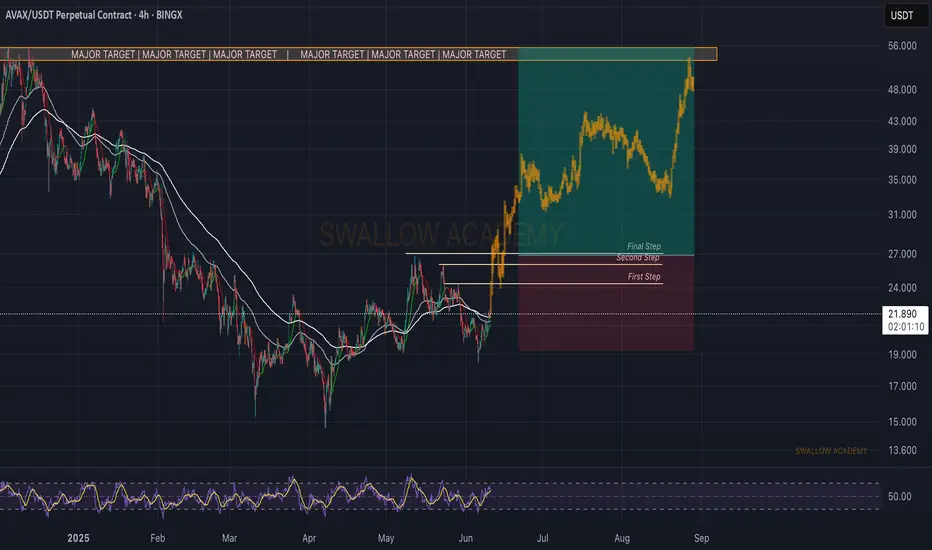
Avalanche (AVAX): Waiting For Proper Breakout | 3 Step BreakAvalanche is slowly gaining some kind of bullish volume, where we are expecting to see smaller upward movement.
On bigger timeframes we are sitting just at the major neckline area so this is why we also considered the current zone to be a good bounce area, so let's wait for a proper breakout now.
Swallow Academy
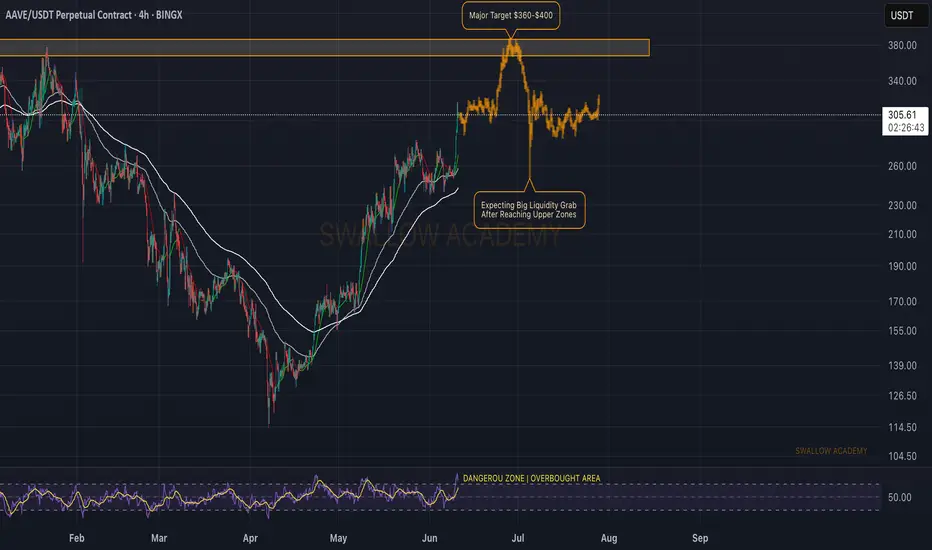
Aave (AAVE): Aiming For $360-$400 Before Bigger Long SqueezeAave coin has had a good upward movement, and now we are inches away from a major resistance zone where we will be expecting to see some kind of big liquidity movement to lower zones.
RSI is overbought so we are already in dangerous zones, but we are pretty sure that before the big dump, we will reach the resistance zone so for now, this is our target area!
Swallow Academy
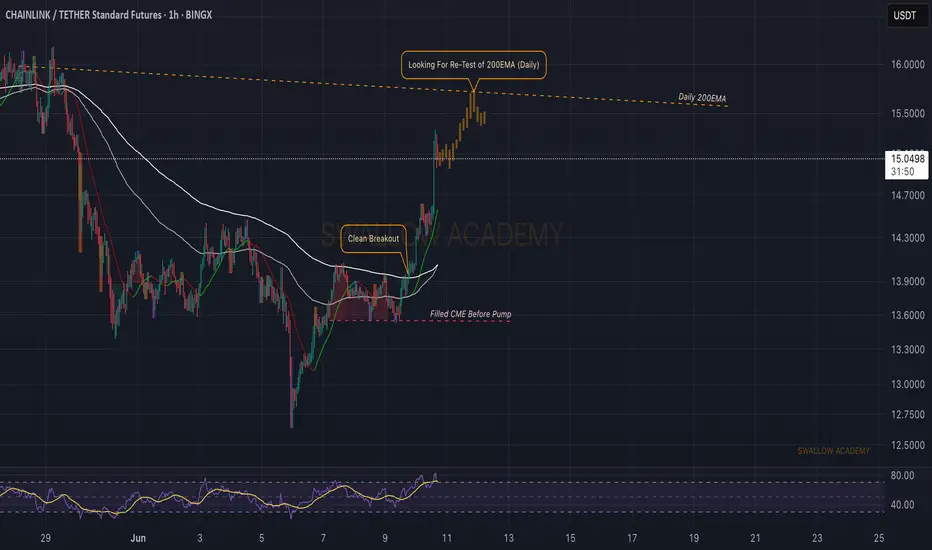
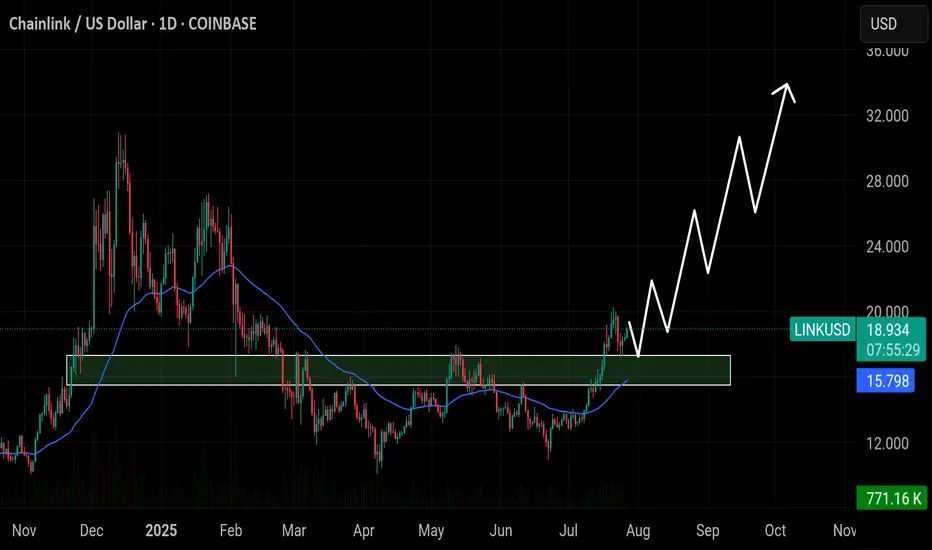
Chainlink (LINK): Looking For Target of 200EMA (Daily)Chainlink has done very well, and we have also opened one long position near the breakout area at $14. Now we are looking for the price to have a proper retest after what we expect to see some downward movement so eyes on the daily 200EMA line for now!
Swallow Academy
Polygon (POL): Entering Good Buying Opportunity | June 2025POL coin is entering a good buying opportunity area where we are looking for some good R:R trades that can be taken both on Daily and Hourly timeframes.
More in-depth info is in the video—enjoy!
Swallow Academy

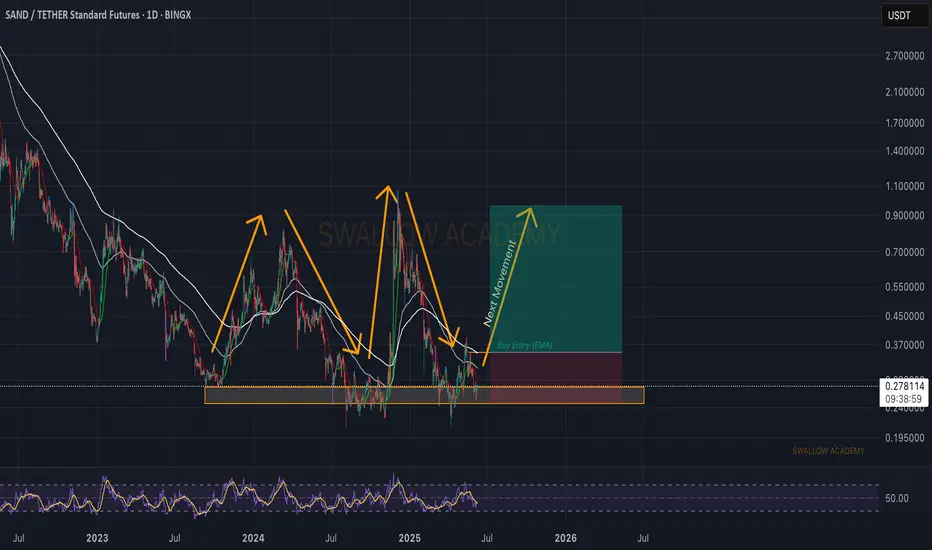
The Sandbox (SAND): Golden Buy Zone | Now or Never...Sand is one of the good long-term coins that caught our attention, where the price is at a local bottom...waiting for a proper breakout from EMAs, which would give us an easy 2.5x on the price.
There is not much to say but rather just wait patiently and enter at the right moment!. Very good R:R trade that we will not miss for sure!
Swallow Academy
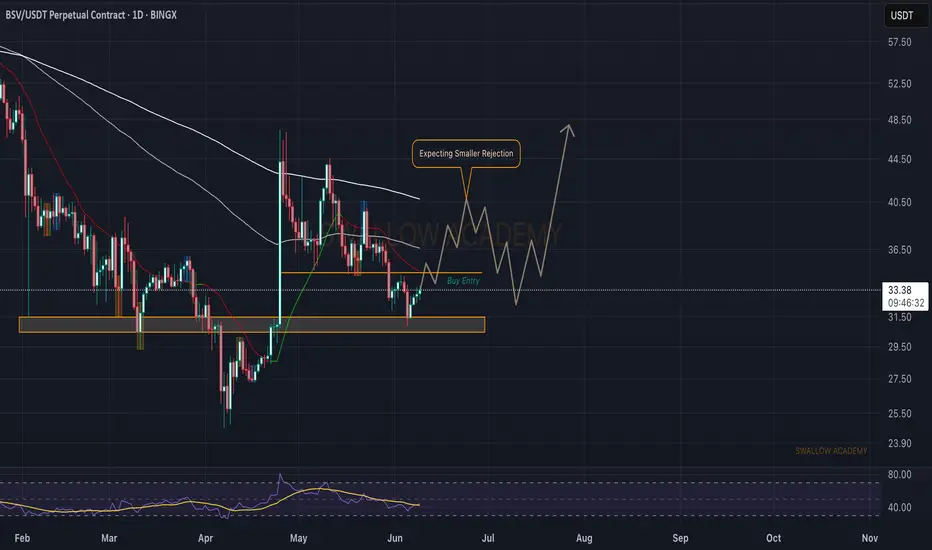
Bitcoin SV (BSV): Possible Bounce Are | Eyes on 200EMABSV has filled the huge FVG that was formed during the bullish candle that we formed on the 25th of April.
As price has now cooled itself down, we are expecting another rally toward the 200EMA, where once we see the proper buyside dominance near $35, we will be going for the long position here!
Swallow Academy
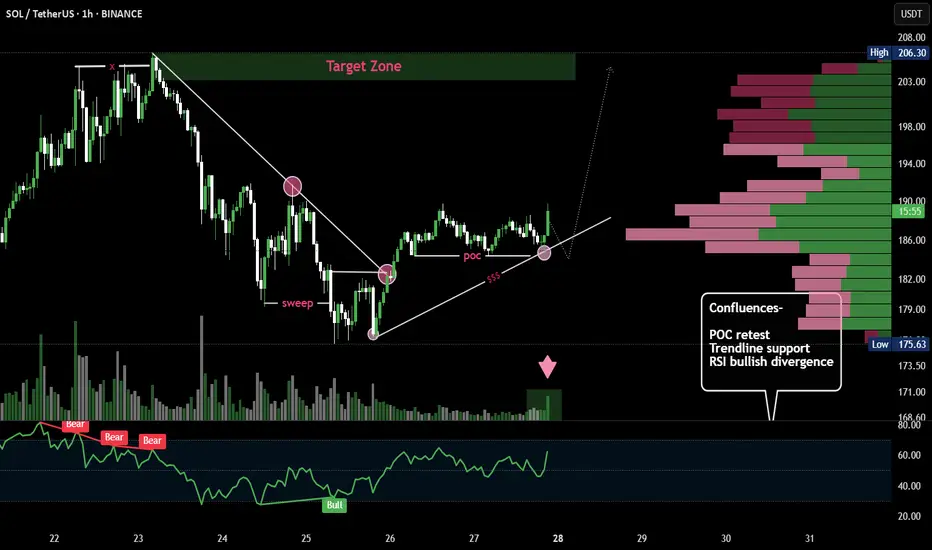
SOL/USDT 1H Chart – Technical Analysis BreakdownTrend Reversal Structure: Price broke out of a descending trendline after sweeping prior lows (liquidity grab), indicating a possible bullish reversal setup.
Point of Control (POC): Price is currently retesting the POC area (high-volume node), aligning with the trendline and prior support — a potential bounce zone.
RSI Divergence: Bullish RSI divergence marked near the sweep confirms the loss of bearish momentum, strengthening the case for upward continuation.
Chainlink ($LINK) has flipped the $15.80 zone into strong supporChainlink ( CRYPTOCAP:LINK ) has flipped the $15.80 zone into strong support — as long as it holds, bullish momentum could push toward $24, $28, and possibly $32 in the coming weeks.
GBP/USD Short Bias – Bearish Fundamentals + Smart Money StructurThe macro environment continues to favor USD strength and GBP weakness, setting up a clean short scenario both fundamentally and technically.
Fundamentals First:
Bank of England is expected to cut rates in the coming months as inflation falls and growth slows. June CPI came in lower than expected, and consumer spending remains weak.
UK GDP growth is flatlining, and PMI data continues to signal contraction in services and manufacturing.
IMF has warned the UK about fiscal imbalances and productivity issues, adding bearish pressure to GBP outlook.
Meanwhile, the Fed remains on hold, with strong U.S. labor data, robust consumer spending, and persistent core inflation — supporting the USD.
Institutional Outlook:
JPMorgan and Citi see GBP/USD downside risks as BoE policy shifts from restrictive to accommodative.
ING and BofA have noted bearish positioning building in GBP against the USD.
Technical Setup:
On the 4H chart, we’re watching a clean Head & Shoulders structure
A break and retest of the neckline confirms downside continuation.
Setup is backed by:
Institutional sentiment
Macro data divergence (UK vs U.S.)
Smart money structure + liquidity zones
BTC WILL FALL IS VERY HIGHThe area im looking to sell BTCUSDT.P from is a very strong resistance that would be very difficult for mr BITCOIN to pass through, so therefore, im expecting BTC to reject from there and fall to the down side. Sell BTC

XAUUSD-3336.40 — a key level bulls want to defend.Why Gold Pulled Back
- Gold pulled back today after hitting $3439.04, just below resistance at $3451.53. Traders took profits ahead of key Fed and trade headlines. Right now, it’s trading around $3414.48, down 0.50%.
- The dip came after the U.S.-Japan trade deal eased geopolitical tension, cutting safe-haven demand. Plus, U.S. bond yields are climbing (10-year at 4.384%), which adds pressure on gold.
Support is building at $3374.42, with stronger buying interest expected around $3347.97 and the 50-day moving average at $3336.40 — a key level bulls want to defend.
Short-term looks a bit weak, but as long as gold holds above the 50-day MA, the bullish trend remains intact. Longer-term, weakness in the dollar, central bank gold buying, and concerns about Fed independence could push prices higher.
Watching the Fed’s July 29–30 meeting next


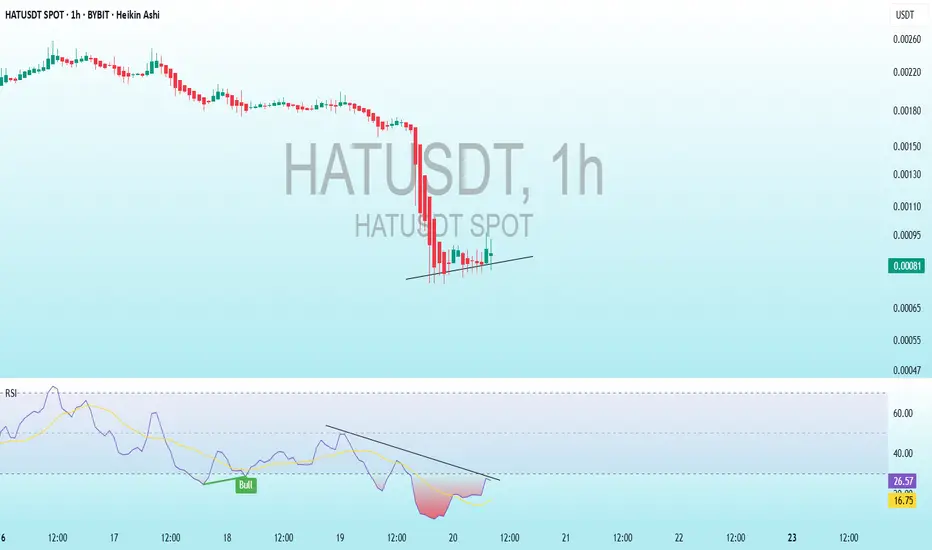
HATUSDT 1-Hour Heikin Ashi Chart Analysis BYBIT:HATUSDT
Analysis:
Recent Trend: The chart shows a sharp price drop recently, with red candles indicating strong selling pressure. 📉
RSI: The Relative Strength Index has fallen below 30, entering oversold territory. This suggests that selling may have been excessive, and a rebound could be possible. 📊
Support: A potential support level can be identified near the current price drop, around 0.00087 USD (based on chart figures). 🔽
Resistance: A possible resistance level could be near the previous trend’s low, around 0.0010-0.0012 USD. 🔼
Possible Targets:
Target 1 (short-term): 0.00095 USD - A small rebound after oversold conditions. 🎯
Target 2 (medium-term): 0.0011 USD - A test of the first resistance level. 🎯
Target 3 (long-term): 0.0015 USD - If a strong bullish recovery occurs after confirmation. 🎯
Set a stop-loss below the support level (e.g., 0.00065 USD) to manage risk. ⚠️
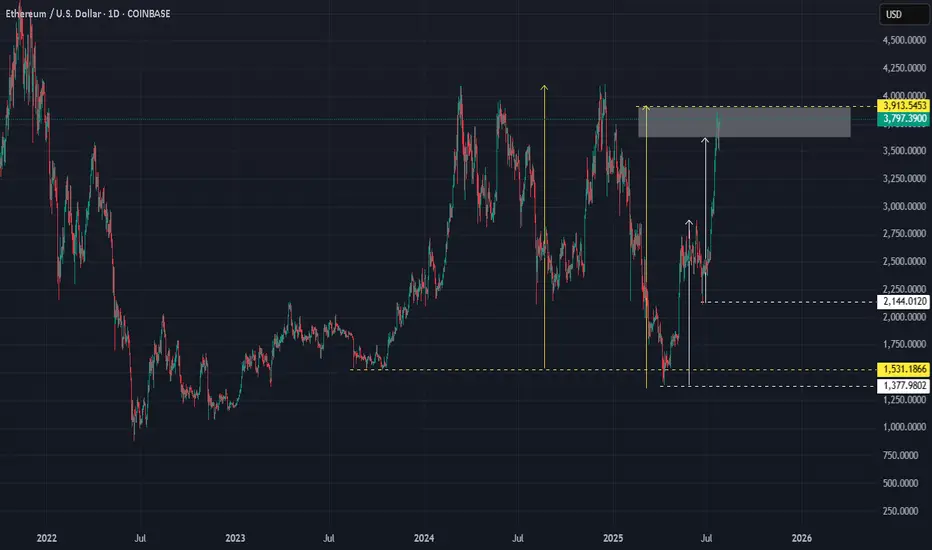
ETHUSD : Good luck :-)A lot of people get carried away easily.
It is ALWAYS a MISTAKE to buy at the TOP. You have already missed the boat.
Trade with common sense, not with emotion.
Good luck.