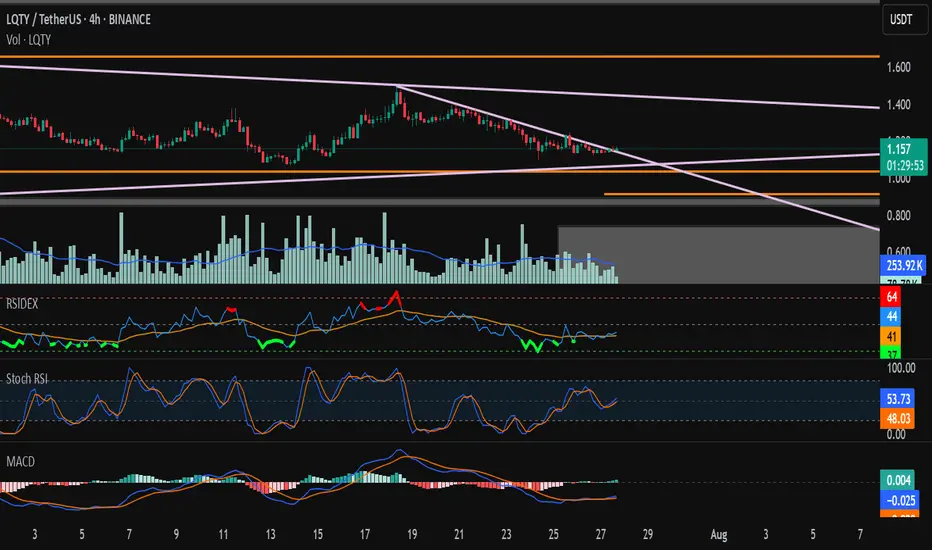
LQTY stronger against ETHLQTY is getting stronger against ETH. it has potential for reaching 1.6.
entry 1 : 1.08
entry 2 : 0.9
SL: 0.83
TP 1: 1.45
TP 2: 1.67
Harmonic Patterns
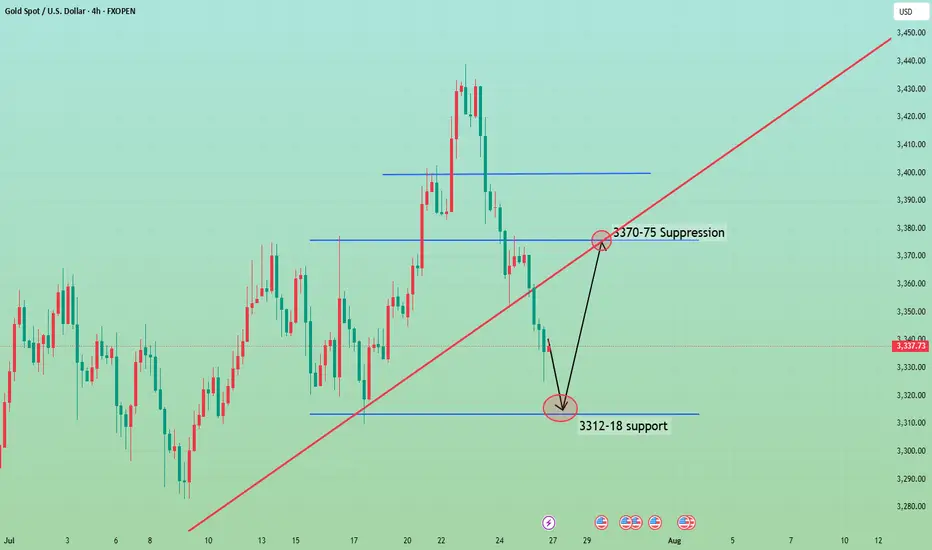
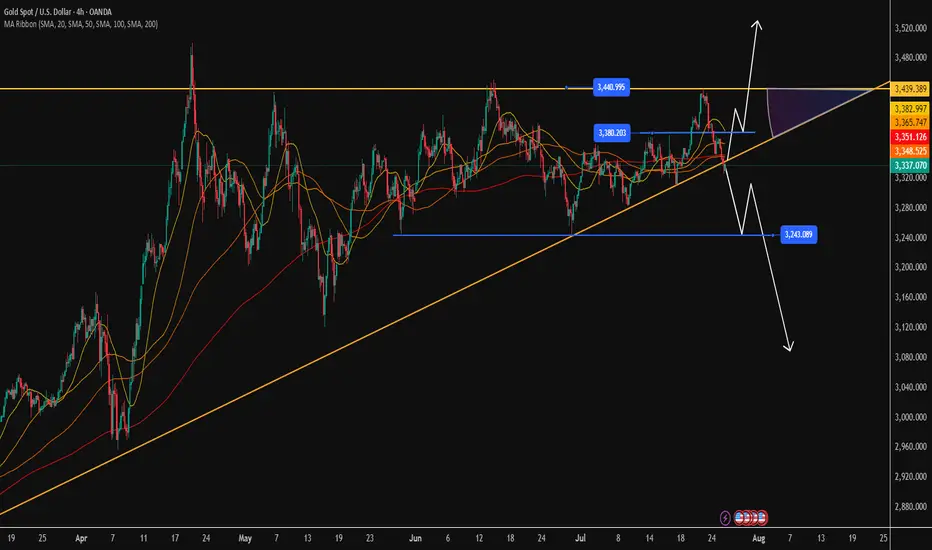
Gold may rebound.From the 4-hour analysis chart, we focus on the short-term suppression of 3370-75 on the top, and focus on the suppression of 3397-3400 on the first line. After all, gold fell and broke through here this week, and then fell southward. Below, we focus on the support of 3312-18.
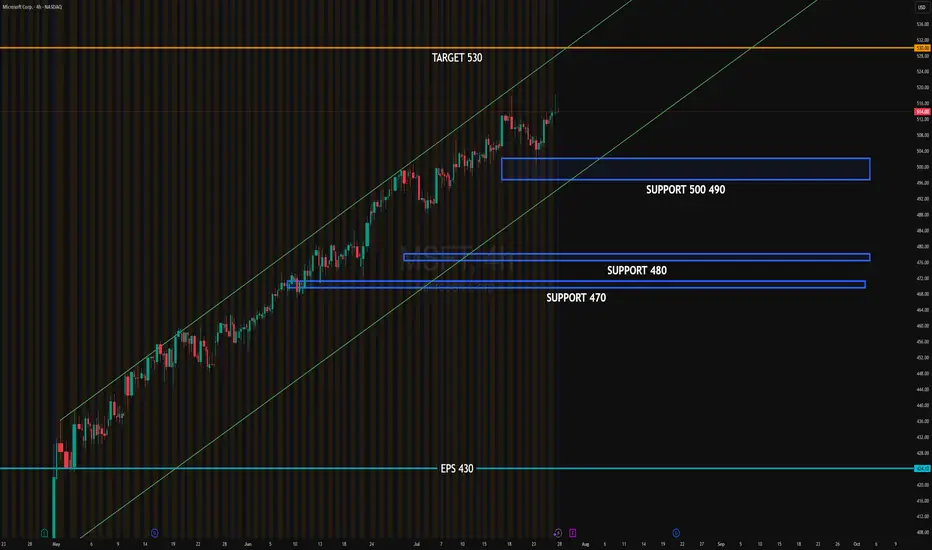
MSFT EARNINGSMicrosoft (MSFT) is consolidating near the upper edge of its ascending channel, with strong institutional defense between 490–500. The 510–520 range shows absorption and may trigger a directional breakout. A close above 515 could ignite momentum toward 530.
Upside target: 530
Downside target: 490 (support) then 480
#MSFT #globaltrade #investment #investing #stockmarket #wealth #realestate #markets #economy #finance #money #forex #trading #price #business #currency #blockchain #crypto #cryptocurrency #airdrop #btc #ethereum #ico #altcoin #cryptonews #Bitcoin #ipo
META EARNINGSMETA is consolidating below resistance at 720, with visible absorption just under 710. Institutional activity shows active PUT selling at 700 and directional BUY CALLs around 715–720. This suggests accumulation and potential upside pressure.
If price closes above 715 this week, a breakout toward 725–730 becomes likely, especially ahead of earnings. Support remains firm at 700, with a deeper level at 620 if rejection occurs.
Upside target: 745
Downside target: 700, then 620 if broken
#META #globaltrade #investment #investing #stockmarket #wealth #realestate #markets #economy #finance #money #forex #trading #price #business #currency #blockchain #crypto #cryptocurrency #airdrop #btc #ethereum #ico #altcoin #cryptonews #Bitcoin #ipo

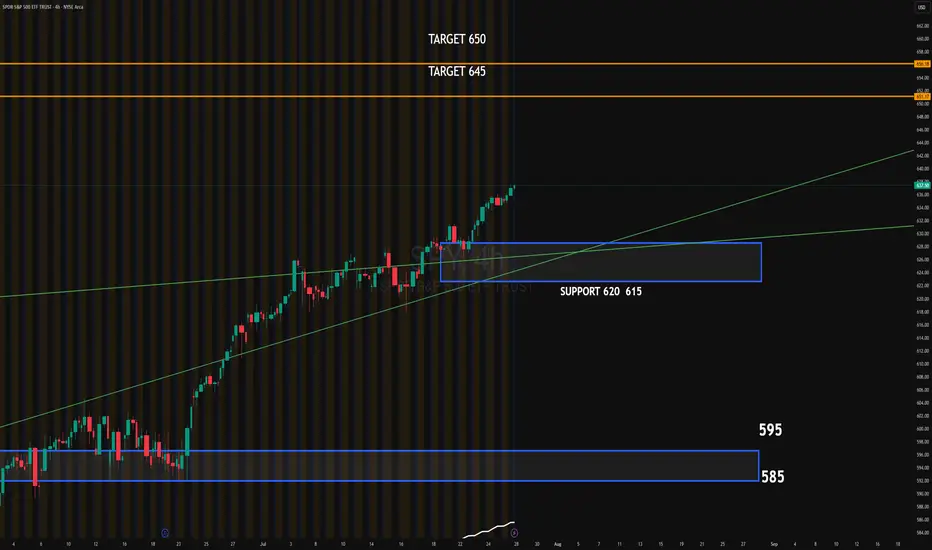
SPY 4HSSPY continues its bullish trend after breaking above the ascending channel. The recent breakout shows strong momentum, supported by institutional absorption around the 620–615 zone. This area now acts as key support.
Upside target: 645
Extended target: 650
Downside target if momentum fails: 620–615 zone, followed by 595
#SPY #globaltrade #investment #investing #stockmarket #wealth #realestate #markets #economy #finance #money #forex #trading #price #business #currency #blockchain #crypto #cryptocurrency #airdrop #btc #ethereum #ico #altcoin #cryptonews #Bitcoin #ipo
TOTALCRYPTO MARKET CAPAs we can see the curve support has been broken but this can be a fake move ( manipulation zone ) and we can be manipulated further more till the next rectangle box as mentioned on the chart. Or you can say its a retracement as per previous market action we are the 50% of the previous downfall and exactly from 50% we got some bullish momentum but still the retest of the 50% has not been done so we cannot trust this zone. Let the price retest the zone and than we will have a clear path to upside.
My analysis is till the level i marked for now.
We are Bullish until we have some serious break down with strong red candles.

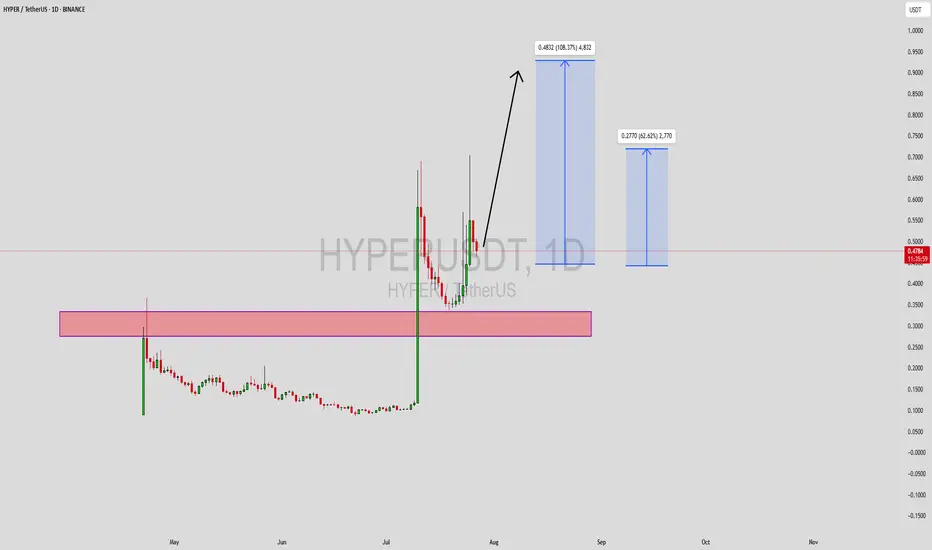
HYPERUSDT Forming Bullish ReversalHYPERUSDT is currently forming a bullish reversal pattern, suggesting a potential shift in momentum from bearish to bullish. This type of setup typically emerges after a downtrend, signaling that sellers are losing strength and buyers are preparing to reclaim control. The current chart shows early signs of trend exhaustion with tightening price action, which often precedes a breakout in the opposite direction. This setup is particularly attractive for swing traders looking to capitalize on a major reversal.
Volume activity is supporting the reversal thesis, with increased accumulation evident at key support zones. This suggests strong interest from investors and smart money anticipating a move higher. Bullish reversal patterns backed by volume typically lead to sharp rallies, and based on this structure, HYPERUSDT has the potential to deliver gains of 90% to 100%+ in the coming sessions. Confirmation of this setup will be a breakout above the neckline or key resistance with sustained buying volume.
Investor sentiment around HYPER is also improving, fueled by growing community support and rising visibility in crypto forums and social platforms. Technically, the coin is sitting at a major inflection point where a clean break can result in a parabolic upside move. Traders should remain alert for breakout confirmation and be ready to manage risk accordingly for maximum reward potential.
This trade idea aligns well with common reversal setups seen in successful altcoin rallies. If executed with precision, it offers both technical strength and strong upside risk-to-reward profile.
✅ Show your support by hitting the like button and
✅ Leaving a comment below! (What is You opinion about this Coin)
Your feedback and engagement keep me inspired to share more insightful market analysis with you!
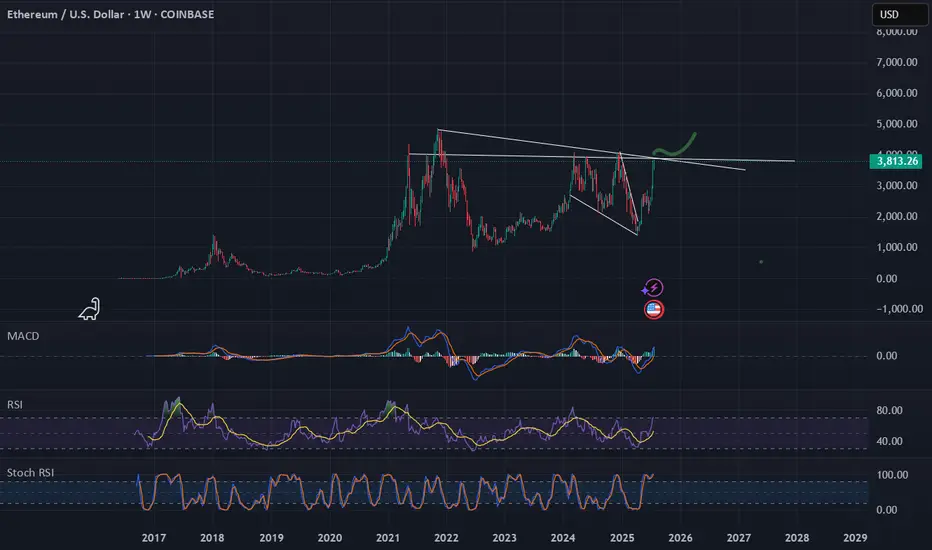
Ethereum heading towards $4000Ethereum heading towards $4000
Resistance lines across $4150 and $4200.
Due the growth of bitcoin we think ethereum could be next.
Based on the growing interest of defi.
Could also be a catalyst for mid and small cap altcoins.
Rsi = avg bullish
Stoch Rsi = avg bullish
Macd = avg bullish
Sell NATGAS into OCT/NOVNatalie has fromed a H&S and has broke through all of the supporting EMAs leading to most of the indicators turning bearish.
My approach for the forseeable is seeling bounces until the winter season approaches.
Of course Natalie is extremely susceptible to trend changes due to economical data and has to be monitored closely. Currenlty I'm a bear.
Only selling once it breaks and retests, where I will once again reasses based on economics such as storage, production, imports and demand.
Target around $2.5 where interestingly a gap (red rectangle) sits from Nov - 24.
Elliot Wave (although not a great fan) kind of aligns as well as the 0.786 fib level which began forming at the beginning of 2024.
Storage | Volatility | Price Outlook
U.S. natural gas markets are stabilizing as volatility trends back toward seasonal norms.
📉 Volatility has dropped from 81% in Q4 2024 to 69% in mid-2025
🏪 Storage is currently at 3,075 Bcf,
🔻 4.7% lower YoY
🔺 5.9% higher than the 5-year average
🚢 LNG exports remain strong—up 22% YoY and 74% above the 5-year average
🔌 Domestic demand is seasonally weaker but steady
➡️ Despite being below last year’s levels, storage surplus vs. the 5-year average acts as a soft ceiling on price.
➡️ Historical analogs suggest a fair value range between $2.50–$3.20/MMBtu in the short term.
📊 Current price action around $3.00–$3.40 looks slightly overheated unless a fresh catalyst emerges (heatwave, export spike, etc.).
🧭 Watching for:
Injection trends over the next few weeks
Cooling demand in power sector
Resistance around $3.40
Support near $2.80

Gold prices are about to rebound?Gold prices are about to rebound?
Just on Saturday, Trump patted Powell on the shoulder, and those who understand understand.
Cut interest rates quickly!!!
Next week will usher in three major news, and global analysts regard next week as a life-or-death moment that determines the future direction of gold prices.
1: Will the Fed cut interest rates in September?
2: How will the tariff war on August 1 evolve?
3: Major non-agricultural data
The trend of gold prices next week is unpredictable, and every day is accompanied by the impact of policy news.
Volatility will become more and more stimulating.
Technical aspect: Gold prices have completed the correction, and I think the bulls are about to counterattack.
As shown in Figure 4h
3330 is an important support level
3440 is a key top area
3360-3380 is a key middle pressure level
We will continue to adopt a low-price long strategy on Monday
Target: 3365-3380-3400-3440-3500+
I firmly believe that next week will be the beginning of a big bull market. Even if it is not, this should be the last chance for bulls to get off the train.
Short-term: $3380-3400 (this week's high resistance).
Medium-term: If it breaks through $3400, it will open the channel to $3500.
Gold operation strategy
Aggressive investors: Buy at the low point of the $3300-3330 range, with a target price of $3380.
Conservative investors: Wait for a breakthrough of $3360 before chasing more, and set the stop loss below 3300.
Conclusion: Gold prices are expected to rebound next week, and the expectation of a rate cut by the Federal Reserve is the core driving force.
Investors are advised to pay attention to non-agricultural data and geopolitical situation, and seize the opportunity to layout at low levels.
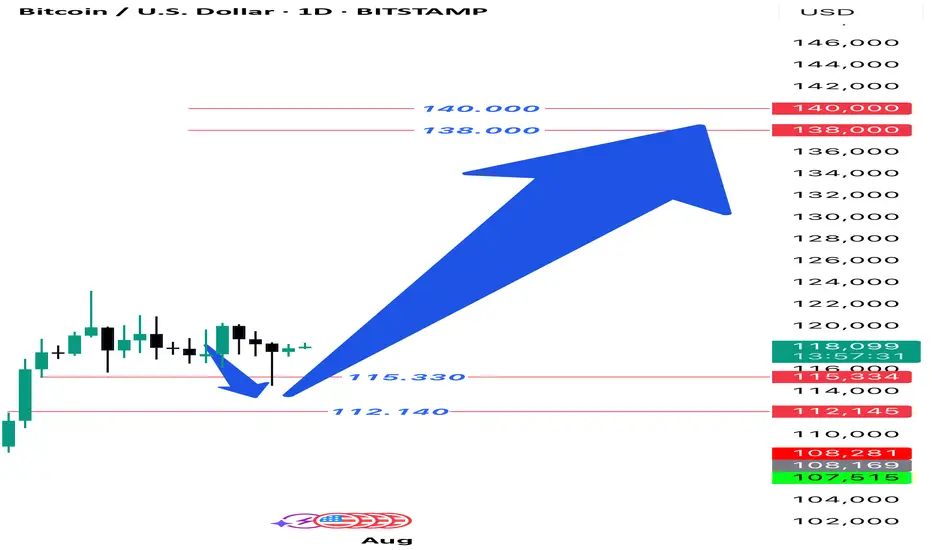
BTCUSD Daily Setup If you look back at my previous analysis of Bitcoin, you will notice that on the daily time frame, the price entered the specified range and then continued its upward trend, and we expect this upward trend to continue to the range of 138,000 to 140,000.
#XAUUSD #BTCUSD #ICT #OrderBlock #FundedTrader #TradingStrategy
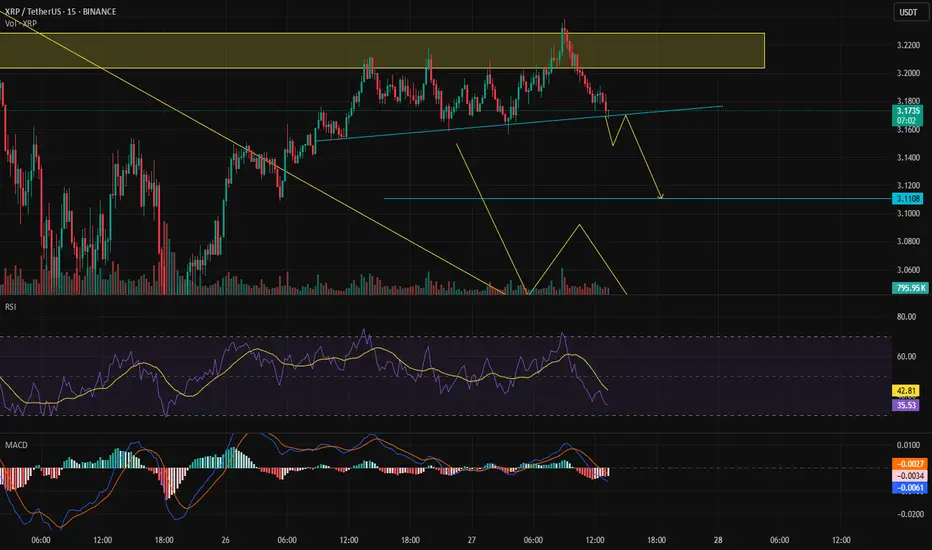
Short-term timeframeIn the short-term timeframe, a short position can be taken, and using a trailing stop, you can stay with the trend if it continues — it's worth the risk.
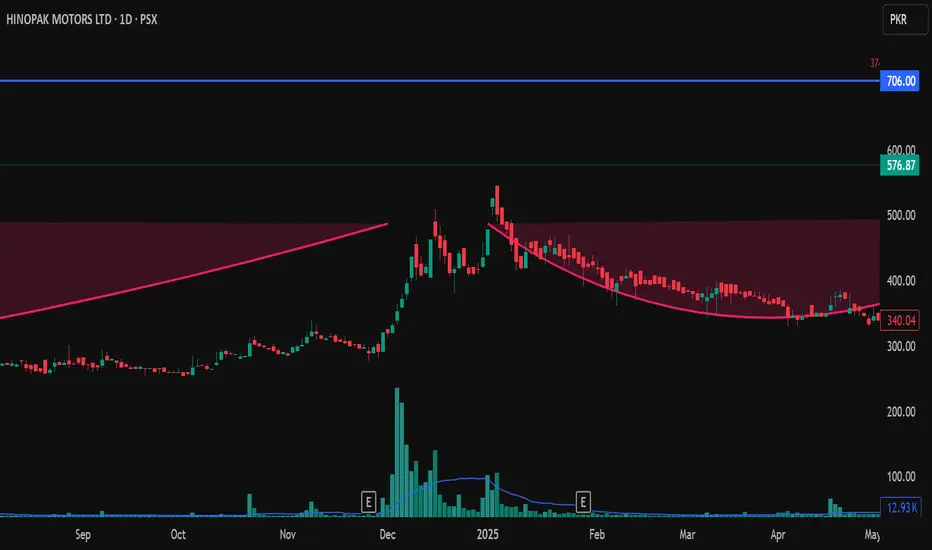
hinobuy at 522. and 470, tp 700. if you want detail plz ask. i m not writing much right now. stay cool
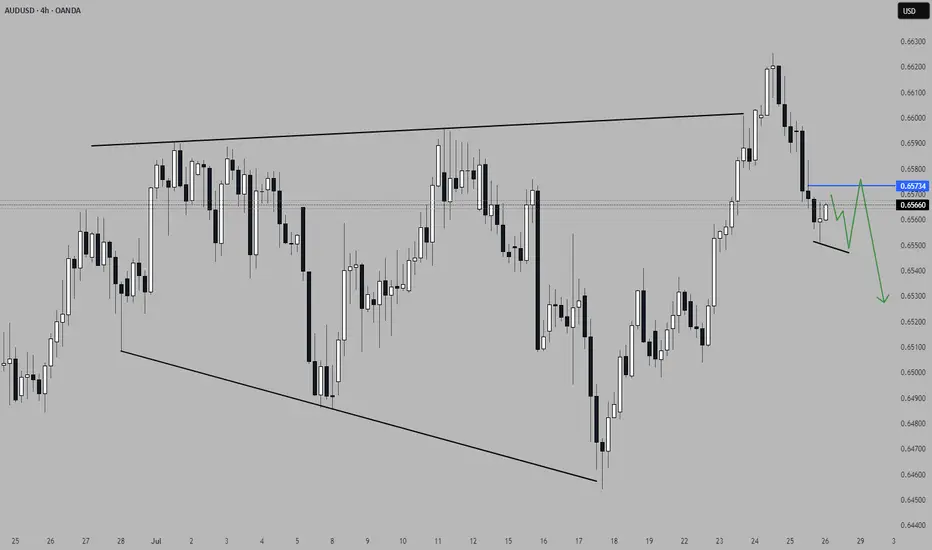
AUDUSD looks promising for a continuationThis pair presents a potential trade opportunity in the form of a short continuation. The price did reach a significant Area of Interest (AoI) in form of an expanding 3-touch structure before turning around. Price did close outside the structure on the H4 with a candlestick reversal pattern and printed a bearish high-test candle on the daily timeframe. This clearly shows a shift in momentum and I am now waiting for a lower time frame (LTF) continuation pattern to confirm the direction and a valid candlestick pattern for entry.
📈 Simplified Trading Rules:
> Follow a Valid Sequence
> Wait for Continuation
> Confirm Entry (valid candlestick pattern)
> Know When to Exit (SL placement)
Remember, technical analysis is subjective; develop your own approach. I use this format primarily to hold myself accountable and to share my personal market views.
⚠ Ensure you have your own risk management in place and always stick to your trading plan.
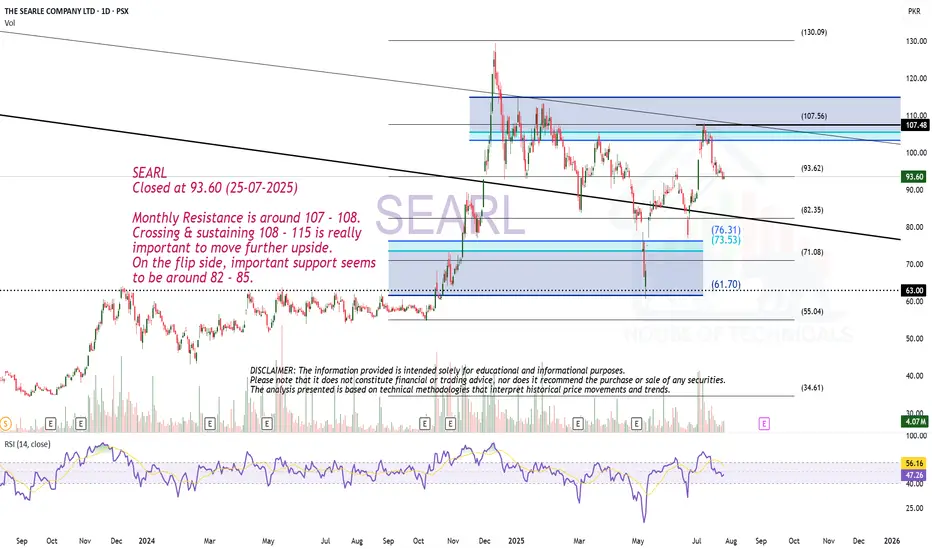
Play on Levels.SEARL
Closed at 93.60 (25-07-2025)
Monthly Resistance is around 107 - 108.
Crossing & sustaining 108 - 115 is really
important to move further upside.
On the flip side, important support seems
to be around 82 - 85.
Bullish on Monthly tf.FFL
Closed at 16.29 (25-07-2025)
Bullish on Monthly tf.
Took Support from a very important
level around 11 - 12.
Immediate Resistance is around 18 - 19
Crossing & Sustaining 20 with Good Volumes,
may lead it towards 25 then 28.
However, breaking 11 this time, may lead
further selling pressure.

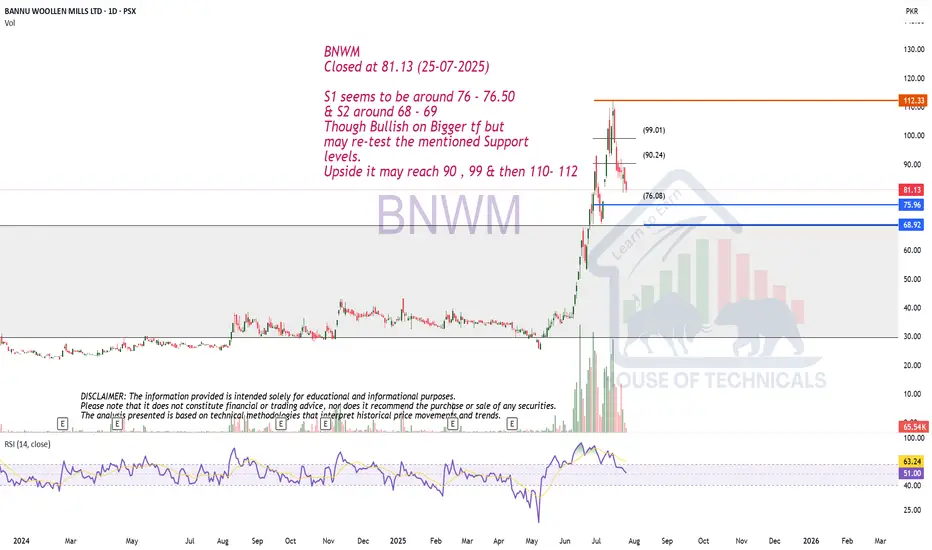
Wait for the Proper Support Level.BNWM
Closed at 81.13 (25-07-2025)
S1 seems to be around 76 - 76.50
& S2 around 68 - 69
Though Bullish on Bigger tf but
may re-test the mentioned Support
levels.
Upside it may reach 90 , 99 & then 110- 112
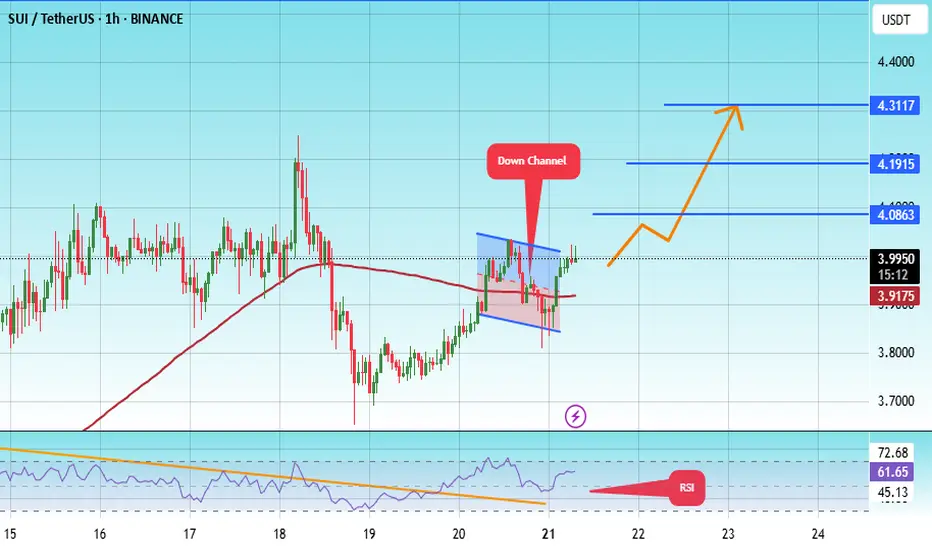
#SUI/USDT potentail to 4.30 $#SUI
The price is moving within a descending channel on the 1-hour frame, adhering well to it, and is on its way to breaking strongly upwards and retesting it.
We have support from the lower boundary of the descending channel, at 3.85.
We have a downtrend on the RSI indicator that is about to be broken and retested, supporting the upside.
There is a major support area in green at 3.80, which represents a strong basis for the upside.
Don't forget a simple thing: ease and capital.
When you reach the first target, save some money and then change your stop-loss order to an entry order.
For inquiries, please leave a comment.
We have a trend to hold above the Moving Average 100.
Entry price: 3.99.
First target: 4.08.
Second target: 4.19.
Third target: 4.30.
Don't forget a simple thing: ease and capital.
When you reach your first target, save some money and then change your stop-loss order to an entry order.
For inquiries, please leave a comment.
Thank you.
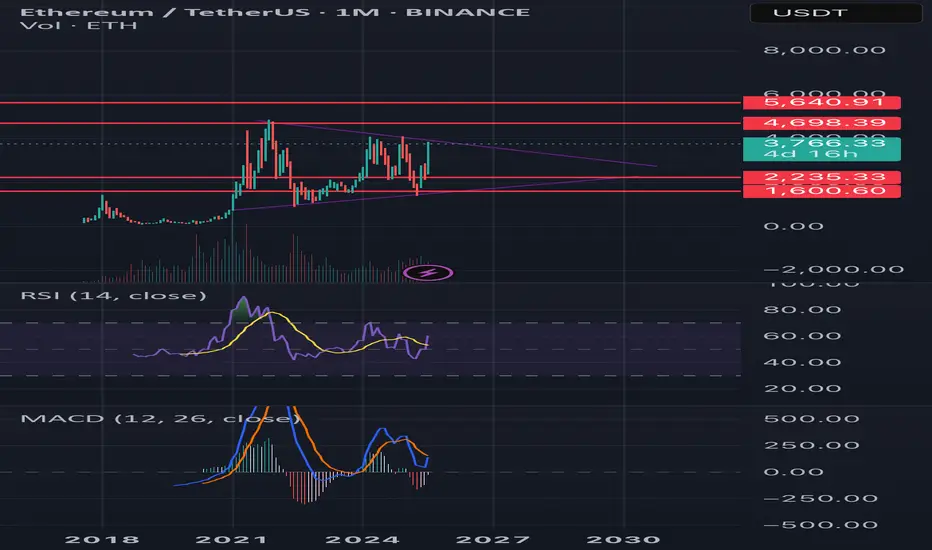
Ethereum monthly analysis Price Action & Structure:
• Ethereum is forming a symmetrical triangle, indicating a potential breakout or breakdown in the coming months.
• Key resistance levels:
• $4,698 (mid-term resistance)
• $5,640 (all-time high area)
• Key support levels:
• $2,235
• $1,600
Indicators:
• RSI (14): Currently around 50, showing neutral momentum but slightly recovering. No overbought or oversold condition.
• MACD (12,26): The blue line is attempting to cross above the orange line, a possible early bullish crossover. Histogram shows weakening bearish momentum.
• Volume: Decreasing volume inside the triangle pattern, typical before a breakout.
Outlook:
• A breakout above $4,698 with volume could target the $5,640 zone.
• A breakdown below $2,235 would open the door toward $1,600 or lower.
• Wait for a confirmed breakout from the triangle before major entries.
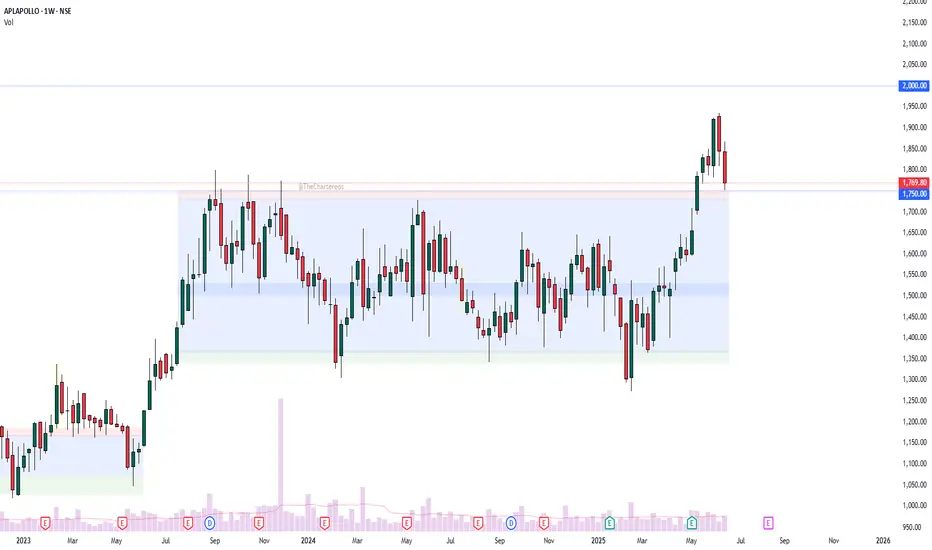
APLAPOLLO - retest phase?APL Apollo – Chart Analysis
The structure is quite clear:
Price consolidated within a tight range for nearly 2 years.
This was followed by a strong breakout accompanied by a notable volume spike.
Currently, the stock appears to be in the retest phase of the breakout zone.
Fundamental Trigger:
📢 APL Apollo Q4 Results: Net profit up 72% YoY; Board approves ₹1,500 Cr capex plan.
What’s next?
Will the retest hold and lead to the next leg up?
Let me know your thoughts 👇
Disclaimer: This analysis is for educational and informational purposes only. It is not investment advice or a recommendation to buy or sell any security. Please do your own research or consult a financial advisor before making any investment decisions. I am not a SEBI-registered advisor.
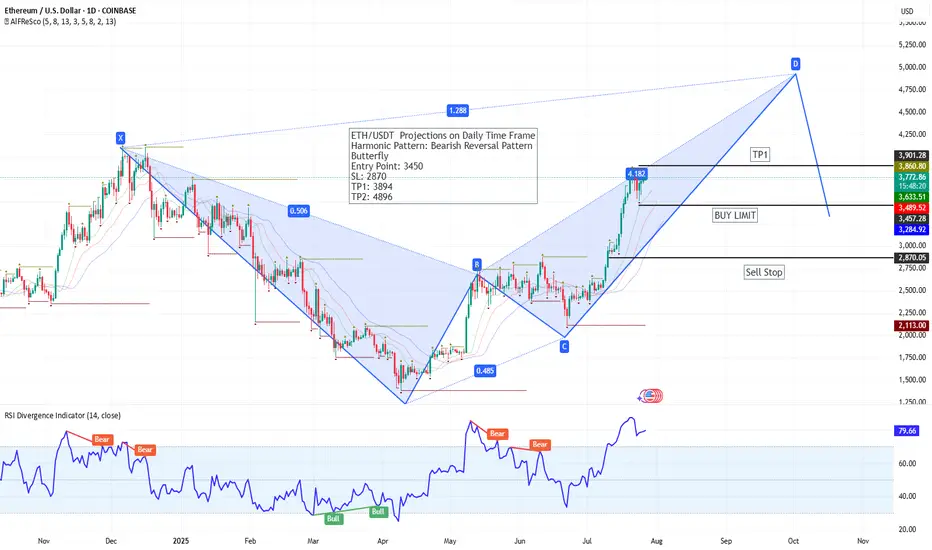
ETH/USDT – Daily Chart | Bearish Harmonic Setup (Butterfly Patte@ Eth/USDT Daily time frame A potential Bearish Butterfly harmonic pattern is unfolding on the daily timeframe. Price is currently approaching the D point completion zone, projecting a reversal area near 4896.
📌 Trade Setup:
Buy Limit: 3450
Stop Loss: 2870
TP1: 3894
TP2: 4896
RSI is approaching overbought levels (currently 79.57), suggesting caution as price nears the harmonic resistance zone. If price completes the pattern near TP2, traders can watch for a potential bearish reversal opportunity.
Pattern aligns with historical RSI divergences and prior structure. Monitor price action closely as we approach the D point.
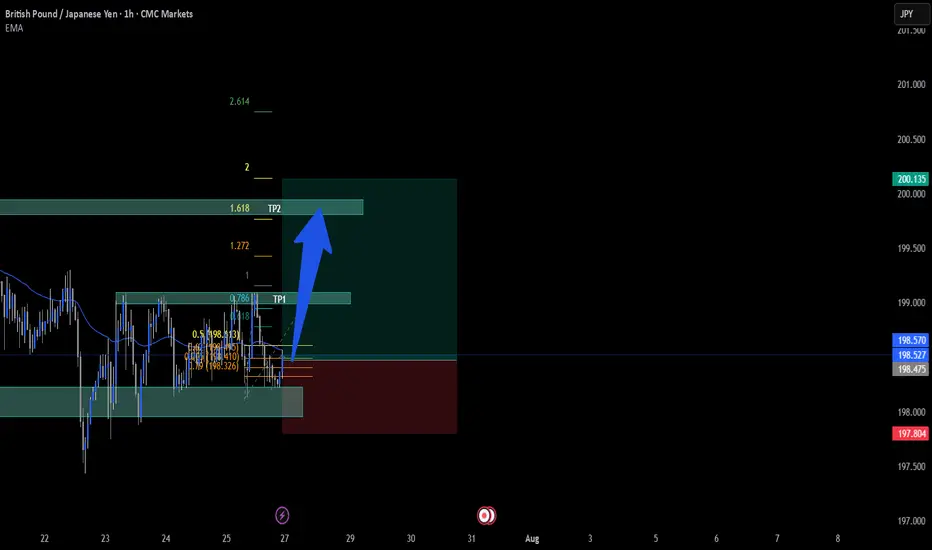
GBPJPY LONGHello, as you can see on the GBPJPY chart, there is a very strong support zone that price has not broken. In fact, we can also identify a fake breakout below that level, which reinforces the strength of the support.
My first target (TP1) is set at the next strong resistance zone, which aligns with a previous support turned resistance. The second target (TP2) is the Order Block (OB) at the top, which also aligns with where my strategy predicts the price will move. This setup suggests a potential bullish move from the current levels.
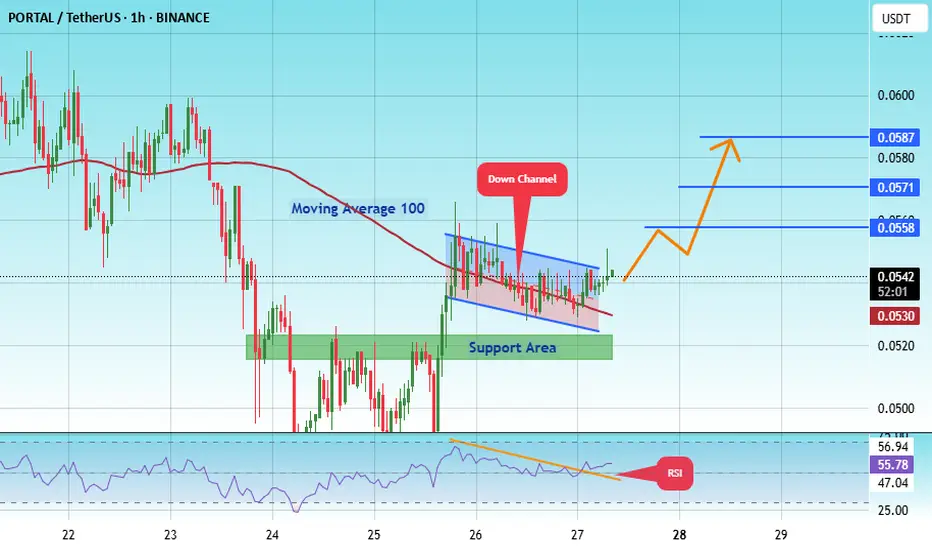
#PORTAL/USDT Medium-term Bullish potential#PORTAL
The price is moving within a descending channel on the 1-hour frame, adhering well to it, and is on its way to breaking strongly upwards and retesting it.
We have support from the lower boundary of the descending channel, at 0.0527.
We have a downtrend on the RSI indicator that is about to break and retest, supporting the upside.
There is a major support area in green at 0.0520, which represents a strong basis for the upside.
Don't forget a simple thing: ease and capital.
When you reach the first target, save some money and then change your stop-loss order to an entry order.
For inquiries, please leave a comment.
We have a trend to hold above the 100 Moving Average.
Entry price: 0.0543
First target: 0.0558
Second target: 0.0571
Third target: 0.0587
Don't forget a simple thing: ease and capital.
When you reach your first target, save some money and then change your stop-loss order to an entry order.
For inquiries, please leave a comment.
Thank you.