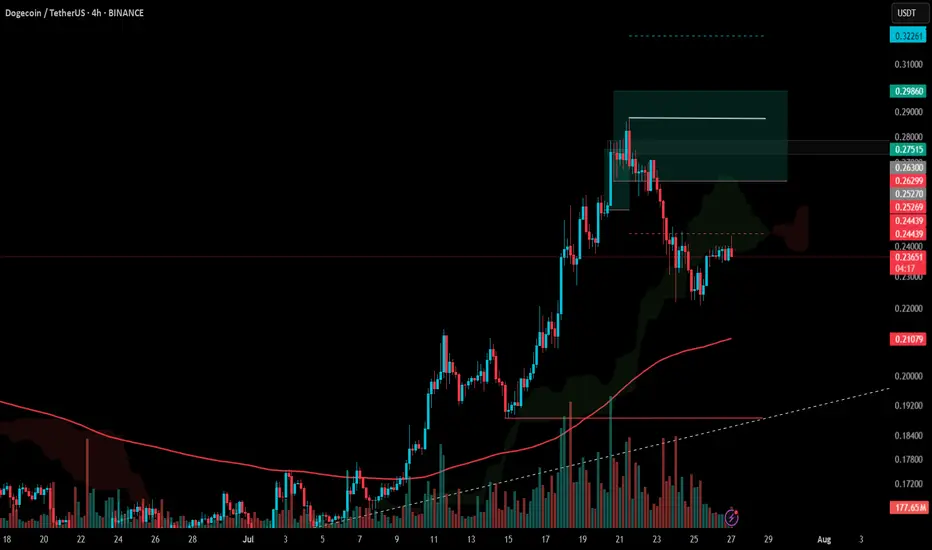
#DOGE Update #2 – July 27, 2025#DOGE Update #2 – July 27, 2025
I previously made two purchases in Doge, and closed one of them with approximately a 10% profit. You can see this in earlier posts as well. After that profit-taking, I opened another position in Doge. However, this time Doge chose to make a correction.
I’m still holding the position and haven’t averaged down yet. My entry level is currently around the $0.262 zone. Unless I see a sharp drop or a clear breakout signal, I find it more reasonable to hold onto the cash in my account rather than averaging down.
At the moment, along with XRP, I’m experiencing around a 10% drawdown from the current level. However, I will continue to wait. I don't think it's reasonable to make a new purchase from this level.
If I decide to average down, I plan to do it near the $0.18 zone. There's also a slight chance I may add at the $0.21 level, but I'm not certain yet. From its current position, I expect approximately a 14% profit. I will continue holding this position.
Harmonic Patterns
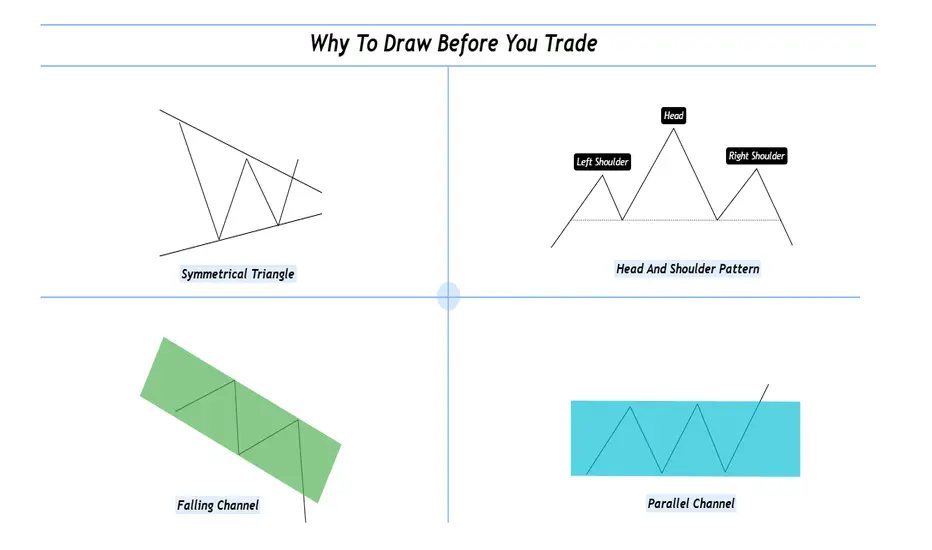
Why To Draw Before You Trade ?Hello fellow traders and respected members of the trading community, In a fast paced market dominated by automation and algorithms, we often forget the value of simply picking up a tool and drawing on our charts. Let’s revisit why this fundamental habit still holds the power to sharpen our edge and elevate our decision-making.
Why We Should Draw and Trade? Turning Charts Into Clarity
Introduction-:
In an age of auto-generated indicators, black-box algorithms, and AI-driven signals, many traders are drifting away from one of the most fundamental trading tools: manual chart drawing.
But what if the very act of drawing is not just an old habit—but a powerful trading edge?
This publication explores why actively drawing on charts and trading based on visual context can elevate your market understanding and execution like nothing else.
1. What Does It Mean to “Draw and Trade? Drawing isn’t just technical analysis it’s interactive thinking. When you draw, you're mapping the structure of the market using tools like
Trendlines
Support & Resistance zones
Chart Patterns (Head & Shoulders, Flags, Triangles, etc.)
Supply & Demand levels
Gaps, Fibonacci levels, and more
Once the chart is marked, you’re no longer entering trades blindly you’re entering with context, clarity, and confidence.
2. The Psychology Behind Drawing
Manual drawing engages your focus, discipline, and decision-making. You don’t just predict, you process and It forces you to slow down helping reduce impulsive trades. Drawing anchors your emotions and keeps you mindful. The act of drawing becomes a psychological filter—helping you trade from structure, not stress.
3. Why It Beats Indicator Only Trading?
Indicators are reactive. Drawing is proactive.
Here’s the difference:
Indicators show what already happened
Drawing lets you prepare for what could happen
You learn to-:
Anticipate breakouts, fakeouts, and reversals, Understand market structure and Develop your own strategy not depend on someone else's signal. In short you become the strategist, not just a follower.
4. The “Chart Time” Advantage
Just like pilots need flight hours, traders need chart hours. Drawing charts manually gives you those hours.
You start to see patterns that repeat and notice behavior shifts before they show on indicators. Build a visual memory of how the market moves and It’s this visual experience that separates analysts from traders.
5. Real-World Edge: Case Studies
Wyckoff Distribution: Mapping the structure—BC, AR, ST, UT, LPSY—helps anticipate smart money exits.
Gap Zones: Marking an old breakaway gap can help predict future rejection or support
Demand Zones + Fib Confluence: Drawing reveals high-probability reversal zones most indicators miss
Each drawing becomes a trade-ready story with logic and risk control.
6. From Drawing to Discipline
Drawing is not just prep it’s planning. You trade with a clear plan and pre-identified entry/exit zones this reduced emotional interference and It becomes your personal visual rulebook. No noise no randomness just structure driven action.
7. Final Thoughts: The Trader’s Mind vs. The Machine
Yes, AI and indicators are useful.
But your most powerful edge?
Your mind.
Your eyes.
Your experience sharpened through drawing.
If you want to evolve from a reactive trader to a consistent performer, here’s the golden rule:
Stop watching. Start drawing. Trade what you see, not what you hope.
I hope you will like this post, Thanks for giving your valuable time for reading.
Regards- Amit
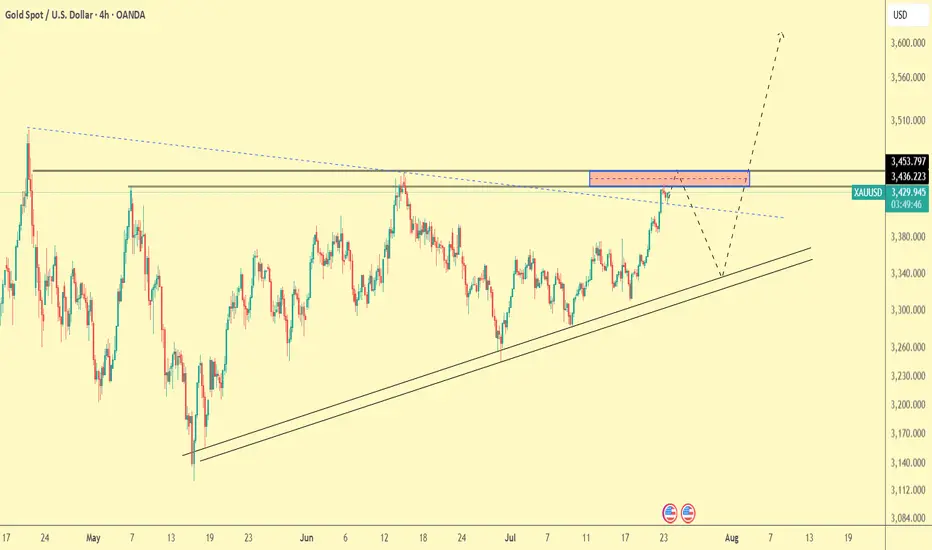
Gold Trade Plan 23/07/2025Dear Traders,
What we see on the chart is that the price is trying to reach the previous pivot around the 3450 area. I expect a correction from this level towards the 3370 area.
Regards,
Alireza!
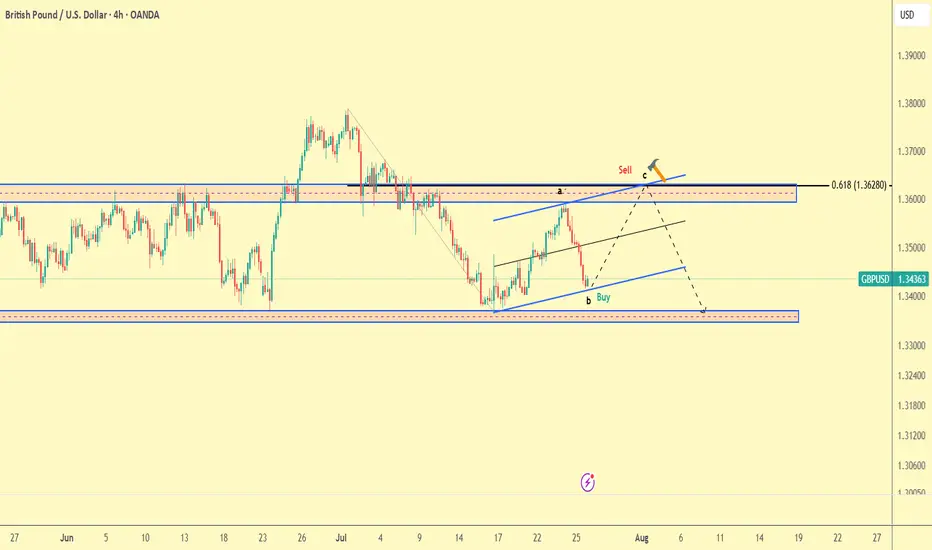
GBPUSD Trade plan 27/07/2025Dear Trader,
The pound has entered a corrective phase, and it seems that the corrective phase will continue. The current zone is a good area for buying until the 1.36 zone. At the 0.618 Fibonacci level, considering the channel's peak and the resistance zone, I expect a drop to the 1.33000 region.
Regards,
Alireza!
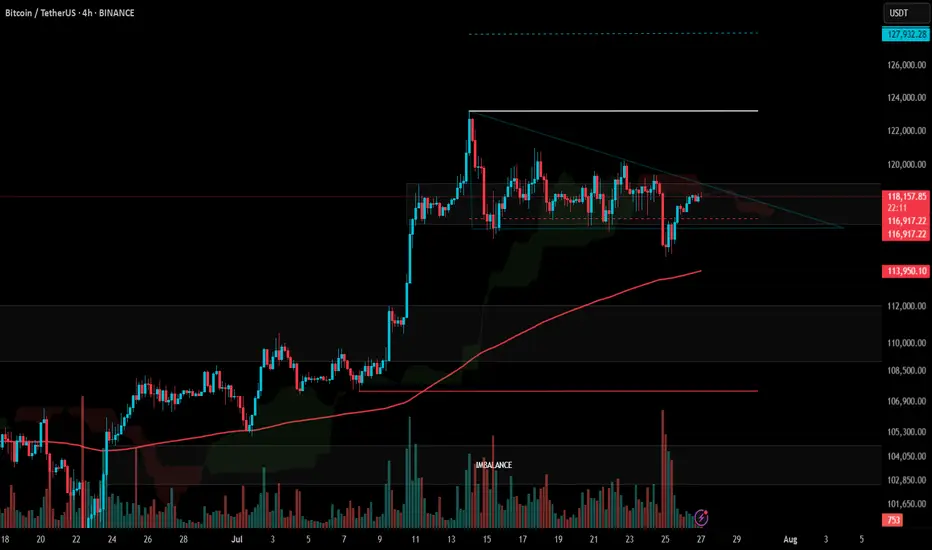
#BTC Update #10 – July 27, 2025#BTC Update #10 – July 27, 2025
Bitcoin continues to move between $116,400 and $118,900, and staying within this range is actually a positive sign, even in bearish scenarios. A decisive close below $114,000, however, could open the door for a deeper and more prolonged correction.
Although BTC hasn’t broken to new highs yet, its ability to hold here means the trend isn’t broken. A strong breakout above $118,900 could lead to a rally toward $123,300 and possibly even $128,000.
🔹 On the 4H chart, BTC seems to have completed its minor correction.
🔹 On the daily chart, the correction remains incomplete – despite dipping to $114,700, the key $112,900 zone hasn’t been tested.
In lower timeframes, BTC remains squeezed within a symmetrical triangle. While it occasionally pokes out, it quickly returns inside — showing indecision.
📌 Direction is unclear at the moment. There’s no strong signal for Long or Short. Waiting for confirmation with volume and a clear breakout is the safer play.
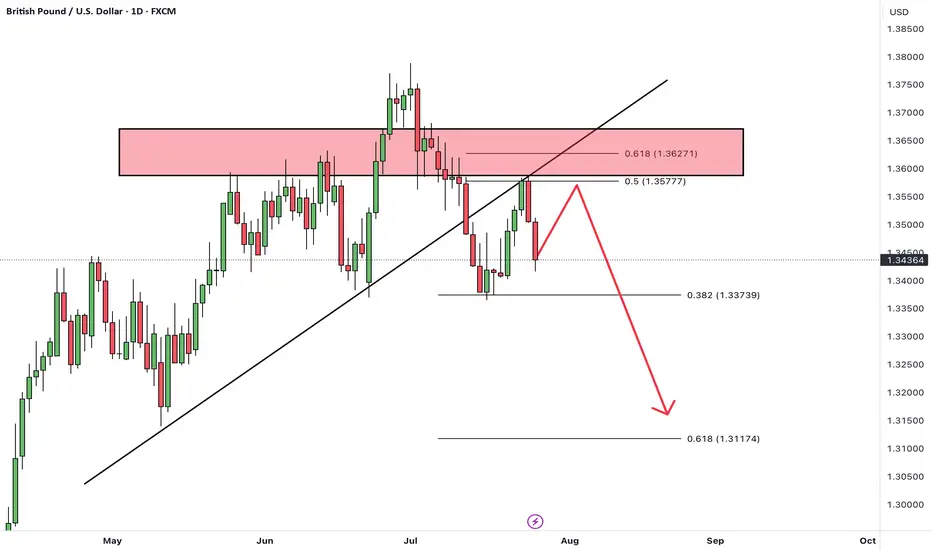
GBPUSDHello Traders! 👋
What are your thoughts on GBPUSD?
GBP/USD has broken below a trendline and has completed a retest (pullback) to the broken level.
The pair is now positioned for a potential downward move.
After some short-term consolidation, we expect price to drop at least toward the next identified support level.
As long as GBP/USD stays below the broken trendline, the bearish bias remains valid, and further downside is likely.
Don’t forget to like and share your thoughts in the comments! ❤️
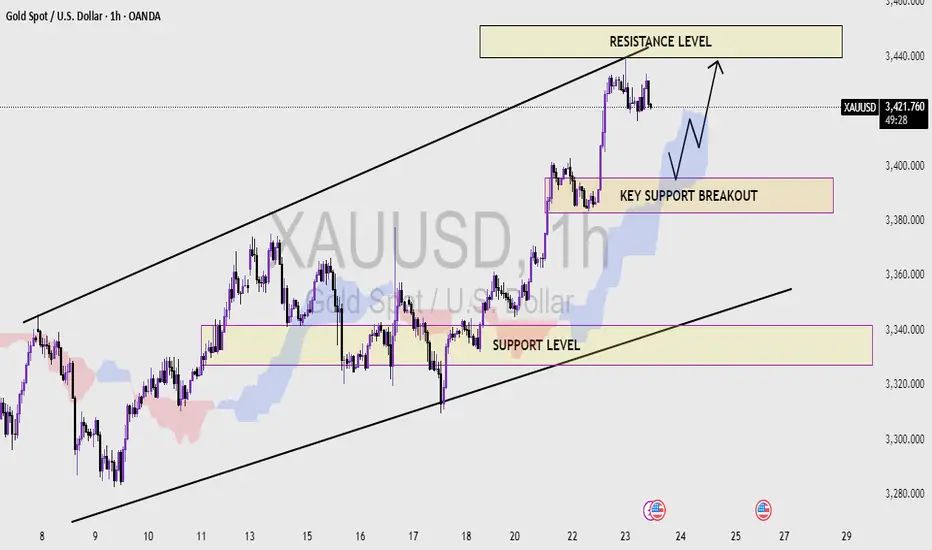
XAUUSD (1H Time frame) Read the captionXAU/USD Analysis (1H Timeframe )
This chart represents the XAU/USD (Gold vs US Dollar) price movement on a 1-hour timeframe, showcasing a well-defined ascending channel. The analysis highlights three critical zones:
1. Resistance Level (Upper Blue Zone):
This zone, located around the $3,440 - $3,450 range, marks the potential upper limit of the current bullish channel. A breakout above this level could indicate strong bullish momentum continuation.
2. Key Support Breakout Zone (Middle Purple Zone):
Around the $3,390 - $3,400 range, this area previously acted as resistance and now serves as a key support level. A price retest and bounce from this zone could confirm it as a new support base, potentially triggering a move toward the resistance zone again.
3. Support Level (Lower Purple Zone):
Found near the $3,320 level, this is the broader trendline and horizontal support zone that would be critical if the price breaks below the key support area. It acts as a major demand zone within the ascending channel.
Observations:
The price is currently in a strong uptrend within the rising channel.
A retest of the key support breakout zone is anticipated before potentially pushing higher toward resistance.
A breakdown below the key support could trigger a move toward the lower support level.
Technical Bias:
Bullish as long as the price remains above the key support level.
Bearish reversal may occur on a confirmed breakdown below the ascending channel and lower support zone.
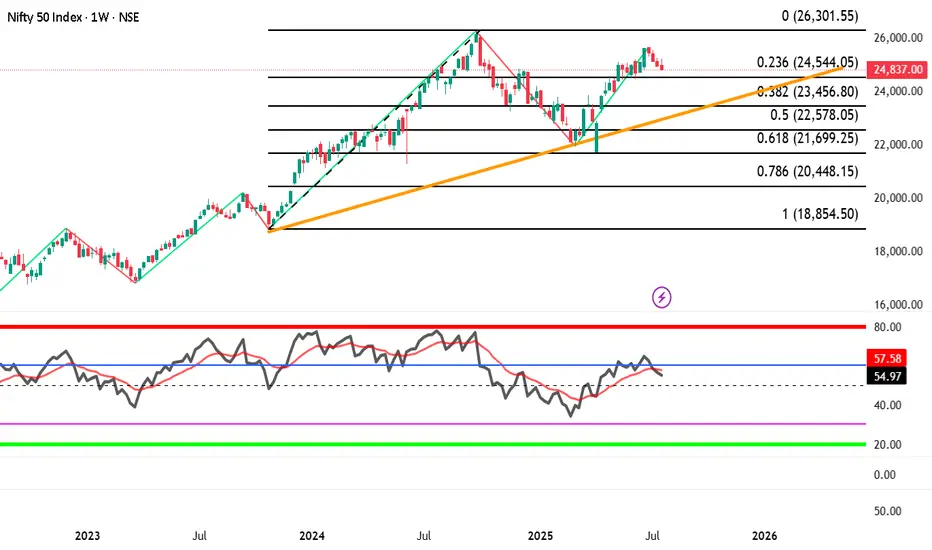
Nifty index showing downtrend with negative divergence BEARISH VIEW Nifty index --showing downtrend with negative divergence , watch out important trendline breakdown and fib. levels on nifty index.
if it happens than there might be BLOOD BATH IN MIDCAP AND SMALL CAP INDEX ALSO
Nifty index may fall big time if breaks 24544 than 23460, 22580, 21700 possible.
lets see
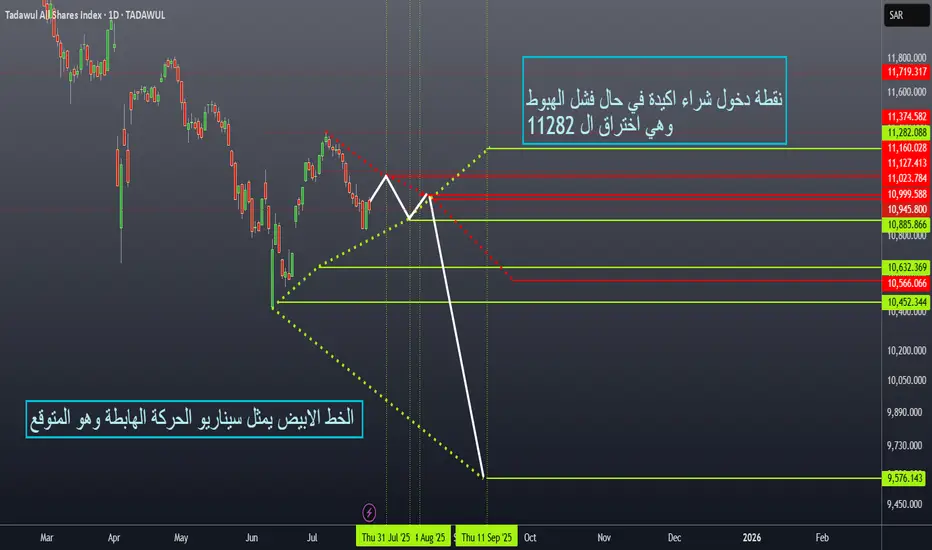
TASI Key Support & Resistance Levels This idea focuses on the Saudi Stock Market (TASI) key support and resistance levels based on time-sequenced price action.
Current support zone is highlighted (Point 1).
Time-based sequence:
🔺 Resistance on July 31 at 11126
🟢 Support on August 11 at 10885
🔺 Resistance on August 14 at 10999 / 10945
🟢 Support on September 1 at 9576
Connecting these points reveals the expected scenario shown in the second chart.
Key level: 11282 (Point 3) – A confirmed breakout above this level signals a strong buy opportunity, as it:
✔ Acts as a major support
✔ Breaks the descending channel
✔ Invalidates the bearish continuation scenario
📈 Watching for a bullish breakout above 11282 to enter long positions.
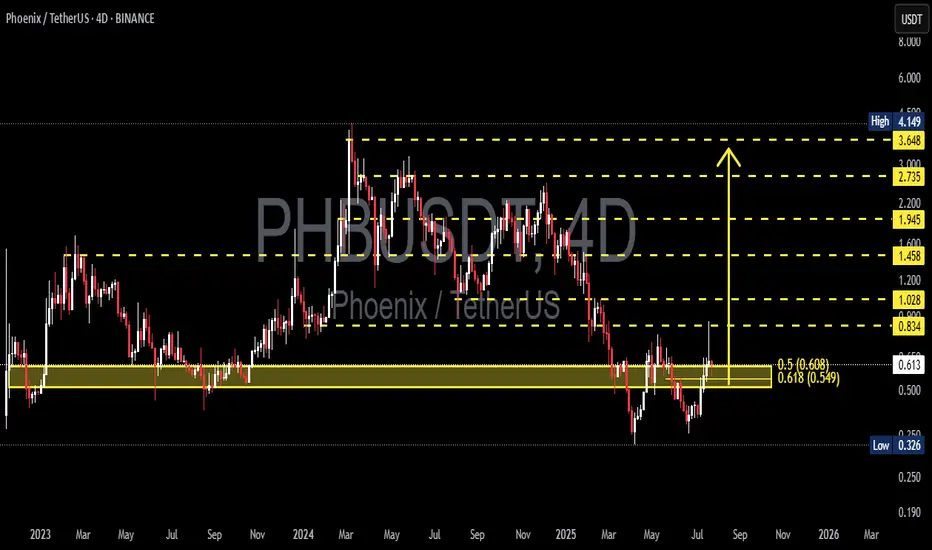
PHBUSDT Bounces from the Golden Pocket?🧠 Market Context & General Analysis
Phoenix (PHB) is currently at a critical juncture in its market structure. After a prolonged downtrend from its 2024 highs, price has now reacted strongly off a key Fibonacci Golden Pocket retracement zone (0.5–0.618), which also aligns with a historically respected demand area.
This level is not just a technical formality – it’s a zone where smart money typically enters, and historically it has provided reliable bullish reversals.
---
📍 Key Zones to Watch
🟨 Demand / Accumulation Zone:
0.549 – 0.608 → Fibonacci 0.5–0.618 + Historical support
⤷ Has been retested and shows early signs of a bullish reaction.
📈 Layered Resistance Zones (Fibonacci Targets):
0.834 → Minor resistance + potential double bottom neckline
1.028 → Previous structural resistance
1.200 → Psychological round level
1.458 → Key Fibonacci extension
1.945 – 2.735 – 3.648 → Mid/long-term Fibonacci targets
4.149 → All-Time High (ATH) on this chart
🔻 Major Support if Breakdown Occurs:
0.326 → Historical bottom / last line of defense
---
🧩 Pattern Formation: What’s Emerging on the Chart?
🔄 Potential Double Bottom:
Price structure is showing signs of a potential reversal formation in the form of a double bottom near the 0.55–0.61 zone. A confirmed breakout above the neckline at 0.834 would validate this bullish setup.
📉 Broken Downtrend Channel?:
PHB was previously trading in a downtrend channel. The current move suggests a possible breakout and the beginning of a trend shift or accumulation phase.
---
✅ Bullish Scenario: The Rise of the Phoenix
If the price holds above 0.608 and confirms with a strong breakout above 0.834, a bullish trend reversal could follow.
🚀 Short-term targets: 0.834 → 1.028
🔥 Mid-term targets: 1.200 → 1.458 → 1.945
🌕 Long-term potential: 2.735 – 3.648 – 4.149
Validation Key: Break above 0.834 with strong volume
Bullish confirmation candle: Bullish engulfing / Marubozu on 4D or Daily
---
⚠️ Bearish Scenario: Breakdown Threat Looms
If the price fails to hold the 0.549 support level, we could see a continuation of the downtrend, potentially targeting:
💀 First stop: 0.45 – 0.40 zone
🧊 Extreme case: Drop toward 0.326 (historical low)
Breakdown Confirmation:
Daily or 4D close below 0.549
Followed by selling volume and no quick recovery
---
🎯 Potential Trading Strategies (Not Financial Advice):
🟢 Bullish Swing Entry: Buy zone at 0.55–0.61
⤷ Targets: 0.834 – 1.028
⤷ Stop-loss: Below 0.52 (close basis)
🔴 Breakout Trade: Enter on breakout above 0.834 with volume
⤷ Targets: 1.200 – 1.945
⤷ Stop-loss: Below 0.80
🔵 Bearish Play / Re-entry: Short if break below 0.549
⤷ Targets: 0.40 – 0.326
⤷ Stop-loss: Above 0.60
---
🧲 Final Thoughts
PHBUSDT is in a make-or-break zone, sitting atop the Golden Pocket and showing early bullish momentum. If buyers step in and maintain the momentum, we could be witnessing the early stages of a significant market reversal.
However, failure to hold the key support at 0.549 would likely shift the sentiment back into bearish territory. Volume and confirmation candles will be the deciding factor for the trend’s next direction.
#PHBUSDT #PhoenixCrypto #AltcoinReversal #GoldenPocket #CryptoTA
#FibonacciLevels #BullishSetup #BearishBreakdown #ChartPatterns
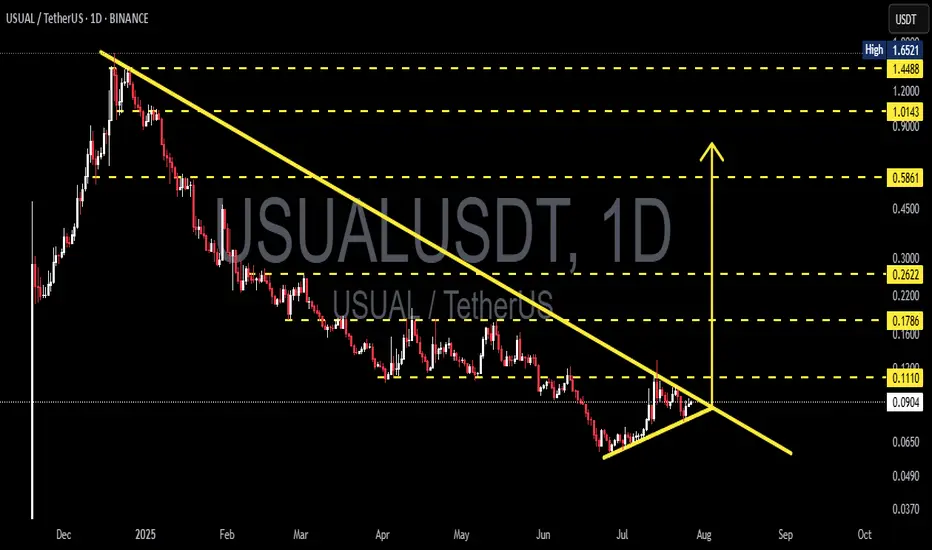
USUALUSDT Ready to Explode? Major Breakout From Downtrend?USUALUSDT is currently displaying a very compelling technical structure on the daily timeframe. After a long downtrend since early 2025, the price is now forming an accumulation pattern with increasing buying pressure.
---
📊 Pattern & Chart Structure Overview:
🔹 Descending Triangle Formation:
The price has been forming a series of lower highs with a gradually rising base, indicating a classic compression or accumulation pattern that often precedes a major breakout.
🔹 Rising Buying Pressure:
Notice the formation of higher lows since early July—this suggests that buyers are gradually stepping in, despite the macro downtrend still intact.
🔹 Low Volume = High Breakout Potential:
Volume remains relatively low, which is typical in the final stages of consolidation. Once a breakout occurs, it’s likely to be accompanied by a significant spike in volume.
---
🟢 Bullish Scenario (Confirmed Breakout):
If the price breaks above the descending trendline (~0.1110) with a strong daily candle and increased volume, it may ignite a bullish move with the following targets:
🎯 Upside Targets:
1. 0.1786 – Previous consolidation resistance
2. 0.2622 – Psychological zone and prior seller control area
3. 0.5861 – Medium-term target if momentum builds
4. 1.0143 and 1.4488 – Long-term bullish targets upon full trend reversal
🚀 The upside potential is massive as the price has a lot of room above once resistance is broken.
---
🔴 Bearish Scenario (Failed Breakout):
If the price gets rejected at the descending resistance and breaks down below the ascending support:
📉 Downside Targets:
1. 0.0650 – Minor support from July's accumulation zone
2. 0.0490 – 0.0370 – Previous cycle lows and potential bounce zones
⚠️ A breakdown would invalidate the current accumulation setup and suggest sellers still dominate.
---
🔍 Conclusion & Strategy:
USUALUSDT is now at a critical decision zone. The combination of a descending triangle, rising higher lows, and low volume makes it clear that a major move is brewing.
📌 Breakout = Big swing trade opportunity
📌 Breakdown = Avoid entries, wait for lower support zones
---
📈 Trader Recommendations:
✅ Set alerts above 0.1110
✅ Confirm breakout with strong candle + volume
✅ Aggressive stop loss below 0.0750
✅ Swing trade targets based on historical resistance & fib levels
#USUALUSDT #CryptoBreakout #AltcoinSetup #DescendingTriangle #CryptoAnalysis #BullishSetup #BearishSetup #BreakoutIncoming #TechnicalAnalysis
ADAUSDT Breaks Long-Term Downtrend – Critical Support Retest!The ADAUSDT pair is showing a compelling technical setup. The price has successfully broken out of a long-term descending trendline (yellow line) that had been acting as dynamic resistance since late 2024. This breakout came with strong momentum, signaling a potential shift from a bearish trend to a bullish reversal.
After the breakout, price managed to rally up to minor resistance around $0.90, but is now pulling back and retesting the key support zone (highlighted yellow box) — a previous strong resistance area now potentially flipping into support.
---
🟢 Bullish Scenario:
If the price holds above the $0.80 - $0.83 support zone, the break-and-retest structure will be validated.
A successful bounce from this area could push ADA back toward:
$0.90 (current minor resistance)
$1.13 (psychological and horizontal resistance)
$1.23 (previous supply zone)
$1.32 (recent local high)
A confirmed bullish continuation will be more convincing if the price forms a higher low and breaks above $0.90 with strong volume.
---
🔴 Bearish Scenario:
If ADA fails to hold the $0.8281 support and falls back below the descending trendline, then:
It may re-enter the previous range and test lower support around $0.75 or even $0.65.
This would suggest a potential false breakout and return to bearish territory.
Watch for bearish candlestick confirmations below $0.80 as an early warning.
---
📌 Pattern Insights:
Descending Trendline Breakout: Suggests a possible long-term trend reversal.
Break & Retest Structure: Price is currently testing the previous resistance zone as new support.
Layered Resistance Zones: Several clear resistance levels above provide logical targets for a bullish rally.
---
📊 Conclusion:
ADAUSDT has printed an early signal of a bullish reversal by breaking out of a long-standing downtrend. However, the sustainability of this trend depends heavily on the ability of price to hold the $0.80 - $0.83 support zone. Look for bullish confirmation candles in this area for a safer long entry.
#ADAUSDT #Cardano #CryptoBreakout #TechnicalAnalysis #Altcoins #BreakoutSetup #BullishRetest #CryptoChart #SupportAndResistance #PriceAction #TrendReversal

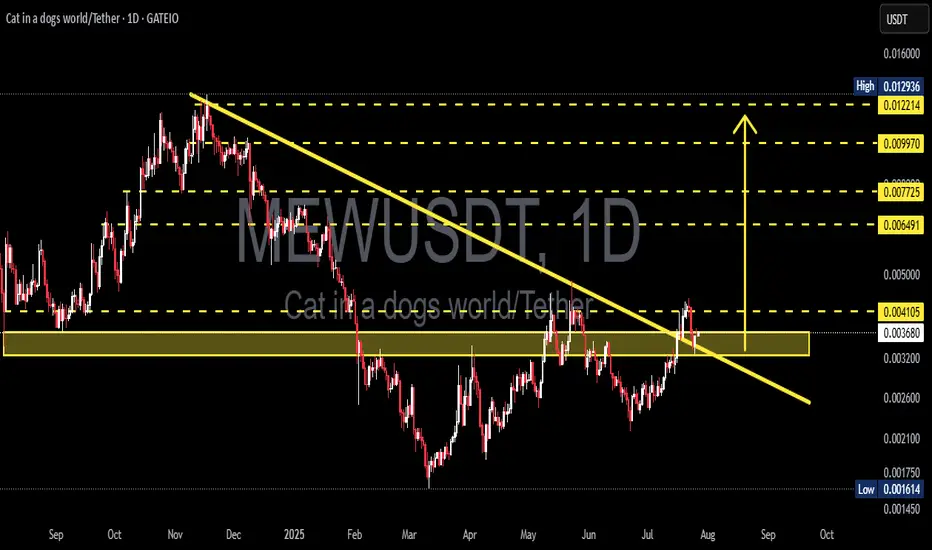
MEWUSDT Breakout! Rounded Bottom Reversal and Key Retest Zone!MEWUSDT has officially broken out of a long-term descending trendline that has capped price action since December 2024. The formation of a Rounded Bottom (Cup) suggests a strong accumulation phase and potential for trend reversal. The current retest of the breakout zone will be crucial in determining the next big move!
---
🔍 Technical Analysis Details:
1. Chart Pattern: A clear Rounded Bottom (Cup) pattern has formed, often signaling a bullish reversal. Price has broken through the descending trendline, and is now retesting the breakout zone (highlighted in yellow), which previously acted as resistance and is now turning into key support.
2. Resistance Levels (Upside Targets):
⚡ 0.004105 – First breakout point
🟡 0.006491 – Mid-level resistance
🟡 0.007725 – Previous local high
🟡 0.009970 – Strong resistance zone
🔵 0.012214 – Psychological resistance
🔵 0.012936 – Major swing high
3. Key Support Levels:
🟡 0.003200 – Current demand zone (yellow box)
🔵 0.001614 – Historical bottom
---
✅ Bullish Scenario:
If MEWUSDT holds above the 0.0032–0.0041 support zone and confirms it as a new base:
🎯 Target 1: 0.00649
🎯 Target 2: 0.0077
🎯 Higher targets: 0.0099 up to 0.0129 This breakout may be the start of a strong bullish rally, especially if accompanied by increasing volume.
---
⚠️ Bearish Scenario:
If price fails to hold the breakout zone and falls back below the trendline:
Price may revisit 0.0026 – 0.0020 support
Further weakness could push it back to the 0.001614 historical low
---
🧠 Conclusion:
MEWUSDT is showing early signs of a bullish reversal after breaking out of a long-term descending trendline and forming a rounded bottom pattern. The current retest zone is critical — holding this level could confirm the start of a bullish trend with multiple upside targets.
#MEWUSDT #CryptoBreakout #TechnicalAnalysis #Altcoins #MemeCoin #CryptoTrading #BullishSetup #RoundedBottom #TrendReversal #SupportAndResistance
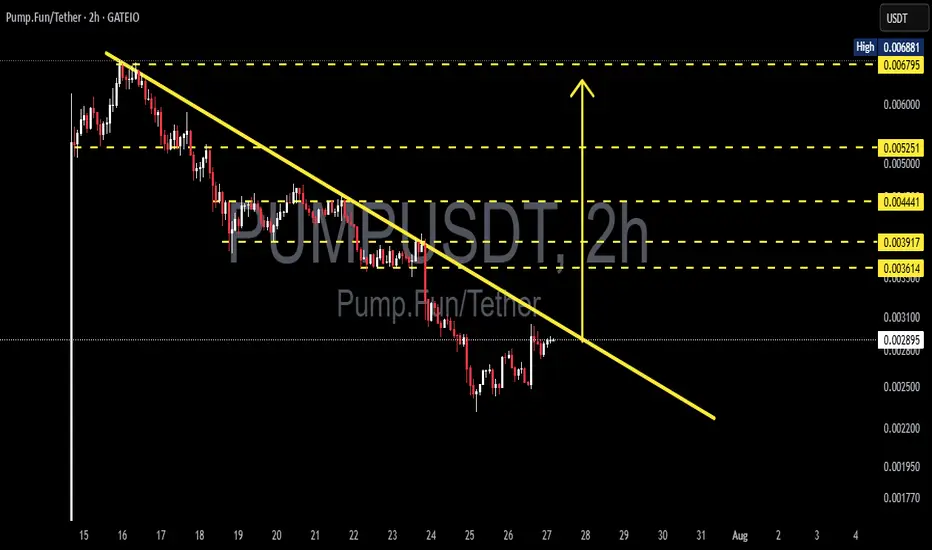
PUMPUSDT at a Decisive Turning Point – Breakout or Breakdown?
🧠 Technical Overview:
PUMPUSDT has been in a sustained downtrend over the past several days, forming a clearly defined descending trendline that has acted as a dynamic resistance since mid-July. Now, the price is approaching this key level once again—and this time, momentum seems to be shifting.
Interestingly, the current structure is forming what appears to be a potential Inverse Head and Shoulders (IH&S) pattern, a well-known bullish reversal formation. If confirmed with a breakout above the neckline/trendline, this could spark a strong upward reversal.
---
📌 Key Technical Highlights:
Descending Resistance Line: Holding since July 15, acting as the primary ceiling on price action.
Inverse Head and Shoulders Pattern: Potential bullish reversal setup forming on the 2H chart.
Volume: Currently low but showing signs of increase near the potential breakout zone—a bullish early signal.
---
📈 Bullish Scenario (Breakout Confirmation):
If the price successfully breaks and closes above the yellow trendline, especially with a strong candle and volume confirmation, we could see a momentum-driven rally toward the following targets:
1. ✅ $0.003614 – Minor resistance zone
2. ✅ $0.003917 – Retest of previous consolidation structure
3. ✅ $0.004441 – Measured move target from IH&S pattern
4. ✅ $0.005251 – 0.618 Fibonacci retracement area
5. ✅ $0.006795 – Major swing high and liquidity zone
> Potential upside of 100%+ from current levels if momentum continues.
---
📉 Bearish Scenario (Trendline Rejection):
If the price fails to break above the trendline and faces another strong rejection, then sellers could regain control, leading to:
⛔ $0.002500 – Psychological support and consolidation base
⛔ $0.001950 – Local bottom and potential long-term entry zone
> A failed breakout could trigger a quick sell-off or stop-loss cascade below the IH&S setup.
---
🔍 Technical Summary:
Indicator Status
Descending Trendline Actively being tested
Volume Increasing near breakout zone
RSI Rising from oversold territory
Price Pattern Inverse Head & Shoulders (Potential Reversal)
Risk/Reward High, favoring breakout strategy
---
🧭 Strategy Suggestions:
Aggressive Entry: Enter on breakout candle close above trendline with volume confirmation.
Conservative Entry: Wait for breakout + successful retest of the trendline before entering.
Stop Loss: Below neckline or recent swing low (~$0.0025).
Take-Profit Zones: $0.0039, $0.0044, $0.0052 and beyond.
---
🧠 Final Thoughts:
> “Charts never lie—PUMPUSDT is building pressure beneath a key resistance. If it breaks, the move could be explosive. Are you ready to ride the wave?”
Microcap altcoins often fly under the radar—until they don’t. This setup is showing the classic signs of a potential breakout. Use sound risk management and watch the next candle closely.
#PUMPUSDT #CryptoBreakout #InverseHeadAndShoulders #TechnicalAnalysis #AltcoinSetup #PumpFun #BreakoutAlert #MicrocapGems #CryptoReversal #ChartPatterns #CryptoSignal #CryptoStrategy
XRPThe primary regulatory catalyst boosting XRP's bullish outlook in 2025 is the resolution of Ripple Labs' long-standing lawsuit with the U.S. Securities and Exchange Commission (SEC). In March 2025, Ripple settled the case by agreeing to pay a $50 million fine, and crucially, it was clarified that XRP is not considered a security in the context of secondary market sales. This settlement removed years of significant regulatory uncertainty that had suppressed XRP's price and led exchanges to delist XRP. Following this resolution, major U.S. exchanges reinstated XRP trading, and institutional confidence in XRP surged, unlocking large-scale adoption and market participation by regulated investors.
Another key regulatory development providing bullish momentum is the passage of the GENIUS Act in the U.S. House of Representatives, approved around mid-July 2025. This legislation establishes a clearer federal framework for stablecoins and digital assets like Ripple's RLUSD stablecoin, further reducing regulatory risks and positioning XRP for broader mainstream utility and adoption.
In summary, the decisive legal settlement with the SEC and U.S. legislative progress (notably the GENIUS Act) have greatly clarified XRP's regulatory status, providing a green light for institutional entry through regulated channels such as exchange-traded funds (ETFs). The proliferation of XRP ETFs—including the approved ProShares XRP Futures ETF—amplifies this effect, enabling easier institutional and retail investment and fueling bullish price momentum
XRP Real-Life Use Cases in Finance
XRP REAL LIFE APPLICATION IN THE ECOSYSTEM.
1. Cross-Border Payments
XRP’s core financial use case is to act as a bridge for cross-border payments.
Traditional international money transfers often take days and involve high fees due to intermediary banks (the SWIFT system).
With XRP, financial institutions can instantly convert and transfer value across borders. Typical settlement times are 3–5 seconds, with transaction costs usually less than a cent.
Numerous global banks and remittance providers have adopted XRP and the RippleNet system to cut costs and provide real-time international payment services.
2. On-Demand Liquidity (ODL) & Liquidity Bridging
Banks and payment providers use XRP to manage liquidity.
With XRP as a bridge currency, financial institutions do not need to pre-fund nostro accounts in multiple countries. Instead, they can source liquidity ‘on demand’ using XRP, freeing capital and reducing operational costs.
On-demand liquidity flow improves cash efficiency and speeds settlements between a wide variety of global fiat currencies.
3. Micropayments
Due to low fees and fast settlement, XRP is suitable for micropayments.
This enables new use cases in digital content (e.g., pay-per-article, tipping creators) and gaming, where sending tiny amounts is otherwise unfeasible.
Such micropayment abilities open the door to innovative business models in finance and online services.
4. Tokenization and DeFi
The XRP Ledger supports tokenization of financial assets and decentralized finance (DeFi) use cases.
Financial firms can issue stablecoins or tokenized assets (including stocks, bonds, or other real-world assets) on-chain, fostering new kinds of investment products, automated trading, and settlement.
XRP’s ledger powers “sector-based index funds,” asset baskets, and other financial instruments, expanding real-world utility within decentralized finance.
5. Remittances
Remittance companies use XRP to offer faster and cheaper international transfers.
This is particularly valuable for migrant workers sending money home, reducing transaction times from days to seconds and cutting fees, thereby increasing the amount recipients receive.
6. Banking and Trade Finance
Some banks and trade finance platforms use XRP to improve operational efficiency.
By digitizing trade documentation and facilitating instant payments, XRP is helping modernize the traditionally slow and paperwork-heavy trade finance sector.
7. Collateral & Trading
XRP can be used as collateral in digital asset trading and arbitrage.
Traders and financial institutions leverage XRP for high-speed transfers between exchanges, using its liquidity to seize arbitrage opportunities and service margin calls rapidly.
Countries adopting XRP for real-life payments, especially cross-border transactions, include several key nations across Asia, the Middle East, and beyond. Here are some notable examples of countries actively integrating XRP into their financial systems and payment infrastructures as of 2025:
Japan: A pioneer in cryptocurrency adoption, Japan has multiple banks partnered with Ripple using XRP to streamline cross-border payments. The Bank of Japan and major institutions like SBI Holdings support XRP integration to provide faster, lower-cost international transactions across Asian markets.
United Arab Emirates (UAE): The UAE is proactively integrating blockchain technology, including XRP, with banks such as Zand Bank and fintech firms using Ripple’s platform for faster cross-border payments. Dubai’s financial initiatives leverage XRP to boost transaction efficiency within and beyond the region.
South Korea: Known for its vibrant tech ecosystem and supportive crypto regulations, South Korea has seen local banks experimenting with XRP to reduce international payment costs and increase speed, making it part of the broader fintech innovation landscape.
Mexico: Financial institutions in Mexico use XRP to improve remittances, especially those coming from the U.S., reducing processing time and fees significantly.
India: Given its large remittance market and fintech growth, India is exploring the use of XRP to address the need for low-cost, quick international payments.
Singapore: XRP adoption is growing here, with increasing numbers of users and integration of Ripple’s stablecoin RLUSD into payments.
United States: Some American banks and financial institutions are starting to integrate XRP for international payments, signaling growing institutional interest.
Canada: Banks like Canadian Imperial Bank of Commerce (CIBC) and remittance services use Ripple technology, including XRP, to enable faster cross-border money transfers.
Brazil: Various financial players collaborate with Ripple to modernize the country’s payment infrastructure using XRP.
United Kingdom: Institutions and fintech firms in the UK leverage Ripple’s technology for faster, cheaper international transactions.
Thailand and Sweden: Banks in these countries are partnering with Ripple to enhance their cross-border payment capabilities by leveraging XRP.
Egypt: Major banks are collaborating with Ripple to improve payment efficiency, including through XRP-based solutions.
In essence:
XRP directly addresses major friction points in global finance by cutting costs, increasing speed, and providing new ways for banks, companies, and individuals to move and manage money—all with increasing real-world adoption in cross-border payments, liquidity management, and digital asset innovation.

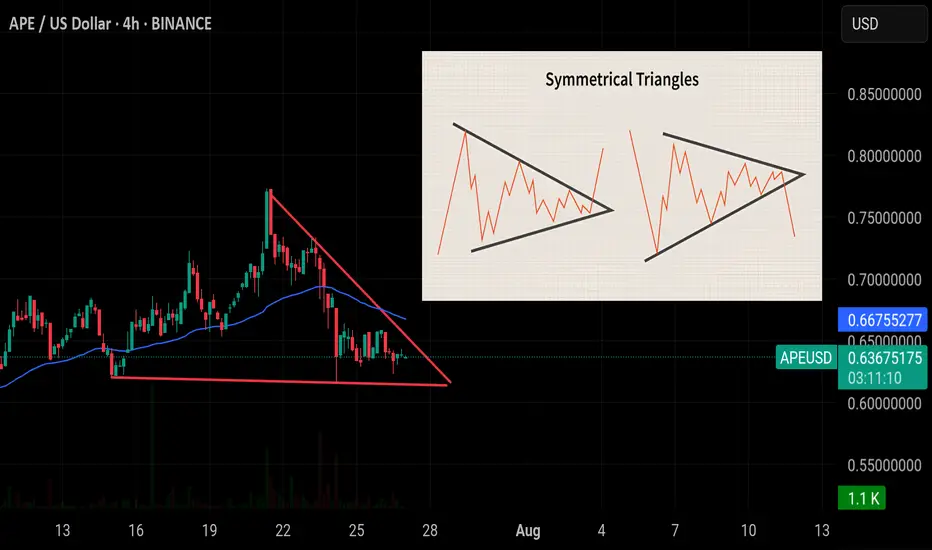
Symmetrical Triangle – Quick Guide 🕯A symmetrical triangle forms as price consolidates between two converging trendlines—one sloping up, the other down. It’s a neutral pattern, showing indecision.
📈 Breakout Direction Matters
Above = Bullish
Below = Bearish
🔍 Watch Volume:
It typically drops during formation and spikes on breakout—confirming the move.
✅ How to Trade:
Wait for a candle close outside the triangle on high volume
Enter in breakout direction
Stop-loss: just inside the triangle
⚠️ Pro Tip: Context matters—trend before the triangle often hints at breakout direction.
#Educational #btc #btcoin #eth
Bitcoin - August 25This technical analysis is for informational and educational purposes only. It does not constitute financial advice. Remember to always research and consult with a professional before making investment decisions. Good luck! 📈💼🚀
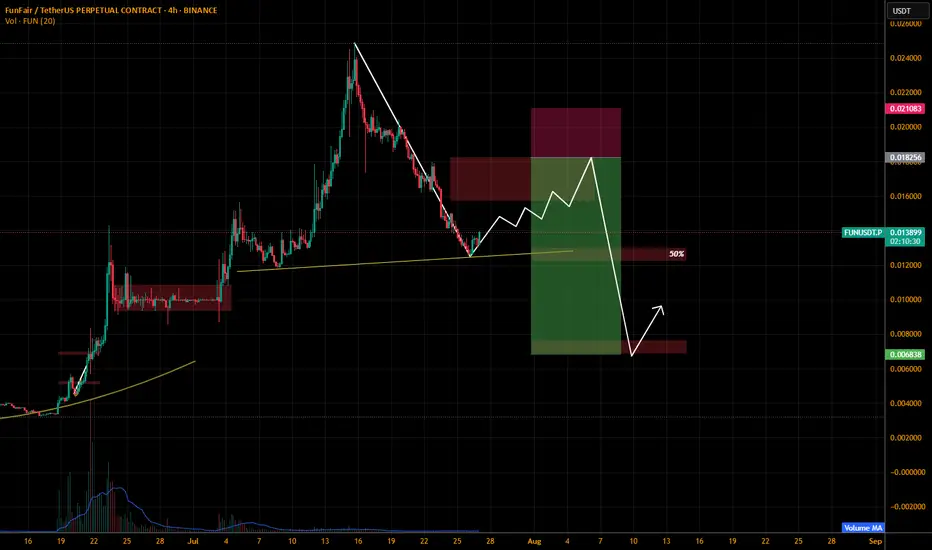
FUNUSDT.P ShortIm thinking the price should consolidate in a channel than give a fake move up and complete our right shoulder to reverse the price.
The setup has been marked only enter if we some strong bearish momentum.
DYOR
Follow me and help me grow will encourage me to post more of my analysis.
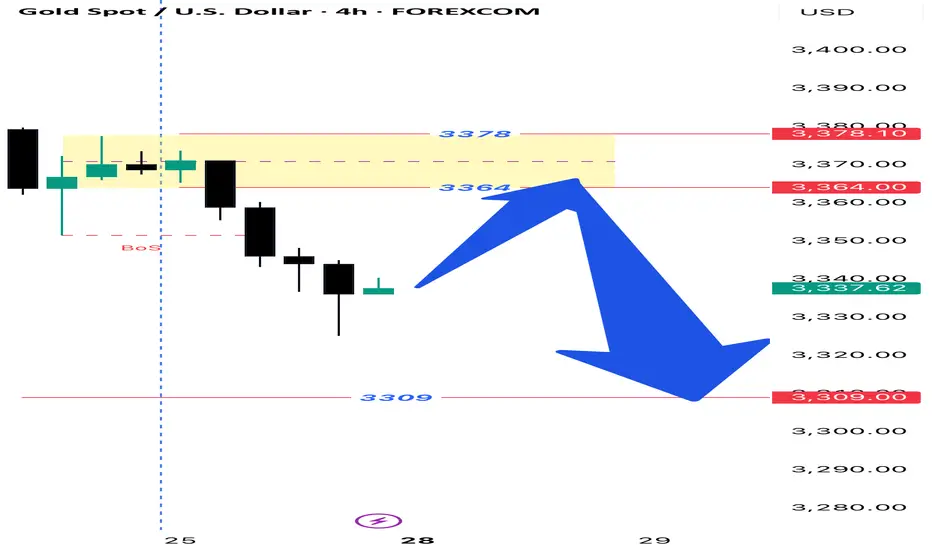
XAUUSD 4H SetupIn the new week, on the 4-hour timeframe, we expect gold to rise to the specified follow order range of 3364 to 3378, then fall and the price will reach 3309.
GOLD Ignites! Triangle Breakout Targets $3,760Gold has broken out of a multi-month symmetrical triangle on the daily chart, signaling a potential continuation of the broader bullish trend. The measured move targets the $3,760 zone, with risk managed below the recent support $3244. According to latest COT report money managers increased the net long positions, reflecting institutional confidence in gold's upside.

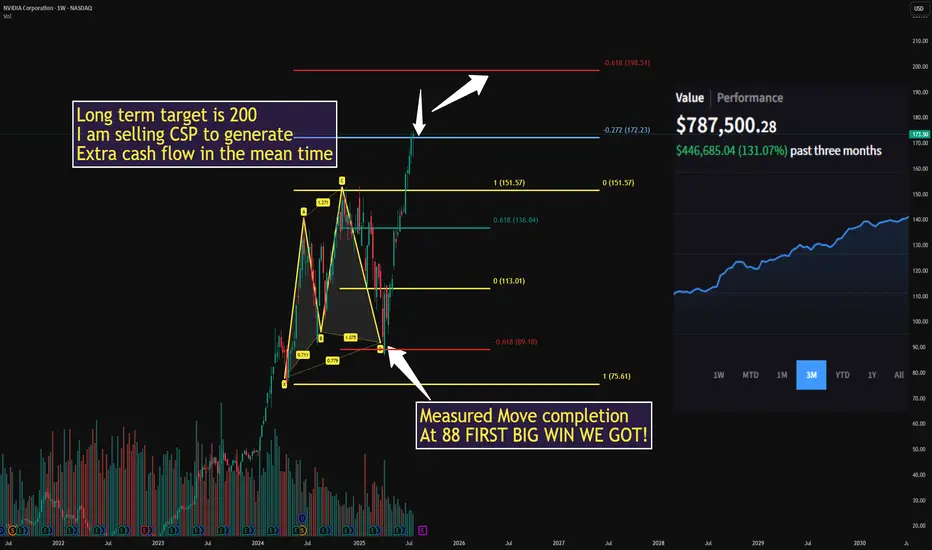
$NVDA ONCE IN A LIFETIME from 88 to 174 BOOM!WE crushed it using the 618 measured move from 88 to 174 in April
Next target is 200 and I am waiting for a decent pull back
In the mean time I will sell puts to generate cash flow, I will alert my next buy here
NO CHARGE all I ask is drop a LIKE
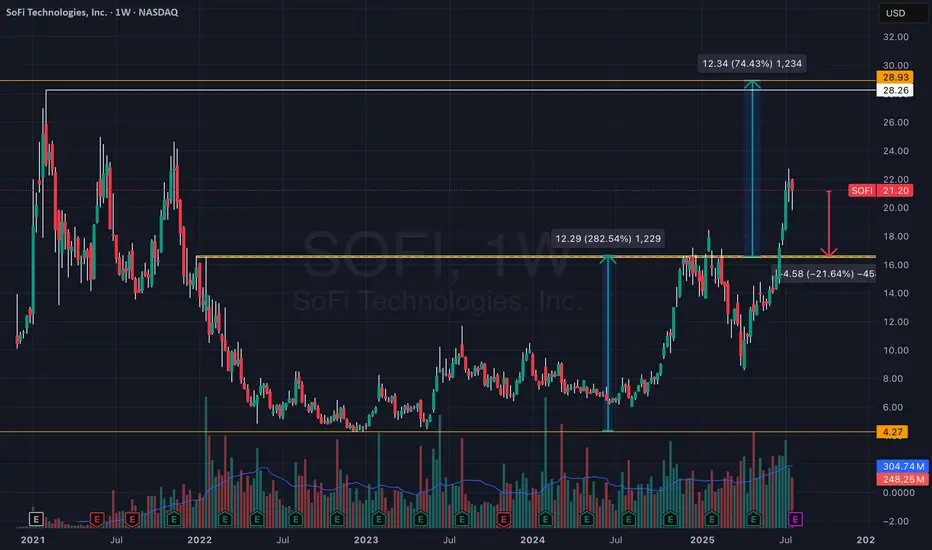
SoFi: On the Road to ATH ResistanceAfter clearing over 100 lines off my chart, I wanted to take a clean, fresh look at SoFi heading into the upcoming earnings report — just to gain a new perspective on where we stand.
Weekly chart. As simple as it gets.
What I’m seeing: a breakout from a classic cup-and-handle formation, with the breakout point around $16.5.
This setup carries potential for a move toward all-time highs near $28.
— Important note:
A pullback to the $16.5 zone would still not break the breakout structure — in fact, this would be a textbook retest of the breakout level.
Yes, there’s still room for a ~20% downside from current levels, but this would still be within the structure of a larger bullish move toward ATH.
No doubt in my mind — if we revisit $16.5, I’ll be loading up on SOFI like crazy.
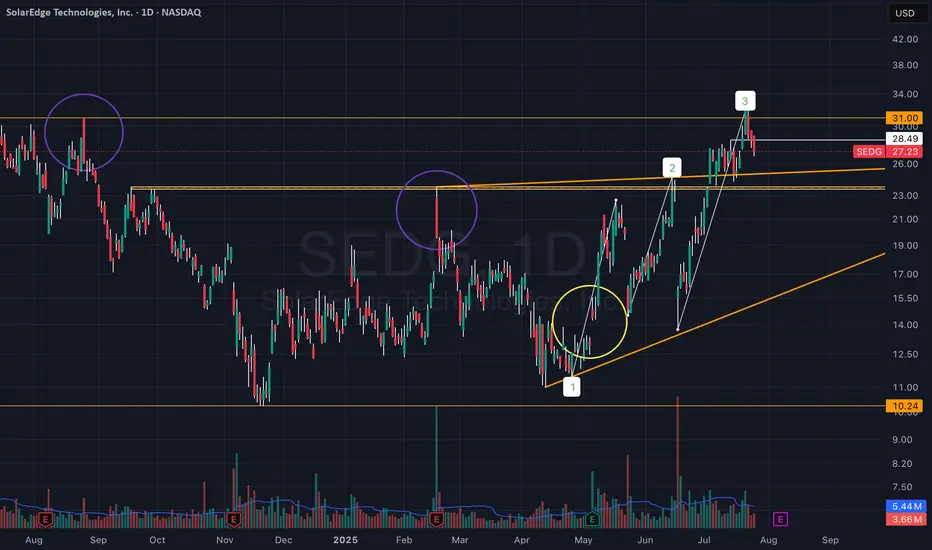
Are We Witnessing a Trend Reversal in SEDG?Something I’ve been watching closely these past few days — SEDG (SolarEdge):
There’s a setup unfolding that I think could benefit from a few more eyes on it:
• The two purple circles mark large vector candles that initiated sharp downward moves.
• The yellow circle highlights the quarterly earnings release, which triggered a strong upward move toward the $20–24 zone — the area of the first vector candle.
These vector candles reflect strong institutional activity that clearly impacted price movement.
A breakout above these zones could signal a meaningful trend reversal forming in the stock.
Price was rejected twice from this area with strong dips, but on the third attempt, it broke through, reaching the next vector candle zone around $26–31.
Now, price is approaching this upper zone with strong momentum following the breakout.
After reviewing the recent earnings report, I noticed a clear recovery and a significant upward revision in guidance, suggesting the company may be shifting direction.
Whether this holds is uncertain — but price action suggests the market is pricing in real change.
We recently printed a high of $32.45, above the $31 vector zone — a notable sign of strength.
At the moment, we appear to be pulling back into support, and structure remains intact.
Yes, there’s clearly a strong battle happening now — but I’m convinced the momentum is with the bulls.
It feels like someone already knows what’s coming in the next earnings release, or at least senses a shift in the company’s trajectory.
Everything seems to be building toward the next earnings report, expected early August.