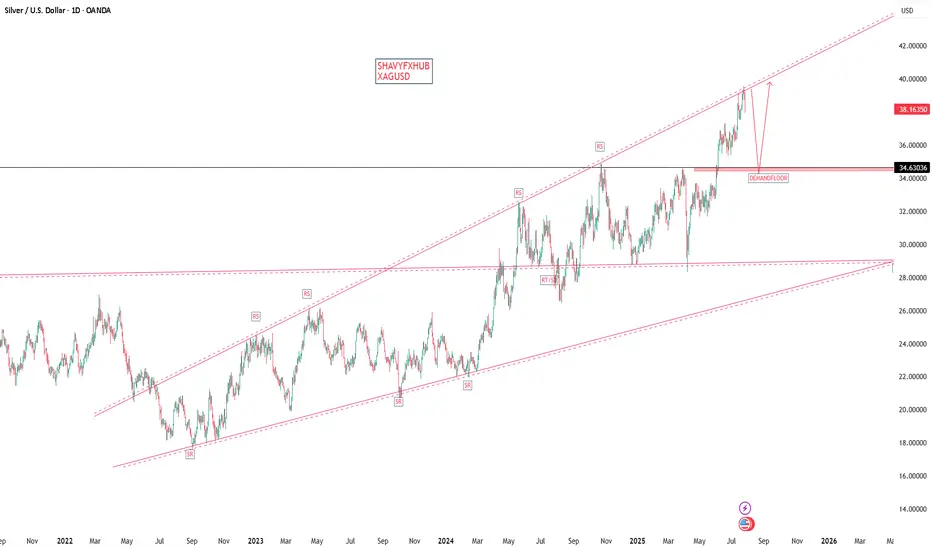
XAGUSD SILVER ON 3OTH we are expecting a strong fundamental data .
ADP Non-Farm Employment Change forecast 82K previous -33K
Advance GDP q/q forecast 2.4% previous -0.5% Advance GDP Price Index q/q forecast 2.3% previous 3.8%
Pending Home Sales m/m0.3% 1.8%
7:00pm
USD
Federal Funds Rate
4.50% 4.50%
USD
FOMC Statement
7:30pm
USD
FOMC Press Conference.
we will be watching the data outlook for clear directional bias.
Harmonic Patterns
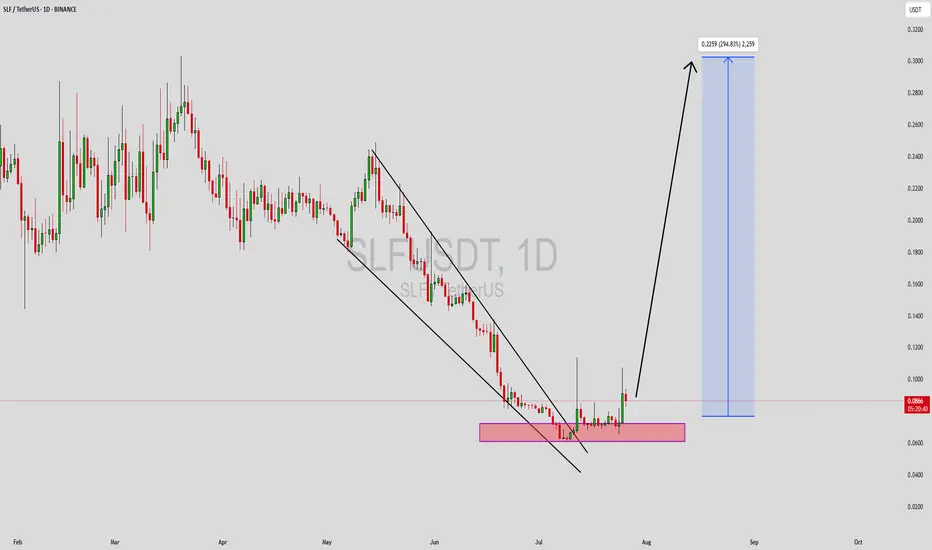
SLFUSDT Forming Falling WedgeSLFUSDT is currently exhibiting a classic falling wedge pattern, a bullish formation that typically signals a potential trend reversal. The narrowing of the wedge, combined with consistent price compression and higher lows, indicates that sellers are losing control while buyers begin to step in. This pattern often results in a strong breakout to the upside, and given the current structure, SLF is poised for a potential explosive move.
Volume levels remain healthy, which reinforces the likelihood of an impending breakout. Increased trading activity at support zones shows that investors are accumulating, anticipating a shift in momentum. Historically, falling wedges with strong volume confirmation have led to aggressive rallies, and in SLF’s case, analysts are expecting gains in the range of 190% to 200%+. This aligns well with both technical and psychological targets on the chart.
The market sentiment around SLFUSDT is turning increasingly positive as the project garners more attention in crypto communities. With on-chain metrics improving and social mentions growing, SLF is being recognized as a potential breakout play. If the price breaks out of the wedge and flips resistance into support, a sharp rally could follow—making it one of the high-reward setups currently in the altcoin market.
Traders should watch for a decisive breakout candle backed by rising volume, which could be the key confirmation to enter this trade. The structure is well-formed, investor interest is rising, and all technical indicators point toward an upcoming bullish move.
✅ Show your support by hitting the like button and
✅ Leaving a comment below! (What is You opinion about this Coin)
Your feedback and engagement keep me inspired to share more insightful market analysis with you!
SILVER XAGUSD ON 3OTH we are expecting a strong fundamental data .
ADP Non-Farm Employment Change forecast 82K previous -33K
Advance GDP q/q forecast 2.4% previous -0.5% Advance GDP Price Index q/q forecast 2.3% previous 3.8%
Pending Home Sales m/m0.3% 1.8%
7:00pm
USD
Federal Funds Rate
4.50% 4.50%
USD
FOMC Statement
7:30pm
USD
FOMC Press Conference.
we will be watching the data outlook for clear directional bias.

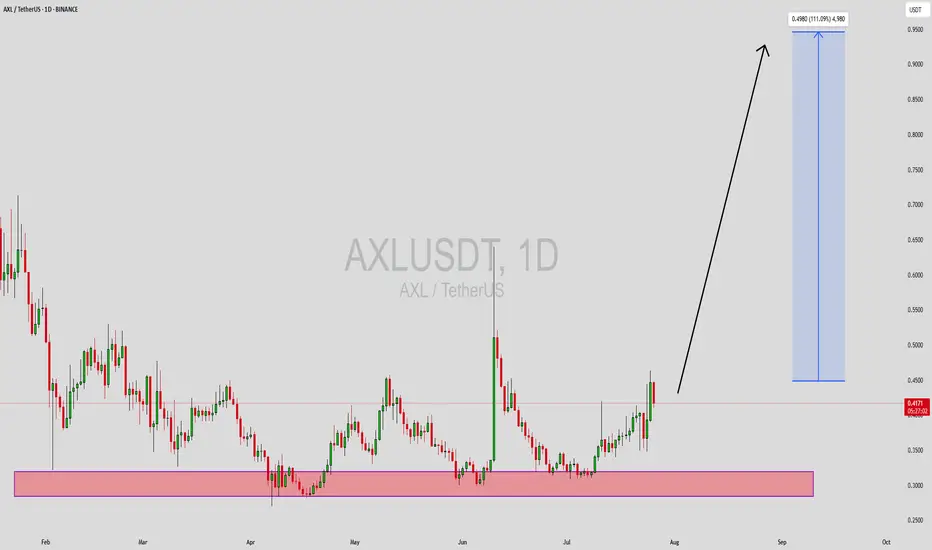
AXLUSDT Forming Bullish ReversalAXLUSDT is showing clear signs of a bullish reversal pattern on the daily timeframe, indicating a potential shift in market sentiment from bearish to bullish. This pattern is typically characterized by a slowing of downward momentum followed by a breakout to the upside, and AXL is currently forming higher lows—often the early signal of a trend reversal. The current price action suggests accumulation, and with increasing volume behind the recent moves, we may be on the verge of a significant breakout.
This technical setup is further strengthened by improved market structure and growing interest from traders and investors alike. The volume profile shows increasing participation at current levels, a strong indication that smart money could be stepping in. With bullish momentum building and the price reclaiming key support zones, the technical target points toward a 90% to 100% upside potential in the coming weeks.
AXL has been under the radar, but that may not last much longer. The project fundamentals are solid, and with market participants beginning to recognize the recovery potential, a trend shift seems imminent. As more traders start to identify this bullish reversal, we could see a rapid increase in price, especially if it breaks above resistance with strength.
Traders should keep a close eye on volume confirmation and price behavior around key levels to catch the breakout early. If momentum continues to build and resistance is flipped into support, AXLUSDT could deliver one of the stronger moves in the mid-cap altcoin space this quarter.
✅ Show your support by hitting the like button and
✅ Leaving a comment below! (What is You opinion about this Coin)
Your feedback and engagement keep me inspired to share more insightful market analysis with you!
Market shows signs of indecisionThe market is in a state of indecision, and no indicator or oscillator can help determine the next move — none of them are useful right now.
The market is waiting to make a decision, and so are we.
We need to stay patient and see which direction it chooses.
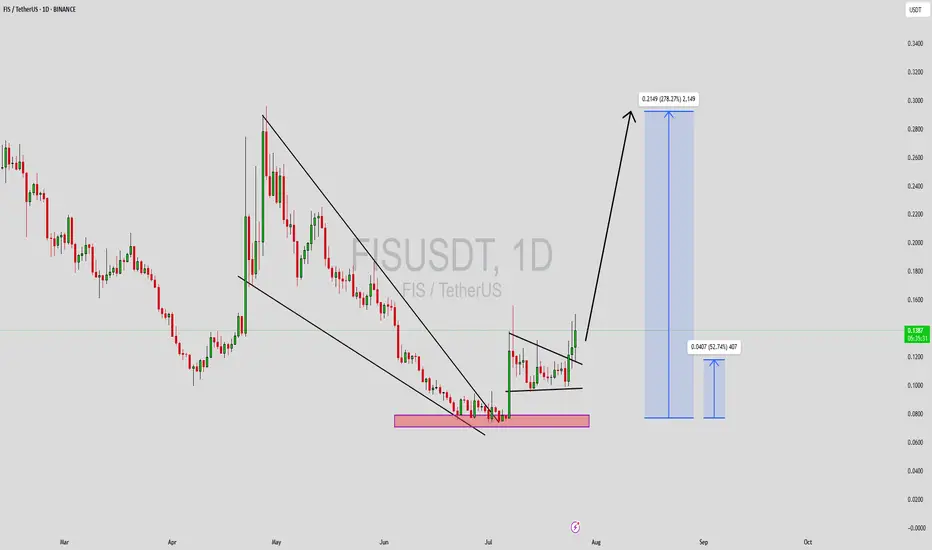
FISUSDT Forming Falling WedgeFISUSDT is forming a textbook falling wedge pattern on the daily timeframe, a well-known bullish reversal signal that often precedes explosive upside breakouts. After an extended corrective phase marked by declining price and compressed volatility, the asset appears to be nearing a breakout zone. The narrowing structure of the wedge, paired with a gradual increase in volume, is a promising setup that signals growing buyer accumulation and a potential shift in market sentiment.
The falling wedge is one of the most reliable bullish continuation and reversal patterns in technical analysis, especially when backed by solid volume, as we’re now observing with FISUSDT. Once the price decisively breaks above the wedge’s resistance line, momentum could accelerate rapidly, triggering a sharp move to the upside. Based on current market conditions and historical price behavior, a target of 240%–250% gain is not out of the question as FIS reclaims previous support levels turned resistance.
Increased investor interest in this project is another key factor to monitor. Social metrics and on-chain activity suggest renewed enthusiasm in the ecosystem, which often precedes strong price performance. Coupled with favorable technicals and a bullish overall structure, FISUSDT offers a compelling opportunity for traders and long-term investors looking for high-risk, high-reward setups.
As always, patience is crucial when trading patterns like the falling wedge. But with technicals aligning and volume confirming accumulation, FISUSDT may soon begin its breakout phase and enter a powerful uptrend.
✅ Show your support by hitting the like button and
✅ Leaving a comment below! (What is You opinion about this Coin)
Your feedback and engagement keep me inspired to share more insightful market analysis with you!
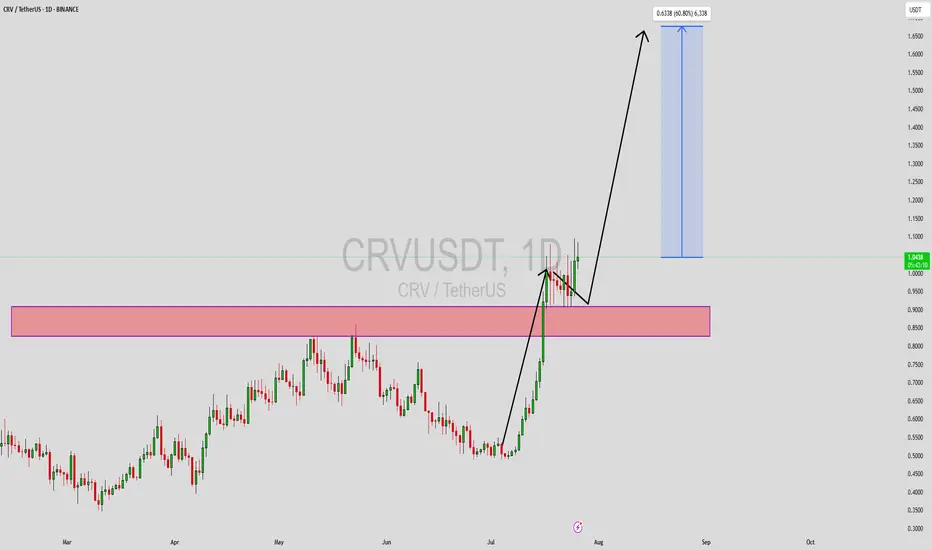
CRVUSDT Forming Bullish ReversalCRVUSDT is currently exhibiting a strong bullish reversal pattern on the daily chart, signaling the potential beginning of a new uptrend. After a prolonged downtrend, the price action has begun to stabilize and show signs of accumulation, with a noticeable uptick in volume accompanying the recent bullish candles. This confluence of technical factors suggests that buyers are beginning to step in with confidence, possibly positioning for a breakout that could yield significant returns.
The chart structure points to a clear bottoming pattern, which often precedes sustained upside movement. CRVUSDT has shown resilience by holding above key support zones and now appears to be reversing with higher lows and increased buying pressure. With overall market sentiment slowly improving, CRV is well-positioned to capitalize on a broader altcoin recovery. A confirmed breakout from this formation could realistically set the stage for a 50%–60% price increase in the coming weeks.
Volume is a key confirmation here—its steady growth reinforces the bullish thesis and indicates strong participation from investors. As more market participants recognize the reversal structure, CRVUSDT could quickly gain momentum. The coin is also historically known for volatile upside swings, and once trend confirmation occurs, it tends to rally with strength and speed. This makes it a compelling asset for swing traders and medium-term investors looking for asymmetric setups.
With growing interest and a strong technical base forming, CRVUSDT could soon enter a high-momentum phase. Keep an eye on breakout levels and monitor volume for continuation signals as this bullish reversal plays out.
✅ Show your support by hitting the like button and
✅ Leaving a comment below! (What is You opinion about this Coin)
Your feedback and engagement keep me inspired to share more insightful market analysis with you!
Breakout or pullback?Update on the previous analysis:
We had anticipated a pullback due to the lower high, and that view remains unchanged — unless buying volume increases and we manage to break through the resistance.
Very low volumeLow volume before momentum — something’s cooking. Let’s see if it breaks up or down. 🔍📉📈
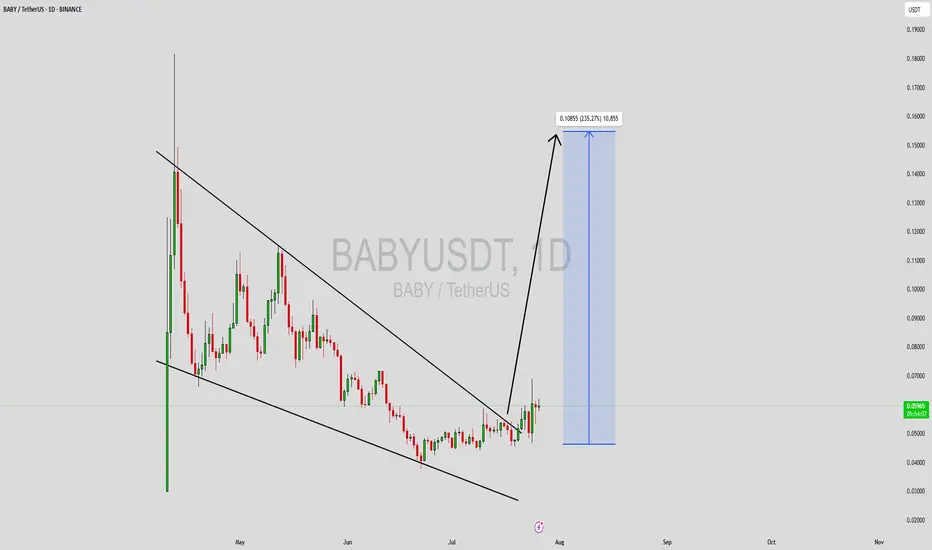
BABYUSDT Forming Falling WedgeBABYUSDT is currently forming a classic falling wedge pattern on the daily chart—one of the most reliable bullish reversal signals in technical analysis. The wedge has matured over time, and price is now attempting a breakout from the descending resistance trendline. With volume steadily increasing during this breakout attempt, the probability of a strong bullish continuation has significantly improved. This could open the door for a substantial price surge in the near term.
The falling wedge pattern often signifies a slowdown in selling pressure and a potential shift in market sentiment. Combined with rising investor interest, this setup becomes even more compelling. BABYUSDT is now showing signs of strength with a tightening range and breakout momentum, which could fuel an explosive move targeting 190%–200% gains. These kinds of parabolic moves are often seen in early stages of altcoin rallies—especially when retail and institutional interest begin to align.
A breakout with sustained volume above the wedge resistance could confirm the bullish thesis, especially if the price holds above the breakout zone during any retest. The risk-to-reward ratio in such setups is often favorable, making it an attractive opportunity for trend-following traders and early momentum seekers. Moreover, the broader sentiment in the market is turning more favorable for low-cap altcoins, which adds further confidence to this setup.
As BABYUSDT garners more attention, it may soon break into a strong uptrend fueled by both technical strength and growing market hype. Keeping a close eye on key resistance levels and volume confirmations will be crucial for validating this potential rally.
✅ Show your support by hitting the like button and
✅ Leaving a comment below! (What is You opinion about this Coin)
Your feedback and engagement keep me inspired to share more insightful market analysis with you!
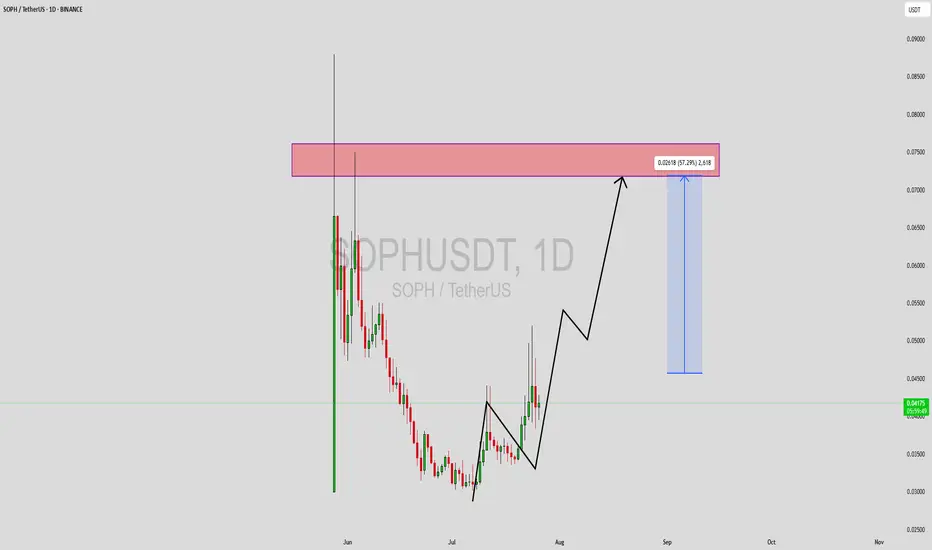
SOPHUSDT Forming Bullish ReversalSOPHUSDT is currently displaying a bullish reversal structure on the daily chart, forming a classic staircase pattern with higher highs and higher lows. After a prolonged downtrend, the asset appears to have found a strong accumulation base, and recent price action is now showing momentum building toward a breakout move. The chart suggests a 50%+ potential upside move from the current levels, targeting the major resistance zone around $0.07–$0.075, which is a previously tested supply zone.
Volume confirmation is key here—the recent increase in volume alongside green bullish candles indicates growing investor interest and possible early accumulation from smart money. This is typically a strong signal for upcoming continuation in price movement. With solid support now established below and momentum pushing upward, traders may find a favorable reward-to-risk setup here.
This move is further supported by positive sentiment building across the crypto space for SOPH, with many traders beginning to take notice. The expected gain zone reflects realistic mid-term targets and aligns with previous resistance levels. A clean breakout and retest above $0.045 would further confirm bullish dominance and open doors for rapid price appreciation in the coming weeks.
The overall setup on SOPHUSDT is technically sound, with good volume, bullish structure, and an appealing price action flow. For traders scanning the market for high-potential altcoins, this could be one to watch closely.
✅ Show your support by hitting the like button and
✅ Leaving a comment below! (What is You opinion about this Coin)
Your feedback and engagement keep me inspired to share more insightful market analysis with you!
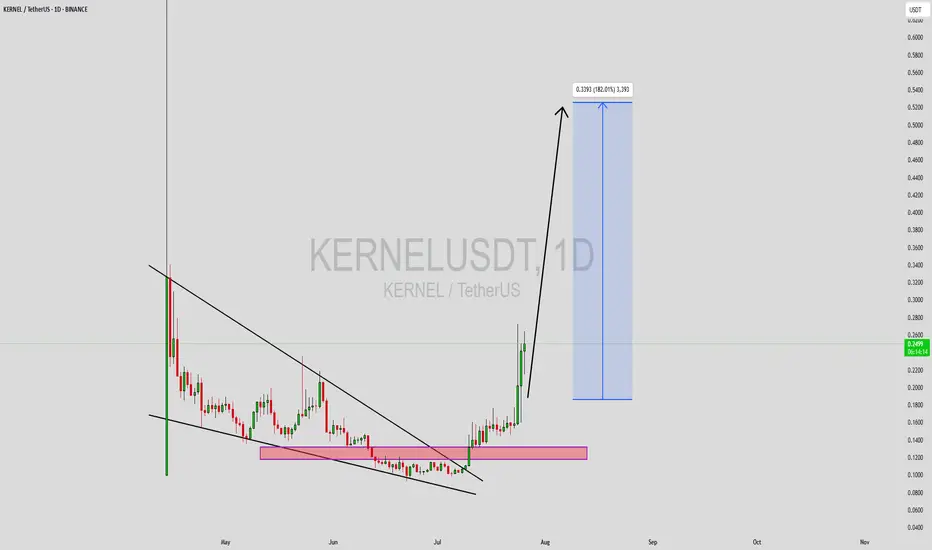
KERNELUSDT Forming Falling WedgeKERNELUSDT has recently completed a significant technical breakout from a well-defined falling wedge pattern, which is known in crypto trading for its strong bullish implications. The asset had been consolidating within this wedge for weeks, forming a base in the demand zone highlighted in the pink region on the chart. Now, after gaining enough strength and momentum, it has broken through resistance with solid bullish candles, signaling the start of a potential parabolic move.
Volume confirmation during the breakout phase is notable—indicating real buying interest rather than a false breakout. Based on this breakout and the current momentum, the expected gain is projected between 170% to 180%+, and the measured move target points toward the $0.33–$0.34 region. KERNELUSDT’s price action has shifted from accumulation to expansion, often the most profitable phase for trend traders. With higher highs and higher lows starting to form, bulls are in clear control.
In addition to the technical pattern, KERNEL appears to be attracting attention from investors, potentially due to its tokenomics, project fundamentals, or upcoming developments. Traders looking for high-reward opportunities with favorable entry points may find this setup ideal, particularly with the recent retest of the breakout zone acting as confirmation. If momentum continues, this rally could easily extend beyond the projected zone.
This is a textbook example of a reversal structure evolving into an explosive breakout. KERNELUSDT is now trending upward strongly, and staying updated on volume surges and any pullbacks to the breakout zone can help traders ride the wave efficiently. The crypto market rewards breakout traders when strong technicals align with market sentiment—and this is one of those moments.
✅ Show your support by hitting the like button and
✅ Leaving a comment below! (What is You opinion about this Coin)
Your feedback and engagement keep me inspired to share more insightful market with you!
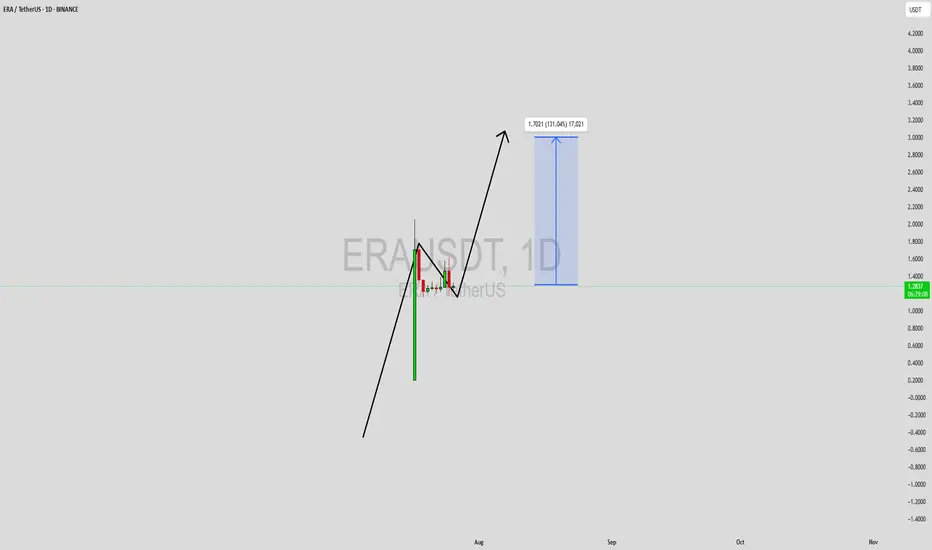
ERAUSDT Forming Bullish FlagERAUSDT has caught the attention of traders after a strong impulsive move that has laid the foundation for a possible continuation of its bullish trend. The current structure appears to be forming a classic bullish flag/pennant formation, a pattern often observed in strong uptrends, where price consolidates in a narrow range before breaking out higher. With volume supporting the recent breakout and price action showing resilience near consolidation support, this setup presents an exciting upside potential.
The projected gain of 90% to 100%+ aligns well with the technical structure seen on the chart, especially considering the momentum-driven environment ERAUSDT is trading in. As price continues to coil within a tight range, it builds the energy necessary for a decisive breakout. The bullish sentiment surrounding the ERA ecosystem, coupled with increasing interest from speculative and long-term investors, could be the fuel needed to push this pair into a significant rally.
Fundamentally, ERA is beginning to draw more eyes from across the crypto community, possibly due to developments or partnerships that are elevating its profile. This blend of technical readiness and rising investor interest makes it a coin to watch in the short to mid-term. If bullish confirmation holds, the next leg could be sharp and aggressive, potentially achieving or even exceeding the projected 100% target.
This is a moment where traders who rely on high-reward momentum setups could benefit by monitoring this pair closely. With risk well-defined below recent lows and the structure signaling strength, ERAUSDT deserves a spot on every active trader's radar.
✅ Show your support by hitting the like button and
✅ Leaving a comment below! (What is You opinion about this Coin)
Your feedback and engagement keep me inspired to share more insightful market analysis with you!
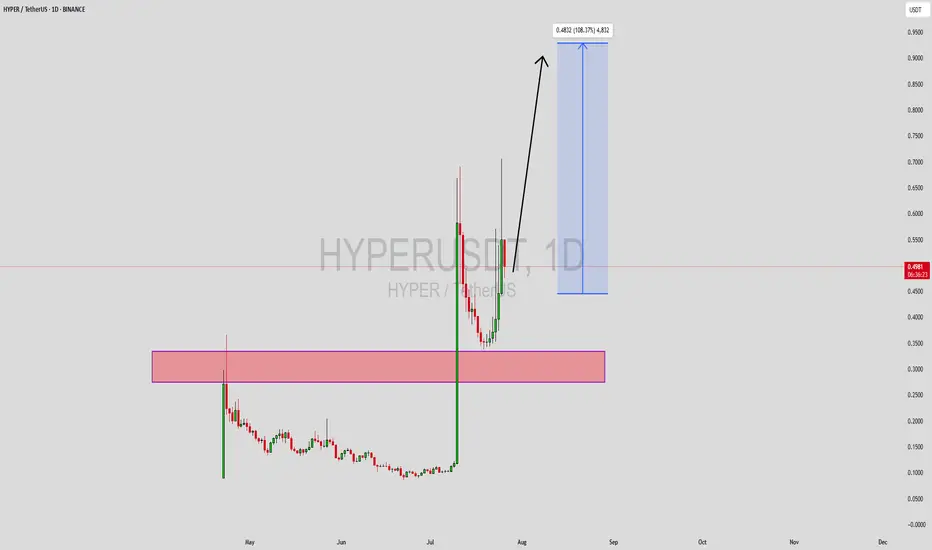
HYPERUSDT Forming Bullish WaveHYPERUSDT is currently showcasing a bullish wave pattern, a strong technical formation that often signals the continuation of an upward move after a healthy correction or consolidation. This wave structure suggests that bulls are regaining control, creating the potential for a significant price expansion. With volume remaining solid and consistent, this aligns well with the expected upside breakout, making this a promising setup. Analysts and short-term traders alike are eyeing a 90% to 100%+ gain from the current levels based on wave projection.
The growing interest around the HYPER project adds a layer of fundamental strength to the technical setup. With active community engagement and strategic development updates, HYPERUSDT has been catching investor attention across crypto forums and social media platforms. This increasing visibility could further drive price action, especially if market conditions remain favorable for altcoin momentum.
Looking at historical price movements, HYPERUSDT has shown the capacity for sharp, impulsive waves followed by periods of consolidation—characteristics of a trending asset. If the current bullish wave completes its projected move, it could push the price back into a previous resistance zone or even break into price discovery, depending on broader market sentiment.
Given the technical pattern confirmation and rising investor interest, HYPERUSDT is shaping up to be a strong short-to-mid-term play. Traders looking for volatility and high-reward setups may want to keep this pair on their active watchlist.
✅ Show your support by hitting the like button and
✅ Leaving a comment below! (What is You opinion about this Coin)
Your feedback and engagement keep me inspired to share more insightful market analysis with you!
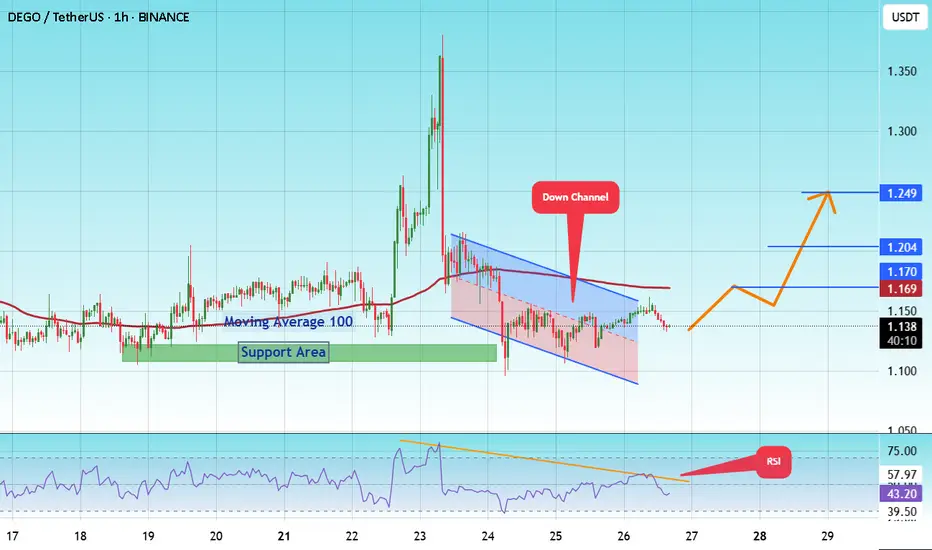
#DEGO/USDT Forming Bullish Wave#DEGO
The price is moving within a descending channel on the 1-hour frame and is expected to break and continue upward.
We have a trend to stabilize above the 100 moving average once again.
We have a downtrend on the RSI indicator that supports the upward break.
We have a support area at the lower boundary of the channel at 1.10, acting as strong support from which the price can rebound.
We have a major support area in green that pushed the price higher at 1.10.
Entry price: 1.13
First target: 1.17
Second target: 1.20
Third target: 1.25
To manage risk, don't forget stop loss and capital management.
When you reach the first target, save some profits and then change the stop order to an entry order.
For inquiries, please comment.
Thank you.
THE SANDBOX mid - to long - termThis might seem obvious to some, but it’s worth emphasizing —
📌 When analyzing charts like this, switch to a Line Chart instead of Candlesticks.
Why?
It filters out market noise and shake-outs
You can clearly see how price respects key zones and levels
Candles often distort the picture with wicks — line charts show the real body movement
Bullish Setup:
Market has printed a clean W-bottom, confirming bullish intent.
We are currently retesting the neckline of the pattern — a common and healthy move before continuation.
A successful retest could lead to an impulsive move upward toward target zones.
🎯 Target Zones:
Green zone (top) — this is the maximum target in the current structure.
Anything above the red line already carries increased risk, and should be approached with caution.
Above green zone = extreme risk / high-probability rejection unless backed by strong fundamentals.

#KDA/USDT Stay Adaptive ?#KDA
The price is moving within a descending channel on the 1-hour frame, adhering well to it, and is on its way to breaking it strongly upwards and retesting it.
We have a bounce from the lower boundary of the descending channel. This support is at 0.4260.
We have a downtrend on the RSI indicator that is about to be broken and retested, supporting the upside.
There is a major support area in green at 0.4186, which represents a strong basis for the upside.
Don't forget a simple thing: ease and capital.
When you reach the first target, save some money and then change your stop-loss order to an entry order.
For inquiries, please leave a comment.
We have a trend to hold above the 100 Moving Average.
Entry price: 0.4530
First target: 0.4625
Second target: 0.4754
Third target: 0.4932
Don't forget a simple thing: ease and capital.
When you reach the first target, save some money and then change your stop-loss order to an entry order.
For inquiries, please leave a comment.
Thank you.

Bitcoin’s Battle at Resistance Watch These Critical Levels.Bitcoin is currently forming an AMD (Accumulation–Manipulation–Distribution) pattern.
The market recently dipped due to manipulation, only to push back up and break through a key resistance level, moving toward the inversion zone. However, it now faces additional resistance from a descending trendline.
If the market decisively breaks above this trendline and successfully retests it, there is potential for further upward movement.
Keep a close watch on these critical levels for confirmation.
Do Your Own Research (DYOR)

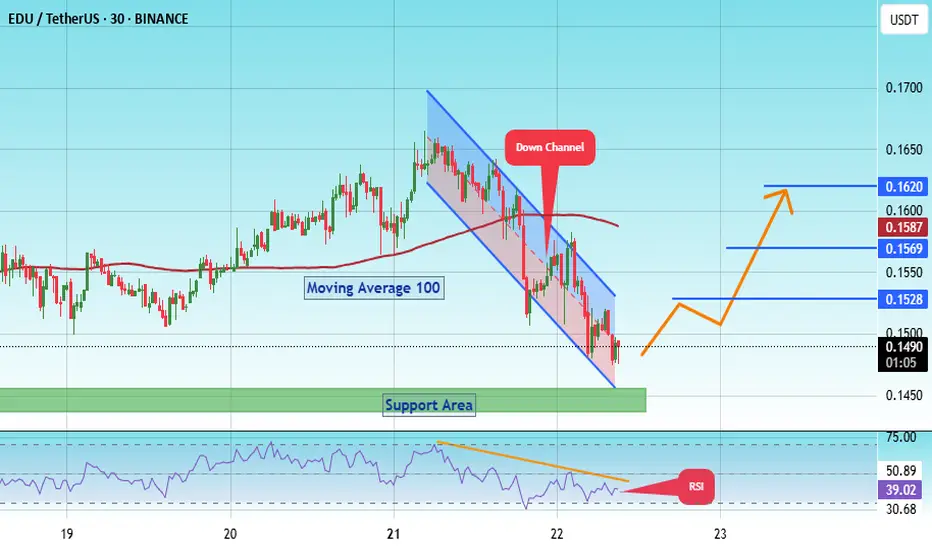
#EDU/USDT#EDU
The price is moving within a descending channel on the 1-hour frame, adhering well to it, and is on its way to breaking strongly upwards and retesting it.
We have support from the lower boundary of the descending channel, at 0.1464.
We have a downtrend on the RSI indicator that is about to be broken and retested, supporting the upside.
There is a major support area in green at 0.1442, which represents a strong basis for the upside.
Don't forget a simple thing: ease and capital.
When you reach the first target, save some money and then change your stop-loss order to an entry order.
For inquiries, please leave a comment.
We have a trend to hold above the 100 Moving Average.
Entry price: 0.1487
First target: 0.1528
Second target: 0.1570
Third target: 0.1620
Don't forget a simple thing: ease and capital.
When you reach your first target, save some money and then change your stop-loss order to an entry order.
For inquiries, please leave a comment.
Thank you.
#APE/USDT Low Risk vs High Rewards#APE
The price is moving within a descending channel on the 1-hour frame and is expected to break and continue upward.
We have a trend to stabilize above the 100 moving average once again.
We have a downtrend on the RSI indicator that supports the upward break.
We have a support area at the lower limit of the channel at 0.6080, acting as strong support from which the price can rebound.
We have a major support area in green that pushed the price upward at 0.6180.
Entry price: 0.6300
First target: 0.6633
Second target: 0.6986
Third target: 0.7380
To manage risk, don't forget stop loss and capital management.
When you reach the first target, save some profits and then change your stop order to an entry order.
For inquiries, please comment.
Thank you.

