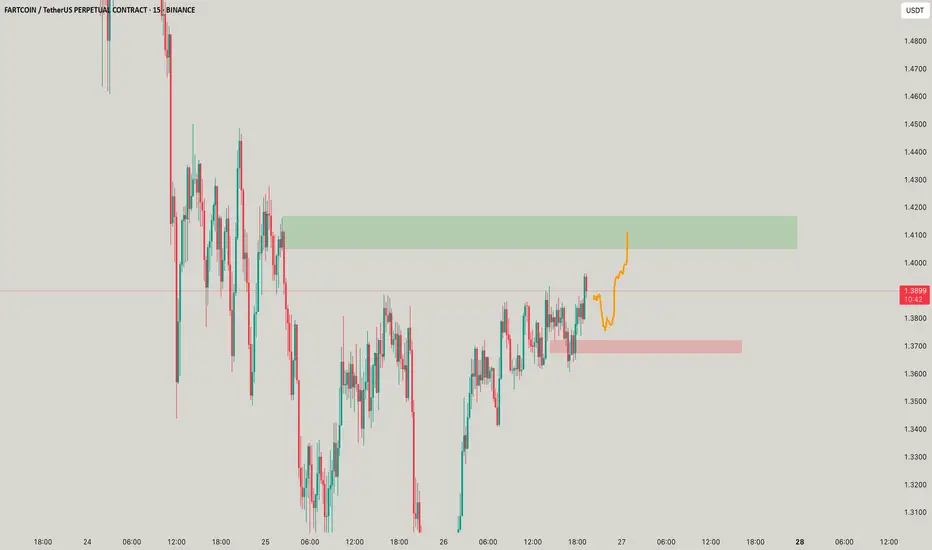
Eat Fibre and FART moreSo yes fiber food makes you fart this is virtual fart you just need to eat at the right time and blow the gas at the green momentum, ya understand sirr?
Harmonic Patterns
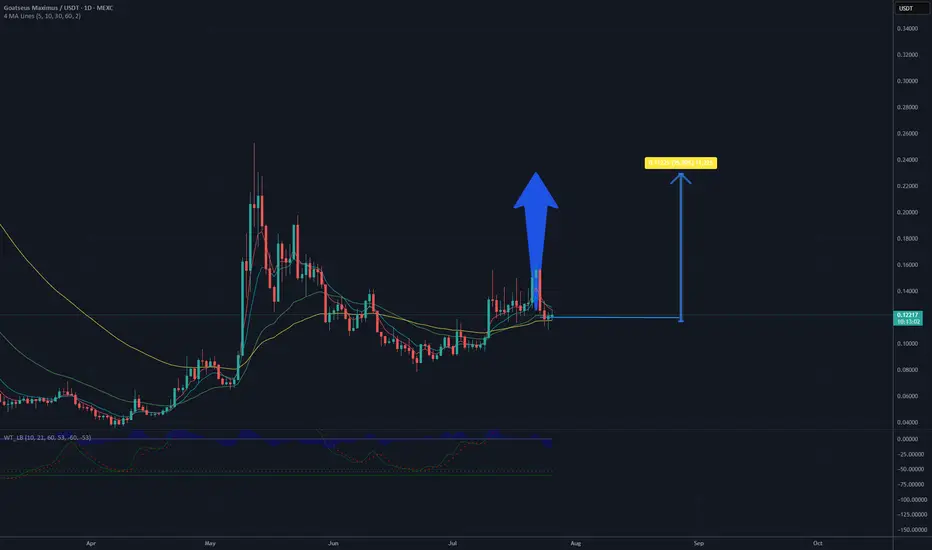
IS it a time for GOATUSDT? 100% potential profit TP - 0.24 $After an extended downtrend, the 4-hour chart of Goatseus Maximus (GMAX) / USDT is showing signs of stabilization and a potential trend reversal. The price has found support in the $0.11–$0.12 range, where accumulation appears to be taking place — characterized by higher lows and an early structure of upward movement.
The WaveTrend (WT_LB) indicator is currently in the oversold zone and beginning to turn upward. This behavior often suggests that selling pressure is weakening and the market may be preparing for a bullish move. A green cross on this indicator can be interpreted as an early buy signal.
Additionally, the moving averages (MA 10, 30, 60, and 120) are starting to flatten out, indicating a potential transition out of the previous downtrend. If the price can break and hold above these averages, it may trigger increased buying interest and momentum.
From a technical standpoint, the $0.14 level remains a key short-term resistance. A successful breakout above this level could open the way for a move toward $0.18, followed by a potential run-up to $0.24, which previously acted as a significant resistance zone and rejection point.
In summary, the current technical setup suggests that if bullish momentum continues and key resistance levels are broken, a move toward $0.24 is achievable in the mid-term.
Potential TP: 0.24 USD
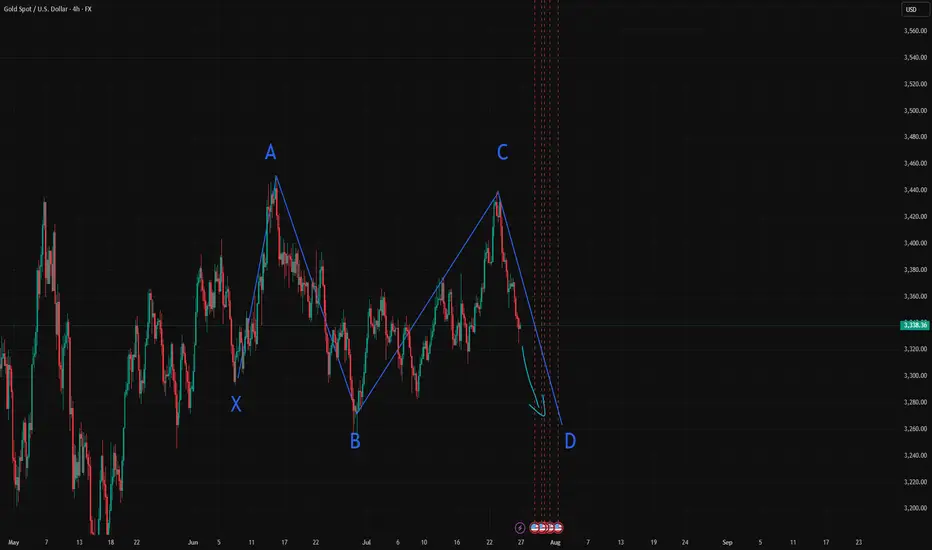
GOLD gartely , XAUUSD ShortLooks like a perfect gartely pattern here on 4h frame , gold might go bearish to 3260
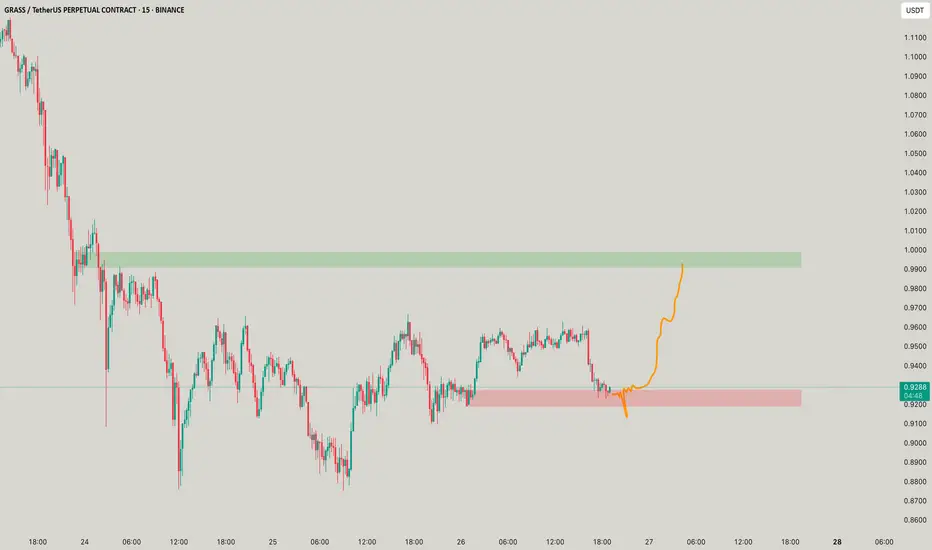
Are you cow to eat GRASS?GRASSUSDT looks a perfect trade, too perfect to be true! Just wait for the right buys!
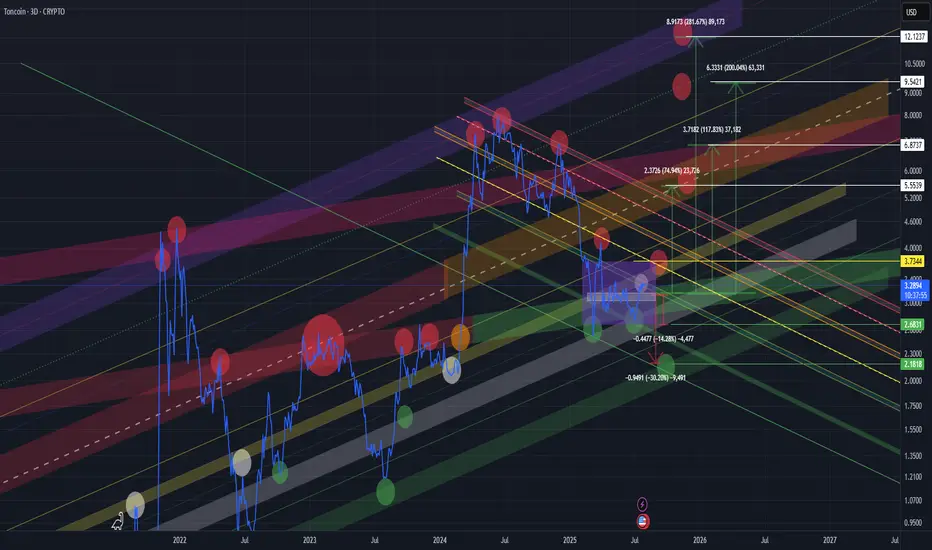
TONUSD TONUSDT TONCOIN mid- to long-termIn my view, we are still in the accumulation phase. The current price action and reactions at key levels suggest ongoing accumulation.
🔻 Bearish Scenarios:
In the short term, a retest of the lower boundary of the accumulation zone (purple box) is possible if the market weakens.
The worst-case scenario would be a move down to the lower green support zone, which has historically triggered strong bullish reactions. This is a critical demand area.
🔼 Bullish Scenarios:
A confirmed breakout and hold above the white line (within the purple box) would signal strength and a potential move higher.
We would then likely see a retest of the upper boundary of the accumulation zone.
A breakout and consolidation above the yellow line would open the door for a move toward the wider yellow channel, which could act as a final target zone
🚨 High-Risk Zone:
The yellow channel might represent the final phase of the current move.
From there, we could see either a sharp correction
Or, if trend strength and macro conditions allow, a continuation towards a new ATH (purple line).
📌 📌 📌 :
All marked lines and zones represent key support and resistance levels.
Price reaction at these areas will be crucial for decision-making.
As always, risk management and trend confirmation are essential.
Bearish Outlook for BTCUSDOn the 4-hour timeframe, Bitcoin seems to be starting a corrective phase, likely moving toward the $110 mark. Current price action is facing resistance at a descending trendline, aligned with the 78.6% Fibonacci retracement level, which should limit any short-term upward moves. The price is also trading below the 50-period SMA, with a strong bearish candle from a few sessions back supporting the downward trend.
For a bullish outlook to take hold, Bitcoin would need to decisively break above the 78.6% Fibonacci level with a robust bullish candle closing above the 50 SMA. Until that happens, I remain bearish, with a target of $110.
This technical perspective aligns with the scenario where the Federal Reserve opts to maintain interest rates at 4.50% at this Wednesday's FOMC meeting
Stay cautious and trade wisely!

SOFI EARNINGSResistance Zone: $22.50 – $24.00
Support Zone 1: $18.00 – $19.50
Support Zone 2 / EPS Breakout Line: $14.50
Bullish Target: $25.00
Trendline: Still intact — medium-term trend remains bullish

Tron Sets Nasdaq Debut After SRM Merger as TRX Overtakes ADATron Inc., the company behind the Tron blockchain and its native TRX token, is preparing for a landmark public listing on the Nasdaq, following its surprise merger with decentralized finance protocol Serum (SRM). The announcement sent shockwaves through the market, immediately catapulting TRX ahead of ADA to become the ninth-largest cryptocurrency by market capitalization.
The newly combined entity, operating under the name Tron Integrated Technologies, has filed its Form S-1 with the SEC, and aims to go public in Q4 2025—marking one of the first blockchain-native firms to emerge from a DeFi merger and enter public markets.
A Strategic DeFi Alliance
The deal with Serum is not just symbolic. It gives Tron deep liquidity infrastructure and decentralized exchange capabilities via Serum’s smart order routing and Solana-based engine. While the Solana connection raised eyebrows, Tron confirmed that a multi-chain expansion plan is in motion, with bridges being built across Ethereum, Solana, and BNB Chain.
“The merger with SRM accelerates our roadmap by three years,” said Tron CEO Marcus Lee. “This IPO isn’t just about capital—it's about positioning TRX as the digital fuel of a multi-chain financial internet.”
TRX Surges Amid Strategic Narrative
Following the merger news, TRX surged 22% over a five-day period, pushing its market cap to over $15.6 billion, surpassing Cardano (ADA) for the first time in over 18 months. Trading volume on centralized and decentralized exchanges spiked by over 60%, fueled by both retail speculation and whale accumulation.
According to data from Glassnode, over 84% of TRX supply is now held in long-term wallets, indicating a strong conviction among holders that the Nasdaq debut could further institutionalize the token.
Regulatory Spotlight and Market Implications
Tron’s Nasdaq listing is likely to put the project under closer regulatory scrutiny, especially given its ties to Asia-based user flows and complex tokenomics. However, sources within the SEC noted that the hybrid model—combining open-source protocol governance with a publicly traded corporate entity—could set a new precedent.
“This may be the template for the next generation of compliant crypto firms,” said Leah Thomason, regulatory analyst at Beacon Partners. “It’s essentially DeFi meets Wall Street.”
Conclusion
With the Nasdaq listing on the horizon, an ecosystem-level merger with SRM, and a strategic push toward interoperability, Tron is rewriting the playbook for token-backed companies. TRX’s leap into the top 10 is more than just a chart movement—it signals that capital markets may finally be ready for integrated blockchain operators.
Is This the Ultimate Bullish Signal for BTC and XRP?In a market often driven by hype and volatility, identifying true bullish signals for digital assets like Bitcoin (BTC) and XRP can be elusive. Yet, a growing convergence of macro, regulatory, and structural market factors may now point to one of the strongest combined bullish setups for these two digital assets in recent memory.
While BTC and XRP differ significantly in purpose and infrastructure—Bitcoin as a decentralized store of value, and XRP as a bridge asset for institutional cross-border payments—they may be aligning in a way that reflects maturing investor confidence and long-term viability.
Institutional Flows Accelerate
Perhaps the clearest bullish indicator lies in the surge of institutional capital into regulated crypto products. Bitcoin ETFs have seen a resurgence in net inflows, surpassing $2.5 billion over the past 30 days, with increased allocations from pension funds and sovereign wealth managers.
At the same time, XRP’s recent regulatory clarity—following the 2023 U.S. court decision stating that XRP is not a security when traded on public exchanges—has prompted renewed interest from financial institutions exploring cross-border payment solutions.
“Regulatory clarity is acting like a springboard for XRP,” said Claire Donovan, Senior Markets Strategist at Atlantic Ridge Digital. “Meanwhile, Bitcoin’s macro narrative—scarcity in an inflationary world—continues to resonate.”
On-Chain Signals Strengthen
On-chain metrics reinforce the optimism. Bitcoin’s hash rate has reached an all-time high, a sign of miner confidence and long-term network security. Simultaneously, the percentage of BTC supply held by long-term holders (LTH) is now above 70%, suggesting strong conviction.
For XRP, active wallet growth and ODL (On-Demand Liquidity) transaction volumes have jumped significantly over the past quarter. According to data from Ripple, ODL volumes grew by 61% quarter-over-quarter—primarily driven by demand from Asia-Pacific and Latin American corridors.
“ODL is no longer experimental—it’s mission-critical infrastructure,” said Donovan. “The market is beginning to reflect that.”
Cross-Market Momentum and Retail Resurgence
Another potentially bullish alignment is emerging from the return of retail sentiment, driven by social media engagement, higher search volumes, and renewed interest in altcoins. XRP has reclaimed a top-5 position by market cap, while Bitcoin dominance remains stable despite an expanding altcoin market.
The macro backdrop also matters. With inflation stabilizing and rate cuts on the horizon in key economies, risk assets are enjoying renewed favor. Bitcoin and XRP, once viewed as speculative, are increasingly seen as part of a diversified portfolio strategy.
Final Thoughts
BTC and XRP may finally be entering a synchronized bullish phase—one rooted not in speculation, but in structural adoption and maturing market dynamics. While both assets face different headwinds, the combination of institutional inflows, regulatory clarity, and strong on-chain metrics may represent the ultimate bullish signal for the rest of 2025.
Investors would do well to watch not just price action, but the convergence of adoption, utility, and trust—elements that now increasingly support both Bitcoin and XRP.
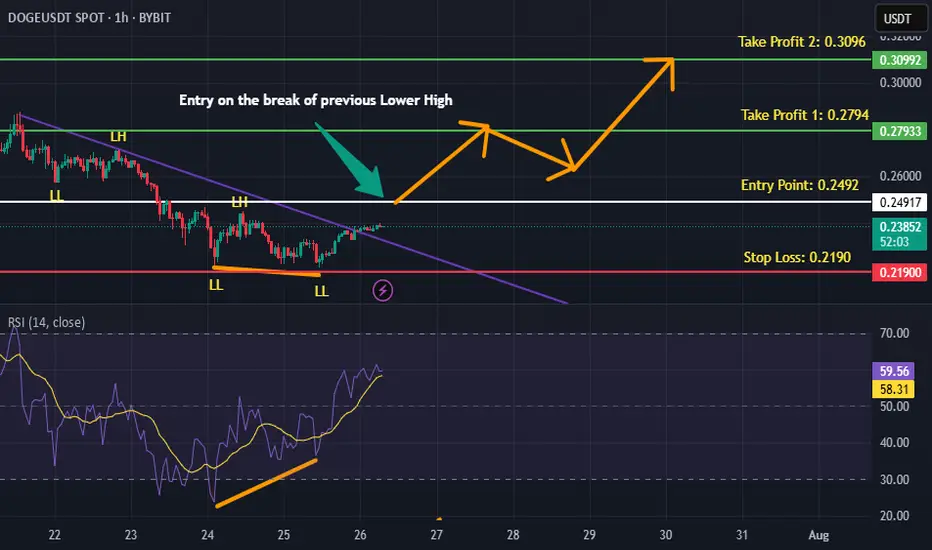
DOGEUSDT is BullishPrice went down for a small retracement on hourly timeframe, however the double bottom formation coupled with bullish divergence and breaking of descending trendline hints that bulls are assuming control of the price action. This sentiment would be validated with the break of previous lower high, according to Dow theory. Targets are mentioned on the chart.
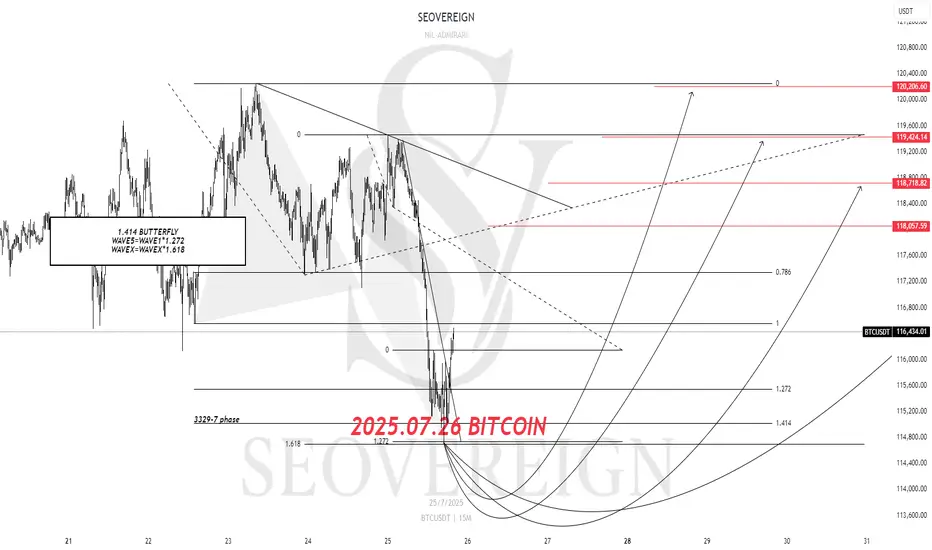
[SeoVereign] BITCOIN BULLISH Outlook – July 26, 2025The previous idea did touch the average TP price, but showed a rather disappointing rebound, so I will once again attempt to capture the starting point of the rebound. It is still considered that one more upward wave remains.
Accordingly, the TP is suggested at 118,057 USDT.
As always, I will carefully observe how the chart develops over time and update this idea with further explanations by organically integrating its specific interpretations and underlying rationale.
Thank you.
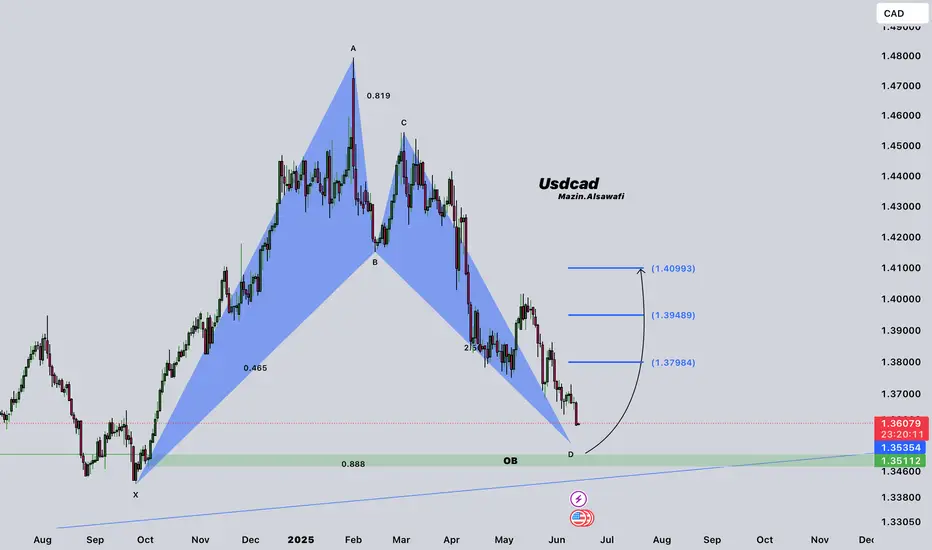
USDCAD analysis 1day frame We have bat 🦇 pattern and also ob ..I expect from this area 1.35114-1.34500 go buy for long to the targets in the chart
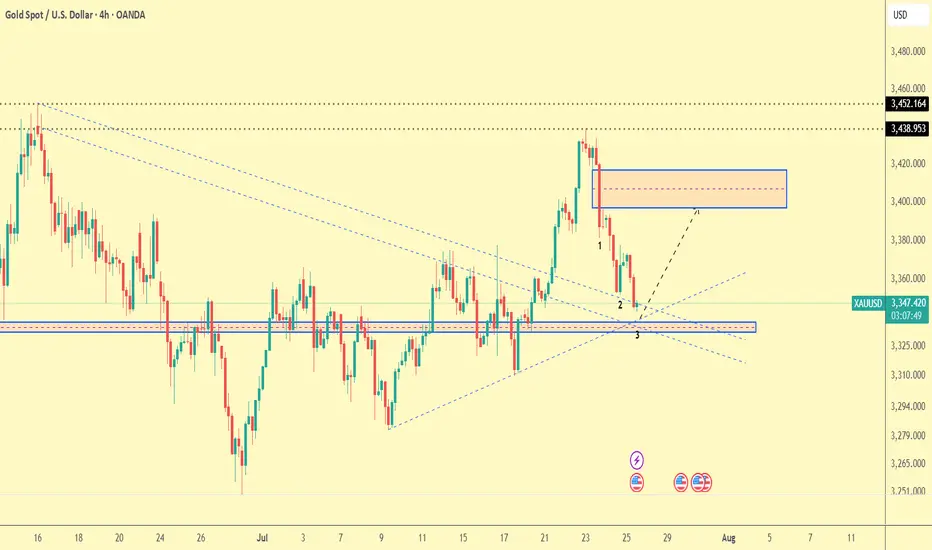
Gold Trade Plan 25/07/2025Dear Trader,
Gold (XAU/USD) is currently in a corrective phase, reaching near the support zone at around 3,340. The price is testing the trendline, and we may see a potential bounce towards the resistance level at 3,400-3,420. If the price breaks below this support, we could expect a further drop towards the next support levels near 3,325-3,310. The market will likely consolidate in this range until we see a breakout in either direction. The key levels to watch are 3,340 (support) and 3,400-3,420 (resistance). Monitor the price action closely as a reversal or continuation can occur here.
Regards,
Alireza!
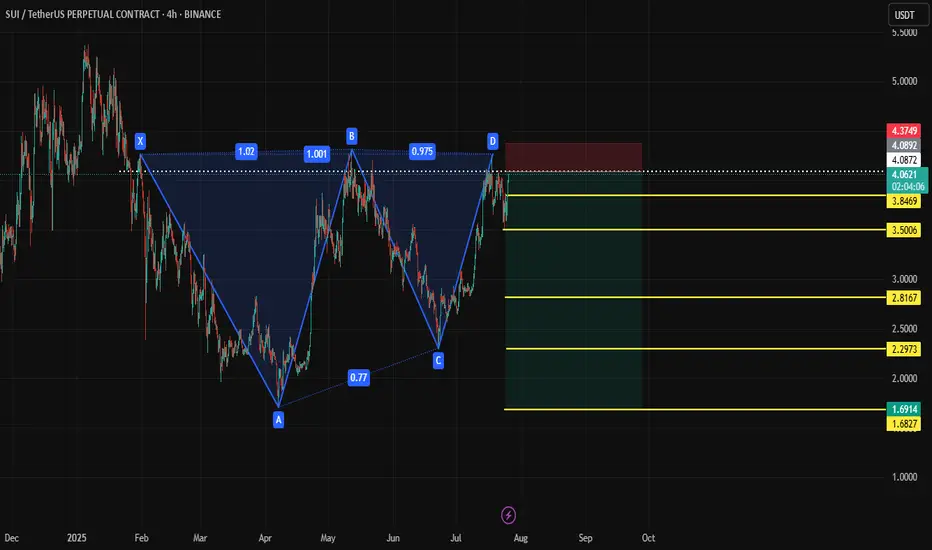
SUI Shortanalysis for sui bearish pattern
Short Entry: $4.10 – $4.20
Stop-Loss: $4.35+
Target 1: $3.60
Target 2: $3.10
Target 3 (Full XA move): ~$1.75 (aggressive)
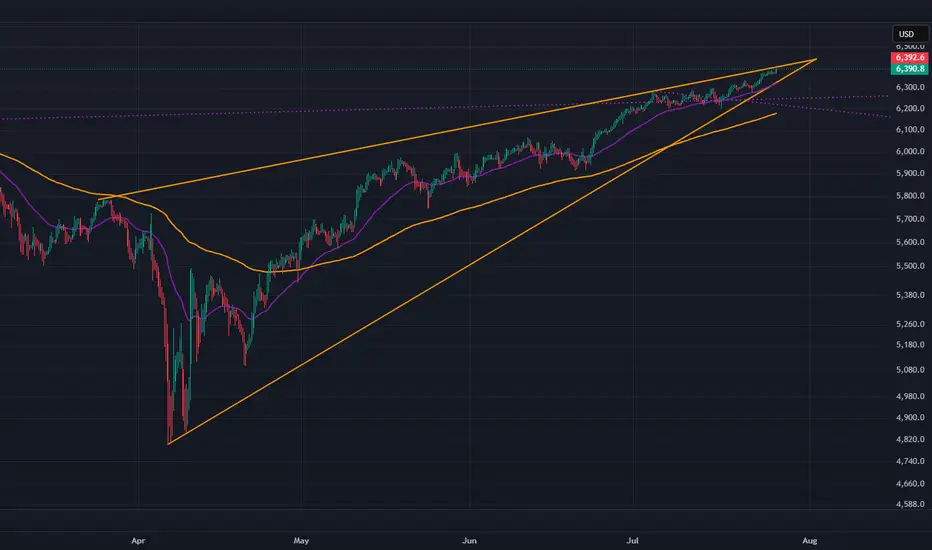
American Exceptionalism - The End of an Era "The Eagle and the Fall"
O say can you see, from the towers so high,
A gleam in the steel and a spark in the sky?
The factories roared and the railways sang,
And liberty’s bell through the cities rang.
We rose from the soil, rough-handed and proud,
With faith forged in steel and heads unbowed.
The eagle soared on ambition's flame,
Each man in his dream, each street with a name.
From sea unto sea, we built and we bought,
In ticker tape winds, prosperity caught.
The market climbed like a hymn on the air—
A temple of glass, reflecting a prayer.
But greed wore a mask and danced in disguise,
A siren’s whisper in financier’s eyes.
And credit, like wine, flowed too freely at last,
While whispers of worry were buried in glass.
October arrived like a thief in the mist,
And struck with a silence too brutal to miss.
A breath, then a cry, then a plunge in the floor—
The numbers all bleeding, the dream no more.
Yet still in the ruins, beneath ash and flame,
Burned a stubborn belief in America’s name.
For even when mountains of fortune did crash,
The stars and the stripes held fast through the ash.
O nation of daring, of promise and pain,
You rise not once, but again and again.
Through boom and through bust, your story is spun—
A land still unfinished, still chasing the sun.
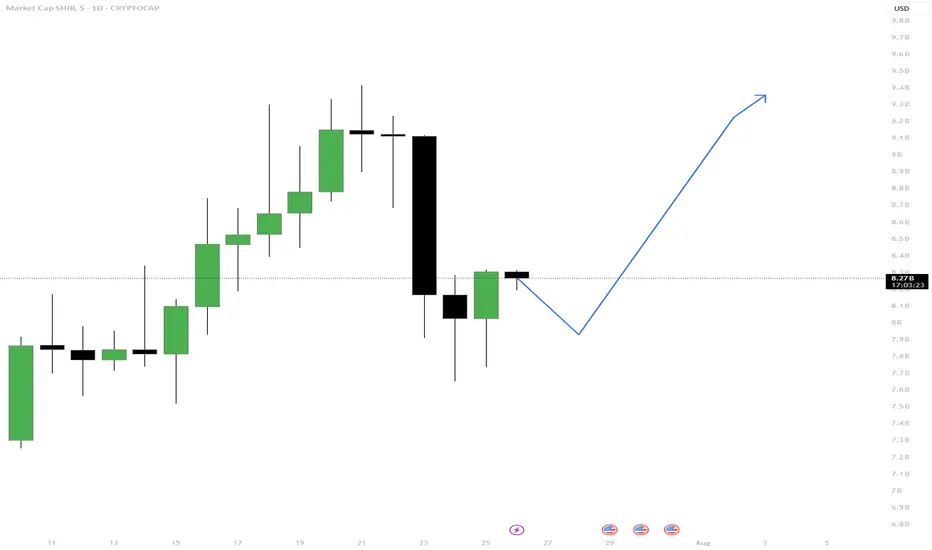
SHIB Market Cap – Dip Before the Rip?Hey Traders!
🧠 Idea: After a strong bounce from recent lows, SHIB’s market cap is showing signs of consolidation. A minor dip could come first, but if support holds, the next move may be a solid push upward.
📌 Tip of the Day:
Smart pullbacks often precede significant breakouts. Be patient and let the structure play out.
🔍 Why This Setup Makes Sense:
🔻 Big drop followed by recovery: Indicates buyers are stepping in.
💚 Strong support at 7.65B zone (wick rejection) shows buying interest.
📉 Short dip expected to shake out weak hands before possible rally.
🔼 Break above 8.4B–8.5B could trigger a continuation pump.
✅ Rules to Follow:
Don’t chase the green; wait for confirmation after any dip.
Key support to hold: 7.65B
Key breakout zone: 8.4B–8.5B
Invalidation: If market cap loses 7.65B and fails to bounce, reassess the setup.
Remember: Whales often buy dips, not breakouts. Let price come to you.
Let me know what you guys think about this post, don't hesitate to ask questions, drop some comments, boost this post and follow for more updates.
-Neo
#SHIB #CryptoCap #Altcoins #TradingView #CryptoAnalysis #MarketUpdate #DipBuyers #PatienceWins
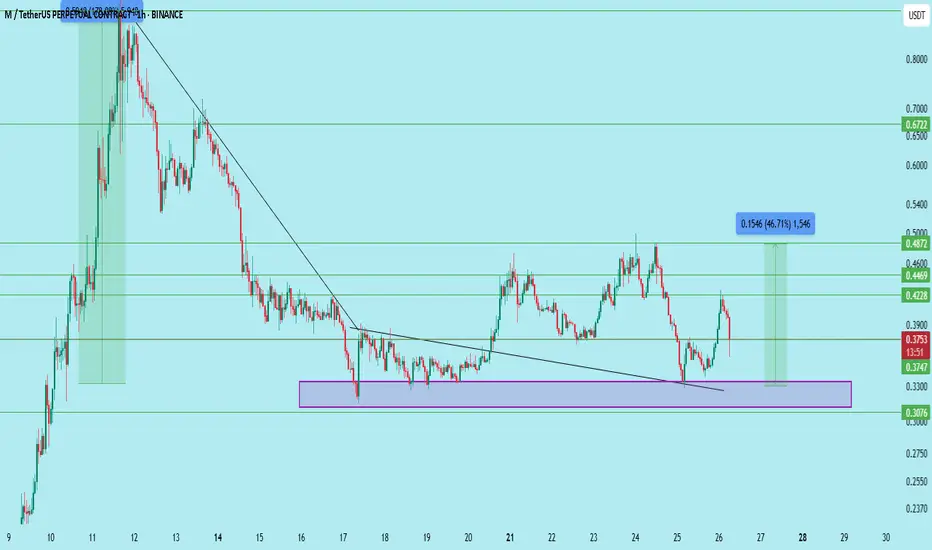
M/USDT — Demand Zone Retest with Strong Risk-Reward$M/USDT is retesting a significant demand zone (0.3210–0.3352) after a breakout and prior rally. This level previously sparked a major impulse move, and price has respected it again on the recent pullback.
Trade Setup
Entry: 0.330–0.345 (highlighted rectangle)
Stop Loss: Below 0.3076
Targets: 0.3747, 0.4228, 0.4469, 0.4872
Long-term Target: 0.6772
Structure
The setup offers nearly 46% upside to the first target and 100%+ to the long-term level. Retest and hold of the demand zone confirms bullish strength with a clean invalidation below 0.3076.
DYOR | Not Financial Advice
AUDUSD.JULY 29TH
Bureau of Labor Statistics will publish will JOLTS which measures the Number of job openings during the reported month, excluding the farming industry;
JOLTS Job Openings CB Consumer Confidence forecast 95.9 previous 93.0 .market will watch for data report for clear directional bias .
wednesday 30th
Australian Bureau of Statistics will publish the Consumer price index which Measures Change in the price of goods and services purchased by consumers
'Actual' greater than 'Forecast or below will be watched for clear directional bias .
this data are Frequency Released quarterly, about 25 days after the quarter ends;
and the next report will be on Oct 30, 2025
Consumer prices account for a majority of overall inflation. Inflation is important to currency valuation because rising prices lead the central bank to raise interest rates out of respect for their inflation containment mandate of 2%
Aud CPI q/q forecast 0.8% previous 0.9%
AUD CPI y/y forecast 2.1% previous 2.1%
AUD Trimmed Mean CPI q/q forecast 0.7% previous 0.7%
USD 1:15pm
1:15pm USD ADP Non-Farm Employment Change forecast 82K previous -33K
Advance GDP q/q forecast 2.4% previous -0.5%
Advance GDP Price Index q/q forecst 2.3% previous 3.8%
Pending Home Sales m/m forecast 0.3% previous 1.8%
USD Crude Oil Inventories-3.2M
by 7pm USD Federal Funds Rate previous 4.50% 4.50%
FOMC Statement
7:30pm FOMC Press Conference.
watchout for federal fund rate data report and FOMC (federal open market committee)
NOTE;TRADING ANAY INSTRUMENT IS 100% PROBABILTY ,ANY KEY LEVEL CAN FAIL YOU,DONT EVER TRADE WITH ALL YOUR CAPITAL BECAUSE YOU MENTOR SAY BUY OR SELL.
TRADING IS 100% PROBABILTY AND NO STRATEGY IS PERFECT.
TRADE WITH CAUTION.
WISH A HAPPY NEW WEEK.
BYE.

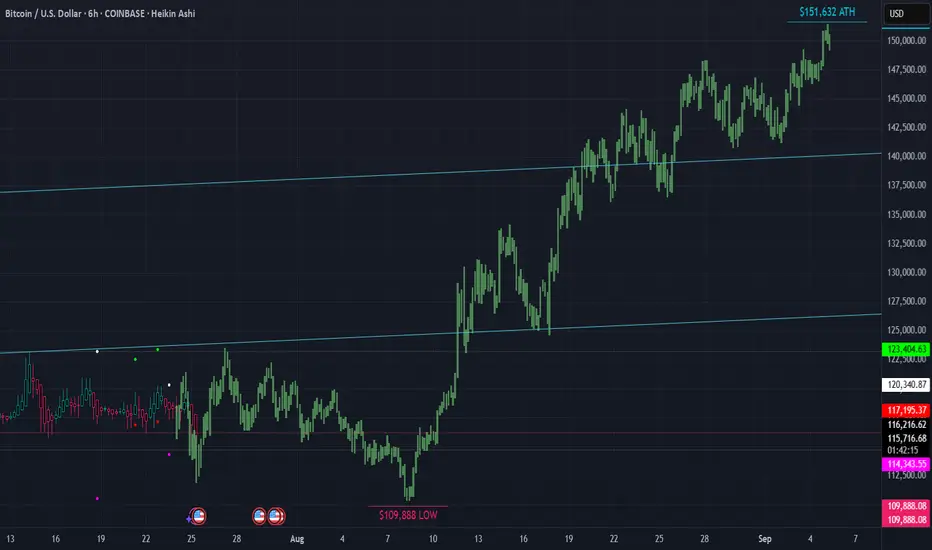
▒₿▒ BITCOIN FORECAST | 6HR ▒₿▒Hello @everyone. Long time. . . I was on a 3 year spiritual journey. I am back now and have many good things in the works. Who took my (non-financial) advice 3 years ago when I called the low of $15K a year in advance? And who believed me that it would go to $150K once we hit that $15K low? Who believes me now? Are you still thinking we've topped? Or do you think we have our $150K target in sight?
Have a look at this 6 HR Forecast. We have a low coming around AUG 8TH at $108K. And the most notable ATH of $151K around SEPT 5TH.
This is it. The playbook years in advance. I have never asked for anything or tried to sell you anything. It's all been done from a position of "paying it forward". Please, if you've taken my advice do the same.
I first bought Bitcoin in 2011. Was part of the MT GOX hack. And have had many ups and downs since then. One thing has never changed. . . And that is that Bitcoin is King. It's an asset class and a hedge against inflation. We're seeing this happen more now than ever. It's only got inflation as the halvings continue. The inflation rate of Bitcoin since/after this last halving is 0.84%. Bitcoin is up over 120-Million percent since 2011. Look at the BTC 6 MONTH candle chart and you'll see what Crypto asset you want to be in. Bitcoin is the only crypto asset.
When I first bought BTC it wasn't possible to purchase on an exchange with a debit card. I had to buy Linden Dollars from "Second Life" (which didn't always work because I had to deal with International Payment Processors due to US restrictions), then convert them to BTC on Mt Gox. Hardware wallets were not a thing. Now you can setup your bank account to auto buy on Coinbase and others. It's easier than ever. Store your coins on a hardware wallet and stay protected from the next FTX or hack.
This is the asset of the future. The "Digital Gold". I've seen the future and it runs on Blockchain and digital/virtual currency. A Super Artificial Intelligence will run and optimize all of our systems. Voting, assets, deeds, ownership and more will all be on a public blockchain ledger.
DEMATERIALIZATION/VIRTUALIZATION
INFORMATION & MEDIA
Music
We had music being played using metal, tin and wax in the 1800's, then mid 1900's we went to Vinyl and later in the late 1900's we went to plastic cassettes. And in 1990 - 2000 we had the CD which used laser optics to play the music. Effectively digitizing it. Then of course the MP3 player which was the next evolution in digitization. But where are we now? We are still in a type of digitization however it's evolved also. We are in a virtualization, where the music is not stored on the device itself, it's stored on servers which host the data to be accessed in the cloud/virtually.
You see the progression?
Metal/Wood > Vinyl/Plastic > Plastic/Digital > Metal/Digital > Virtual
(Or even further simplified on a higher level it would be Thoughts > Things > Digital > Virtual >)
What else has taken this path?
Movies
Metal/Wood - Film Projectors & Metal Reels
Plastic - Video Cassettes
Plastic/Digital - Optical Discs
Metal/Digital - Personal Digital Devices
Virtual - Cloud-Based Streaming
Books & The Written Word
Metal/Wood - The Printing Press
Paper/Plastic - Paperback Books
Plastic/Digital - Digital Archives on Discs
Metal/Digital - Handheld E-readers
Virtual - Cloud Libraries & Audiobooks
Money & Finance
Metal/Wood - Gold & Silver Coins (and even wooden coins)
Plastic - Payment Cards
Plastic/Digital - Secure Chip Cards
Metal/Digital - Mobile & Digital Wallets
Virtual - Digital/Crypto Currencies
This is the natural progression path. Are you the one still listening to cassette tapes while the MP3 player exists? Are you still using a physical thing while the virtual exists? (Nostalgia aside.)
NOW IS THE TIME!
Gold has been virtualized and it's called Bitcoin. While trading at 1,200,000 times more than it was 14 years ago it still has not yet realized it maximum value. In the past Gold and Silver were taken and bank/promissory notes were given in exchange. In fact it became illegal to not exchange your Gold and Silver for Dollars in the US. (1933 with the issuance of Executive Order 6102 by President Franklin D. Roosevelt.) The Dollar has no cap and is no different than Doge in that sense. BTC has a cap and a proof of work concept just like Gold. If you need to pay for things convert your BTC when you need to but holding or planning on making money off any other crypto currency that does not provide a base layer for our new virtualized financial infostructure it will not happen.
BITCOIN IS FINANCIAL LIBERATION FOR YOU, YOUR FAMILY, FRIENDS AND LEGACY.
BTC is up 3,000% in the past five and half years alone.
That's a 5.45 X Multiple per year. 545% growth rate compared to the unlimited and inflationary Dollar. Why not setup a reoccurring dollar cost average automatic purchase? We live in a day of virtualized programable currency, why not convert vapor currency to digital gold with the few clicks?
I am not a financial advisor. I am a Bitcoin Maximalist. Trade at your own risk. Assume your own responsibilities.
I have a big project I'm working on right now but also working on some TV Indicators in the background. I will share them with you all once I'm done testing them.
DISCLAIMER
I AM NOT A FINACIAL ADVISOR, NOR AM I YOURS. THIS IS NOT FINANCIAL ADVICE. MEARLY DOODLINGS ON A MATHMATICALLY DRIVEN GRAPHICAL INTERFACE, TRACKING AN INVISIBLE 256BIT MILITARY-GRADE ENCRYPTED ASSET. . . FOR ENTERTAINMENT/AMUSEMENT PUROSES ONLY. ENJOY!
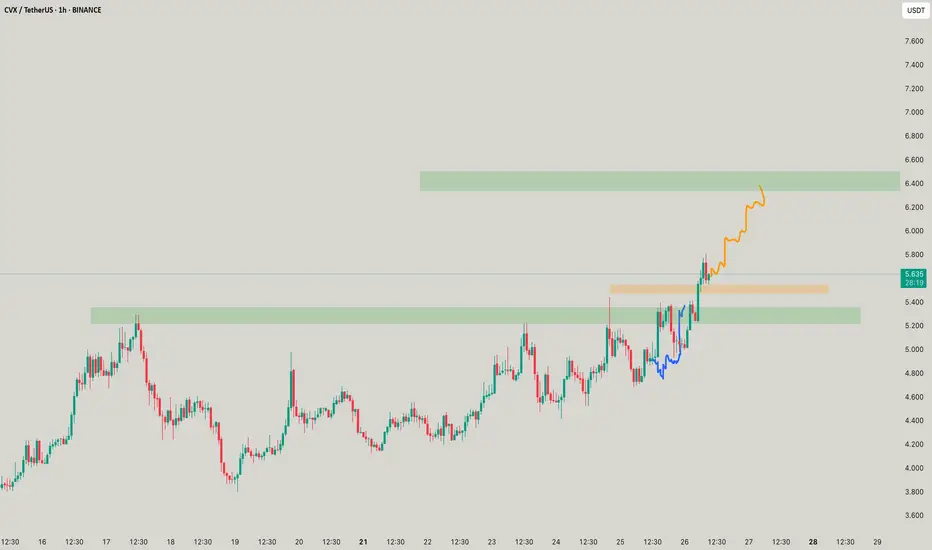
CVX - It asks for you to be civic!SO 6.5 ! when? soon? soon when? if it doesnt breaks the orange, though looks ripe to get the orange one
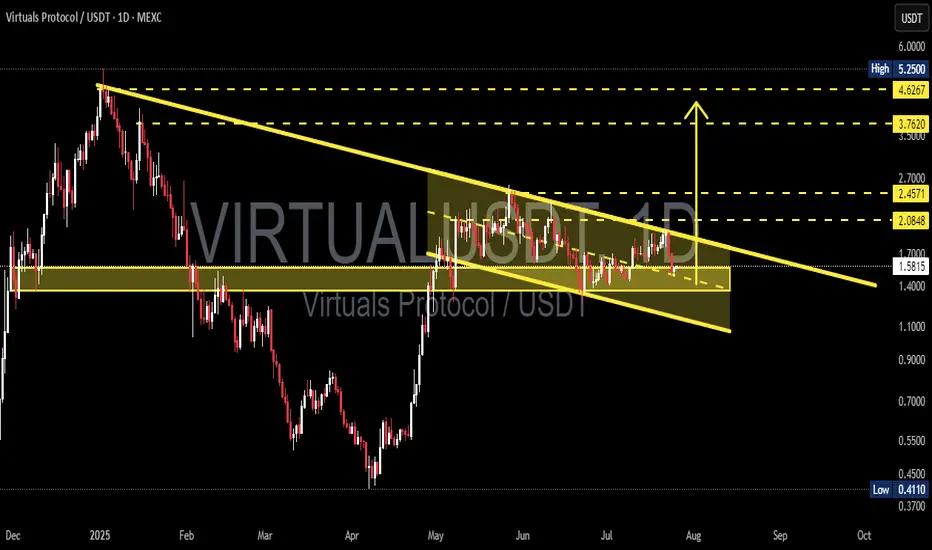
VIRTUALUSDT – Is the Wedge Nearing Its End? A Breakout Could!⏳ Current Situation:
VIRTUALUSDT is approaching a crucial moment after months of sideways price action. Following a steep decline from its all-time high ($5.25), price action has formed a Falling Wedge pattern — a well-known bullish reversal formation.
Now, as price consolidates toward the wedge's apex, the potential for a breakout grows stronger with each passing day.
---
📌 Pattern Structure:
Pattern: Falling Wedge (Bullish Reversal)
Duration: Since May 2025 (multi-month)
Support line: Ascending slope, catching lower dips
Resistance line: Descending pressure trendline
Price action: Trapped inside the wedge, signaling accumulation and shrinking volatility
This structure suggests that a large move may be right around the corner.
---
🔼 Bullish Scenario (Breakout):
If VIRTUALUSDT successfully breaks above the upper wedge boundary (~$1.70), the following key resistance levels could become major bullish targets:
1. $2.08 – Initial breakout confirmation level
2. $2.45 – Key resistance zone; breakout could accelerate here
3. $3.76 – Strong historical supply area
4. $4.62 – Major previous resistance
5. $5.25 (ATH) – Long-term bullish target if strong momentum follows
💡 Tip: A volume spike on the breakout adds confirmation and reduces the risk of a false breakout.
---
🔽 Bearish Scenario (Breakdown):
If the price fails to break out and instead falls below the wedge support (~$1.40):
1. Look for support near $1.20 – $1.10
2. Further downside could lead to $0.70 – $0.50
3. The ultimate support lies around $0.41, the current all-time low
⚠️ Note: A breakdown without volume can be a fakeout. Always wait for confirmation.
---
🎯 Conclusion & Strategy:
> VIRTUALUSDT is coiling inside a falling wedge pattern — typically a prelude to an explosive move. Whether bullish or bearish, the breakout direction will offer a strong trading opportunity.
Suggested Strategy:
Watch for breakout + volume confirmation before entering
Place tight stop-loss below wedge support if buying the breakout
Set tiered take-profits based on horizontal resistance zones
#VIRTUALUSDT #AltcoinBreakout #FallingWedgePattern #CryptoSetup #BullishReversal #BreakoutWatch #AltcoinAnalysis #CryptoTechnical #VolumeBreakout
PEPEUSDT – Downtrend Breakout & Golden Zone Retest in Play!📊 Chart Analysis:
On this daily timeframe chart of PEPEUSDT, price has successfully broken above the descending trendline that had capped the price since late 2024. This breakout is a strong early signal that bearish momentum is weakening and a potential trend reversal may be underway.
After the breakout, the price is now performing a retest at a key confluence support zone, including:
Fibonacci Retracement levels 0.5 (0.000011580) and 0.618 (0.000010835) — the Golden Zone
Previous horizontal demand zone (highlighted in yellow)
Retest of the broken descending trendline
This retest area will be crucial for determining the next directional move.
---
🐂 Bullish Scenario:
If price holds above the Fibonacci Golden Zone and forms a bullish confirmation candle, we could see a continuation of the uptrend toward:
0.000014191
0.000015000
0.000016836
0.000021533 (medium-term target)
Possibly retesting the High at 0.000028364
This would confirm the start of a major trend reversal and renewed bullish momentum.
---
🐻 Bearish Scenario:
If price fails to hold above the 0.000010835 level and breaks down below the Golden Zone:
Expect a drop toward psychological support around 0.000010000
And potentially further down to the strong support near 0.000007000
Such a move would invalidate the breakout and put PEPE back into a consolidation or extended downtrend phase.
---
🧠 Chart Pattern Notes:
Descending Trendline Breakout
Golden Zone Retest (Fibonacci 0.5 & 0.618)
Potential formation of an Inverted Head & Shoulders pattern (in early stages)
---
🎯 Conclusion:
PEPEUSDT is at a critical turning point after breaking out of a long-term downtrend. If the support at the Golden Zone holds, there is strong potential for a sustained bullish rally. However, traders should remain cautious and apply proper risk management in case of a breakdown below key levels.
#PEPEUSDT #CryptoBreakout #GoldenZoneRetest #TechnicalAnalysis #FibonacciLevels #PEPECoin #AltcoinAnalysis #TrendReversal #BullishSetup #BearishRisk

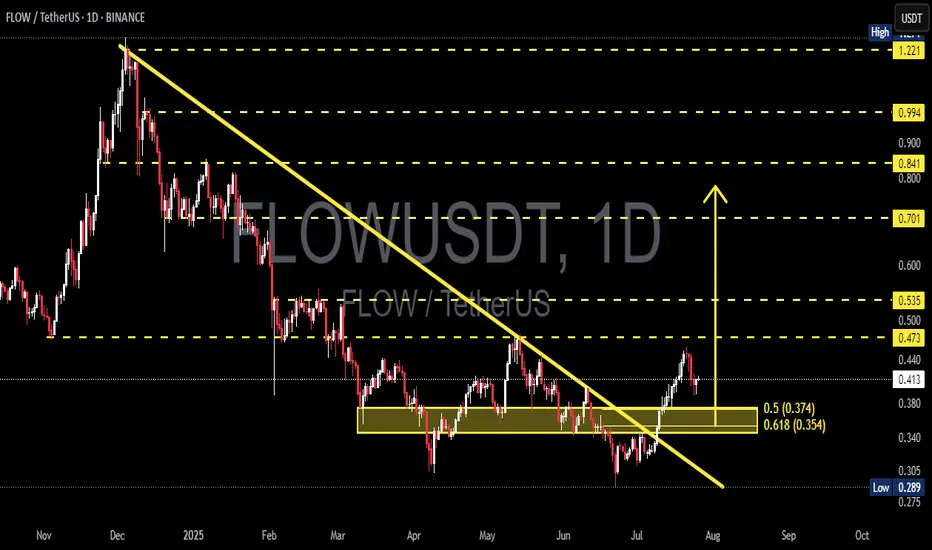
FLOWUSDT Breakout + Golden Pocket Retest: Ready to Explode?After being trapped in a persistent downtrend for months, FLOW has finally shown a major technical signal: a clean breakout from the dominant descending trendline that has defined price action since late 2024.
This breakout isn’t just visually appealing — it’s backed by strong technical confluence, including a key demand zone, Fibonacci retracement support, and potential shift in market psychology.
---
🧠 Technical Structure & Chart Breakdown
📉 Descending Trendline Breakout
The major downtrend line has been decisively broken, indicating that bearish pressure is weakening. This is an early but powerful sign that momentum may now be shifting toward the bulls.
🟨 Consolidation Zone & Flip Area (Yellow Box)
The $0.354–$0.374 zone has acted as:
Former resistance during sideways consolidation
Potential new support after the breakout (support-resistance flip)
📊 Fibonacci Retracement Levels
0.5 Fib = $0.374
0.618 Fib = $0.354
This area, also known as the "Golden Pocket", is one of the most critical levels in technical analysis. It often acts as a launchpad during bullish retests.
---
🟢 Bullish Scenario: Textbook Retest Before a Rally?
If the price holds and reacts positively from the $0.354–$0.374 zone, the following upside targets come into play:
1. 🎯 Target 1: $0.473 – Previous range resistance
2. 🎯 Target 2: $0.535 – Key horizontal level
3. 🎯 Target 3: $0.701 – Historical resistance
4. 🎯 Extended Target: $0.841 – $0.994, potentially up to $1.221 in a strong bullish expansion
For this scenario to play out, bulls must push a daily close above $0.473 to confirm strength and break market structure.
---
🔴 Bearish Scenario: False Breakout Ahead?
If the price fails to hold the golden pocket support:
The breakout could turn into a bull trap
The price may retrace toward:
$0.305 – Local support
$0.289 – The previous low
A strong bearish candle with volume below $0.354 would invalidate the breakout and may signal renewed downward pressure.
---
💡 Conclusion: Critical Decision Point Ahead
FLOWUSDT is now at a pivotal point. The breakout has happened — but the retest zone will decide everything. Will it serve as the foundation for a larger bullish rally, or will it mark the start of another bearish wave?
Watch price action closely around $0.354–$0.374 — that’s where smart money makes their move.
#FLOWUSDT #CryptoBreakout #TechnicalAnalysis #GoldenPocket #RetestZone #FibonacciLevels #AltcoinSetup #CryptoMomentum #FlowAnalysis