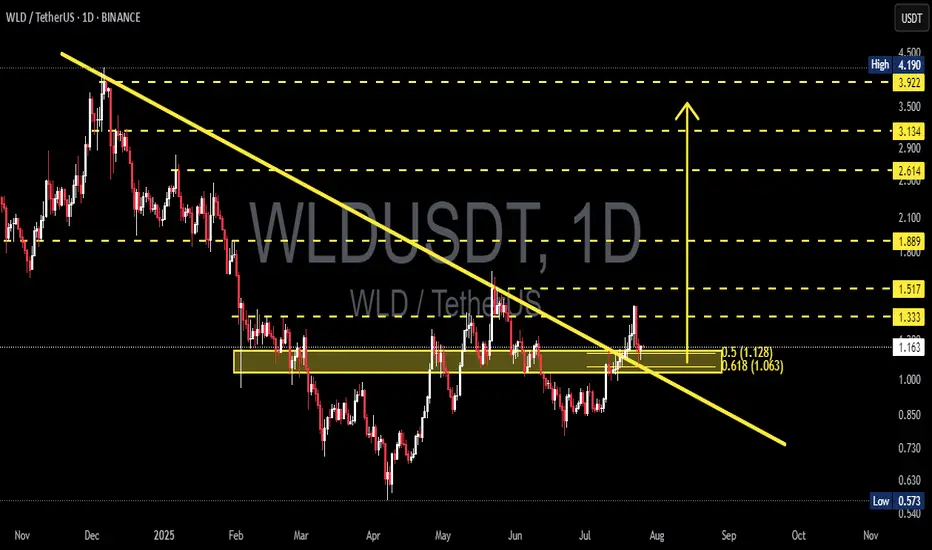
WLDUSDT at a Critical Level: Valid Breakout or Just a Fakeout?WLDUSDT is catching traders' attention after successfully breaking above a long-term descending trendline that has capped price since late 2024. But the big question now is — is this the start of a real trend reversal, or just a classic bull trap fakeout?
---
📌 Detailed Technical Breakdown
🟡 1. Major Trendline Breakout
The yellow trendline drawn from November 2024 has finally been broken to the upside.
This is a potential signal that bearish momentum is weakening significantly.
🟨 2. Key Demand Zone (Horizontal Yellow Box)
The area between 1.063 – 1.128 USDT has acted as a strong demand/support zone since March 2025.
Price is currently retesting this zone, which makes it a decisive level for validating the breakout.
🔁 3. Fibonacci Retracement Levels
Price is retesting the 0.5 (1.128) and 0.618 (1.063) retracement levels.
These fib levels could serve as a launchpad for a bullish continuation if held.
🧱 4. Layered Resistance Structure
If the bounce holds, WLD could target:
🔹 1.333 – Psychological resistance
🔹 1.517 – Previous structural resistance
🔹 1.889 – Key horizontal level
🔹 2.614 – 3.922 – Medium-term targets based on historical structure and fib extension
---
🟢 Bullish Scenario (Increasing Probability)
Price holds above the 1.063 – 1.128 zone and confirms a rebound.
A daily close above 1.333 would further confirm bullish continuation.
Formation of higher highs and higher lows would validate trend reversal.
🔴 Bearish Scenario (If Breakdown Occurs)
Price loses support at 1.063, invalidating the breakout and retest.
Possible targets to the downside:
Minor support: 0.85 – 0.75
Major support: 0.573 (Previous macro low)
---
📈 Interesting Chart Pattern
Potential formation of an Inverse Head and Shoulders, with the neckline around 1.333.
A confirmed breakout above the neckline could trigger a strong bullish impulse.
---
🎯 Conclusion
WLD is now in a golden zone that will decide its medium-to-long-term trend.
The 1.063 – 1.128 area is make-or-break. If bulls defend this zone, it confirms trend reversal. If it fails, WLD could slide back into a distribution range.
📌 Traders who wait for confirmation at this stage may have the strategic edge.
#WLDUSDT #WLDAnalysis #CryptoBreakout #TrendlineBreak #TechnicalAnalysis #InverseHeadAndShoulders #FibonacciSupport #AltcoinSetup #CryptoTrading #CryptoUpdate
Harmonic Patterns
A to 236 or B killing A to 420Tesla is one of those stocks that is heavily manipulated algorithmically. When we were in an uptrend and needed a little push, a large fractal was created that could break a previously formed structure which should have taken us to $236(A). Interestingly, a very strong symmetrical triangle has emerged, influencing this upward movement, and the final price—due to some mystical reason—seems to be $420(B). It’s also worth noting that this whole move is being influenced by another similar structure whose target is above $600. So, if we analyze everything that’s happening, a 12% drop in sales means nothing compared to what Tesla will gain from robots, restaurants, and robotaxis, which I call RRR

Third quarter and something we didn’t expectso I’ve been watching the markets for a while and honestly this new admin is doing something that many didn’t saw coming.
it's not even a full year yet, we’re still on Q3, but the impact on the economy is starting to show. what really gets my attention is the tariff collection, it’s been really high and from what I see it’s even generating some kind of surplus in certain areas.
at first I thought this was going to slow down the market or create pressure, but the opposite happened, the stock market has been hitting all time highs, especially in tech and defense sectors.
inflation didn’t spike like people was saying, that calmed down many investors and the flow of money is pretty obvious.
i’m not an expert or nothing but this first months looks like there’s a real direction and the money is moving in a positive way. still need to see how this year closes but if it stays like this, could be one of the strongest starts for a president in a long time.
just wanted to share my thoughts, what you guys think?

REI/USDT CYCLE UPDATE $0,90 by 2025 - Price prediction📈 REI/USDT CYCLE UPDATE – $0.90 by 2025
REI could break above its old ATH, targeting $0.90 in the upcoming cycle. Why?
Upcoming
✅ Ultra-fast blockchain (⏱️ 1.5s block time)
✅ Gas-free or near-zero fees – perfect for DeFi, NFTs & gaming
✅ EVM-compatible – easy migration for Ethereum dApps
✅ Low market cap → high upside potential
✅ Clean tokenomics with staking + resource model
✅ Built for speed, scale & adoption
DATA
Data shows that there is a structural trend going on, where this coin can break soon.
If the altcoin market heats up, REI has the fundamentals & tech edge to explode past previous highs. 🚀
🧠 Watch this one closely.
#REINetwork #Crypto #Altseason #EVM #PricePrediction #Web3
This is not trading advice, but a view from a side of study.

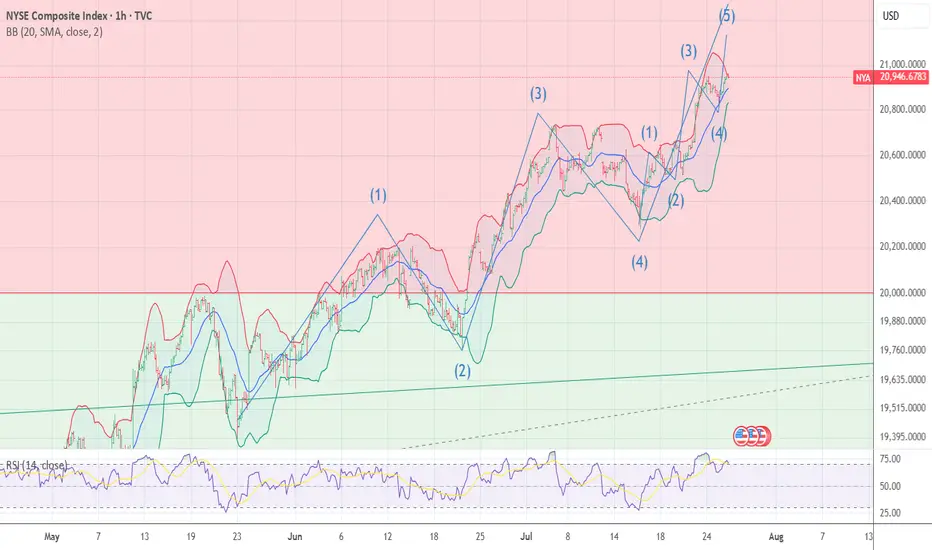
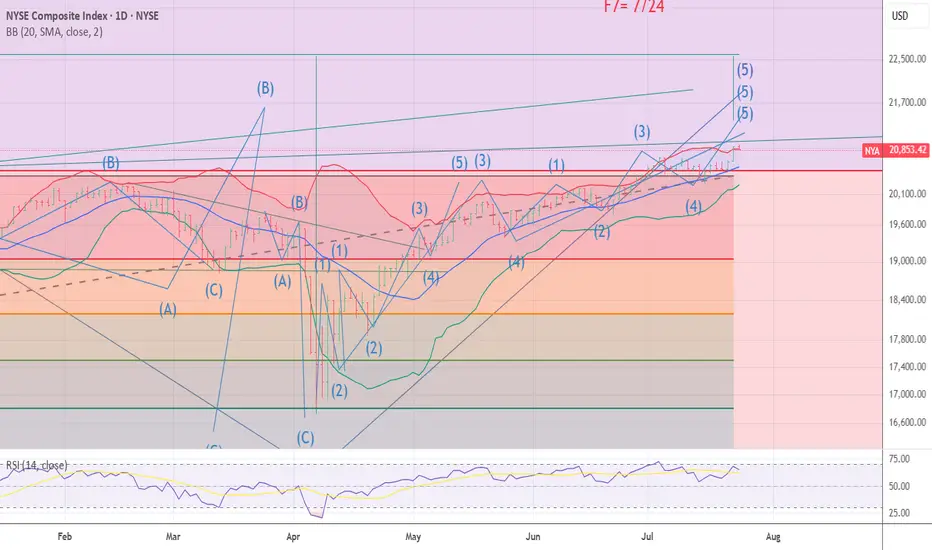
NYA Hourly 5th of the 5th If the Bull market is to advance we can NOT drop below .382 of the rally from 4/7 2025 Were I said 4835 was wave 4 in Super cycle .it is this simple Which is the 200 day avg BTW !!!!!!!best of trades WAVETIMER
WEEKLY NYA turns and E Wave see 12/8 2024 forecast The chart of the NYA I have not changed or relabeled anything since 12/8 2024 best trades WAVETIMER
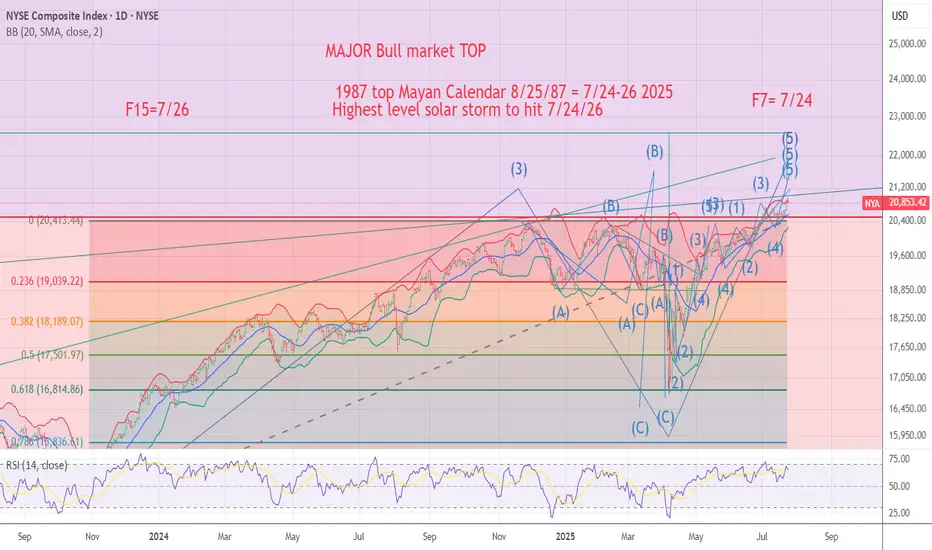
NYA 5of 5 of 5 into the spirals and solar peak Mayan 1987The chart posted has Not had one labeling changed since My view 11/29 12/6 cycle peak
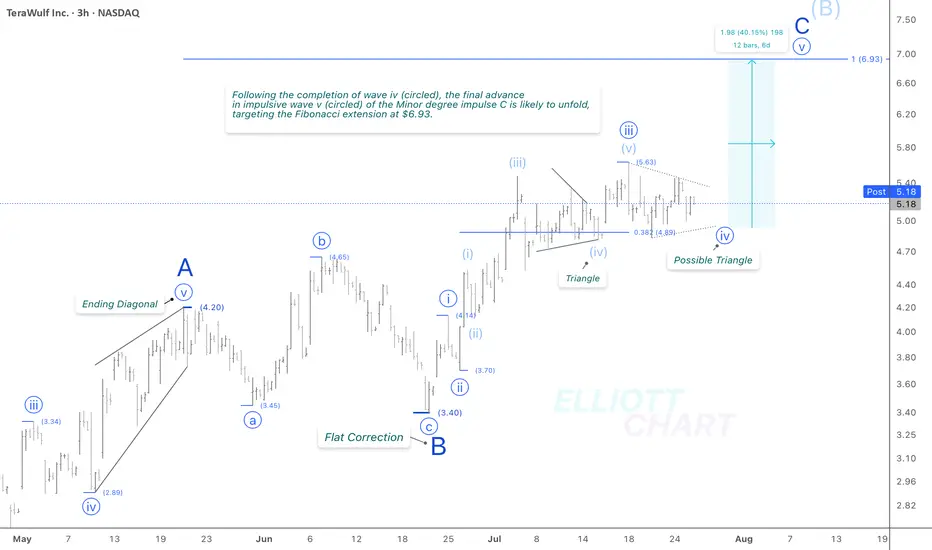
WULF / 3hWave Analysis >> While the overall outlook on NASDAQ:WULF remains consistent with the previous analysis, the ongoing sideways volatility suggests a need to reassess the wave count on the final stages of Minor degree impulsive advance in wave C.
The Fib extension target remains intact >> 6.93
Trend Analysis >> Upon completion of Minor degree wave C, the countertrend advance of Intermediate degree wave (B), which has been unfolding since April 9, is likely to give way to a decline in wave (C) of the same degree. This downtrend might begin in the coming days and potentially extend through the end of the year!!
NASDAQ:WULF CRYPTOCAP:BTC BITSTAMP:BTCUSD MARKETSCOM:BITCOIN
#CryptoStocks #WULF #BTCMining #Bitcoin #BTC
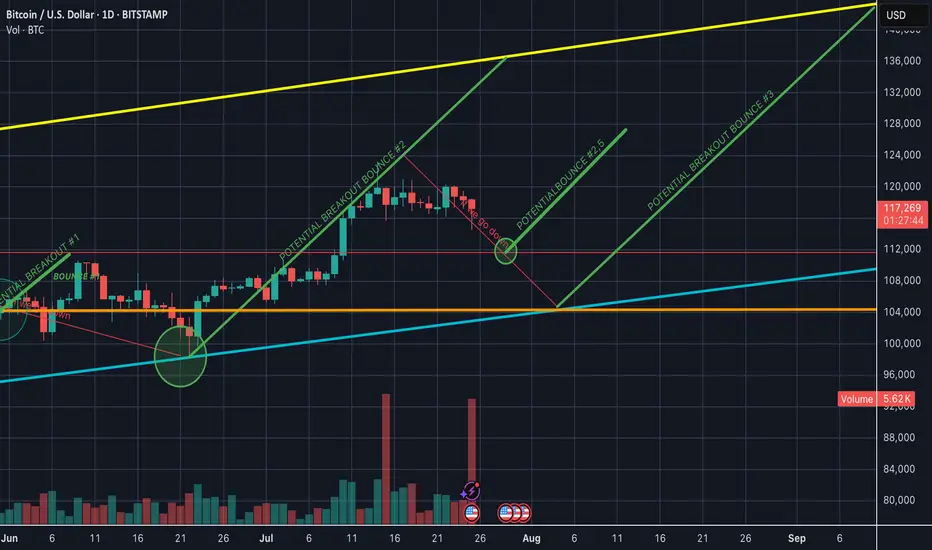
going lower or bouncing on resistance? market is respecting key support/resistance or channel boundaries. These points often become decision zones where big moves occur.
Signs this could be a fakeout:
BTC wicks above a resistance or below a support with little follow-through
Volume spikes only on the wick, then dies quickly
Price reverses back into the range soon after breaking it
If BTC recently broke a trendline with low volume, it smells like a trap move — a liquidity grab.
If it’s testing support again after failing to rally, and volume is increasing on red candles, a leg down is possible.
However, macro trend is still up unless we lose a major higher low (say, sub-$60k or sub-$56k depending on your chart).
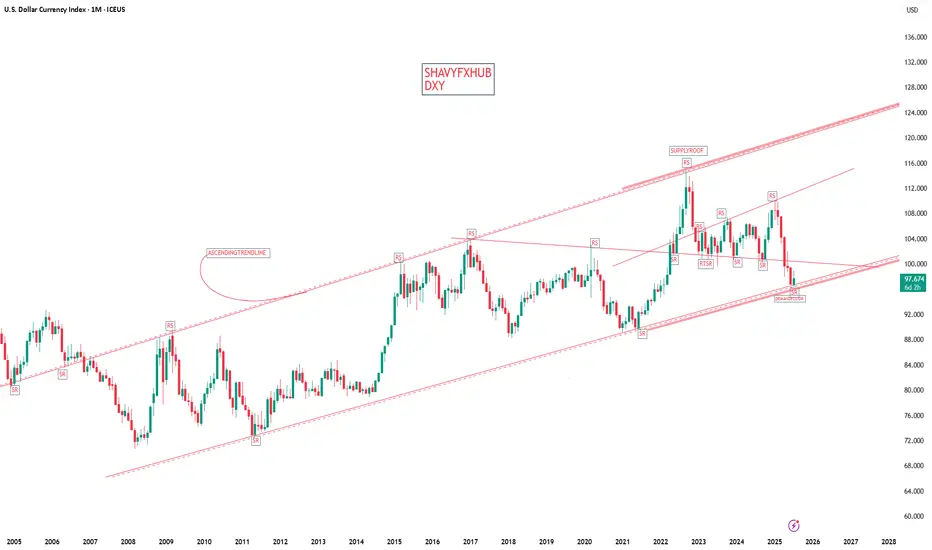
DOLLAR DXY dollar index on monthly support and we are watching the price action.lets watch the price action.
#dollar
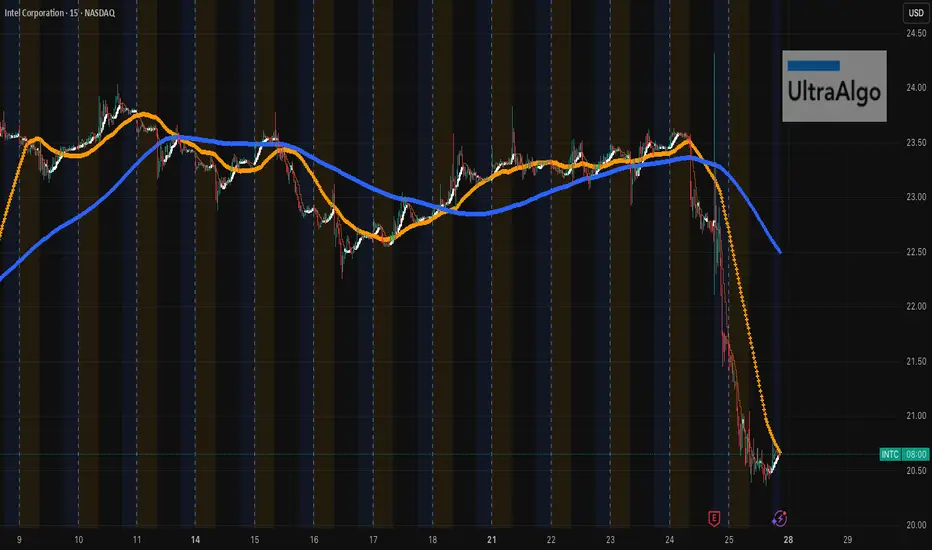
$INTC Got Smacked. Relief Bounce or Trap?Yikes. NASDAQ:INTC just faceplanted from $23.50 straight down to $20.50. It’s peeking its head up now. If you’re playing the bounce, be nimble — this thing’s still bleeding on the higher timeframes. Don't get in unless you see more pickup and buy signal.
UltraAlgo caught the drop early. If it crosses $20 could go down deeper.
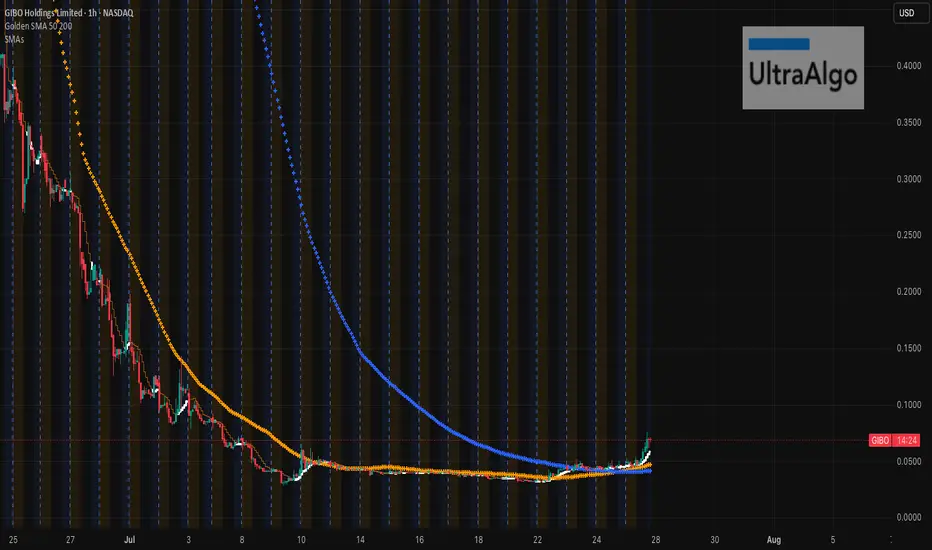
$GIBO Finally Woke Up…MaybeNASDAQ:GIBO has been on life support for weeks, just bleeding out with zero pulse. But looks like someone finally shocked it back to life with that BUY trigger flashing. If this isn’t a dead cat, we might see a nice pop. Just remember to get out while in profit! Still, don’t be the last one holding the bag.
UltraAlgo caught the early buy signal… first green glimmer we’ve seen in a bit. Keep it in the back pocket.
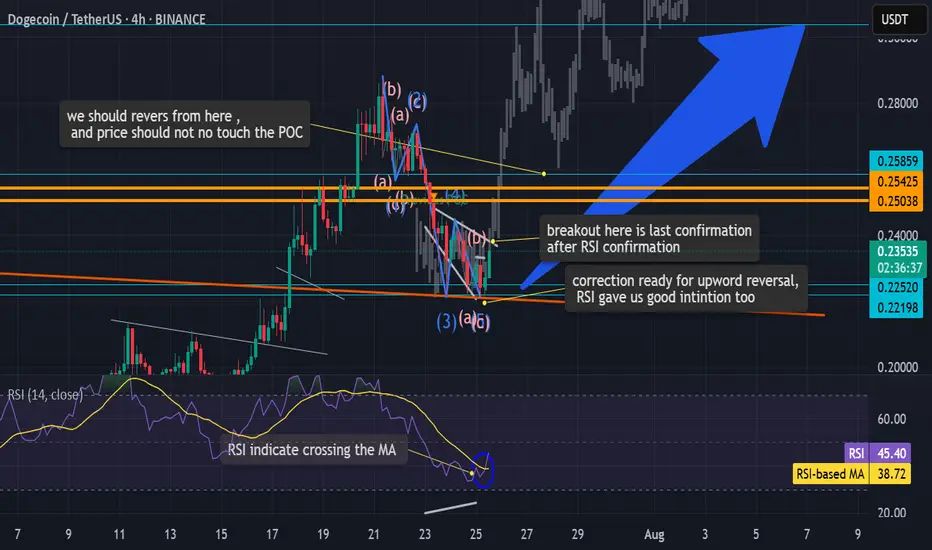
Newtusdt.pIt might get pump back to the top.
We need to see some bullish momentum before entering to the trade..
Always take 50% profit when price starts to move.
Rest DYOR

Gold - The clear top formation!🪙Gold ( TVC:GOLD ) just created a top formation:
🔎Analysis summary:
Over the past four months, Gold has overall been moving sideways. Following a previous blow-off rally of about +25%, this cycle is very similar to the 2008 bullish cycle. Bulls are starting to slow down which will most likely result in the creation of at least a short term top formation.
📝Levels to watch:
$3.000
🙏🏻#LONGTERMVISION
Philip - Swing Trader

next levels for Dogecoin id very promising honest and well-made TA for doge next levels , with explanations and know how notes full of evedinces with solid knowledg of TA and Volume prifiles with calsics too. btc also , startes is wave D formation upwords, after that a good correction is comming to the market for late entries who did not see our TA's before and now . your support join and share some of a littile bit of your profit will make you make more and safe in this very hard market. peace and stay safe
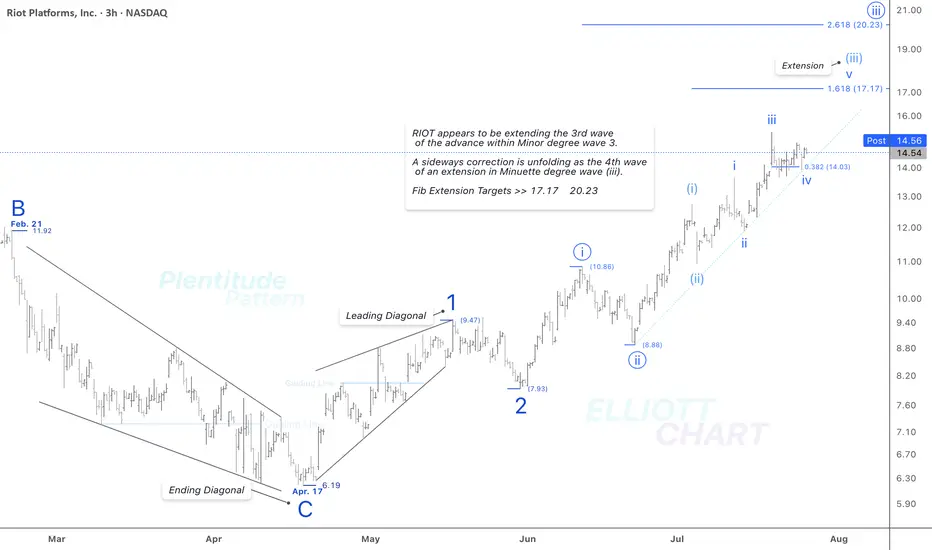
RIOT / 3hAs illustrated on the 3-hour chart above, NASDAQ:RIOT appears to be extending the third wave of an impulsive advance within Minor degree wave 3.
And as anticipated, a sideways correction is unfolding as the fourth wave of the ongoing extension in Minuette degree wave (iii).
Fib Extension Targets >> 17.17 & 20.23.
>>> In this timeframe, I'm analyzing the initial rising tide within the ongoing Intermediate degree wave (1), where a nested series of waves have quite well revealed: 1, 2 → i (circled), ii (circled) → (i), (ii) → i, ii. The extreme high of this impulsive sequence lies beyond the visible range of the current chart.
NASDAQ:RIOT CRYPTOCAP:BTC BITSTAMP:BTCUSD MARKETSCOM:BITCOIN
#CryptoStocks #RIOT #BTCMining #Bitcoin #BTC
2025 Is a Big Year for Bitcoin Miners—Who’s Winning the Hash War
Bitcoin’s resurgence in 2025 has reignited the mining race. The halving came and went, hashprice bounced from the abyss, and a fresh wave of capital is pouring into the space. So we figured: time to catch you up on who’s making real moves and pulling ahead — both in market cap and megawatts.
⚡ CleanSpark (CLSK): The Sharpshooter
If Bitcoin mining were a sport, CleanSpark would be the athlete that trains all year, eats clean, and shows up for every match. No drama, just execution.
In 2025, CleanSpark continues to grow fast — but smart. It’s acquiring distressed sites, upgrading facilities with immersion cooling, and pushing its fleet beyond 50 EH/s. Its Tennessee expansion (a deal scooped up for pennies on the dollar) was classic CLSK: low cost, renewable-powered, and ready to scale.
In Q1 2025, CleanSpark posted $162.3 million in revenue, up a blistering +120% YoY, and delivered $246.8 million in net income, or $0.85 per share. It's one of the few miners that’s profitable and expanding — at the same time.
The stock is up 25–30% YTD, trading around $12. While it’s been volatile like the rest of the sector, CLSK remains the benchmark for cost-effective, execution-focused Bitcoin mining. If you’re looking for a fundamentals-backed growth story, this is it.
🏗️ Iris Energy (IREN): The AI-Ready Dark Horse
Iris Energy may have flown under the radar in past cycles, but in 2025 it’s turning heads — not just because of Bitcoin, but because of data infrastructure.
While IREN runs a lean BTC mining operation powered by 100% renewable energy in Australia and Canada, the real story is its pivot toward modular data centers. It’s one of the few miners actively positioning itself for GPU workloads and AI compute as a hedge against mining volatility.
The upside? Flexibility. If BTC mining margins compress again, IREN has the facilities and roadmap to reconfigure its power-hungry machines for AI hosting. The market likes the optionality. The stock’s up ~70% this year and may still be cheap if the data center thesis catches on.
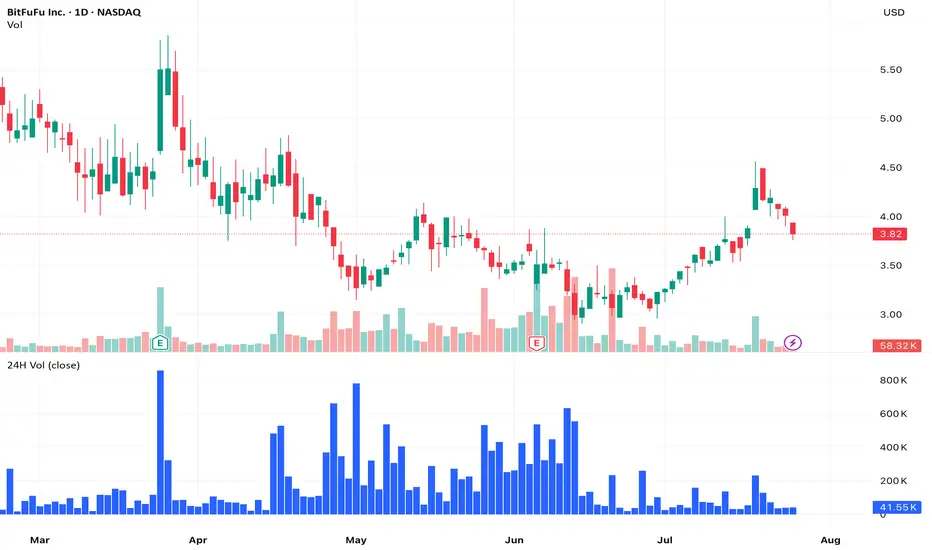
🔥 BitFuFu (FUFU): The Challenger
BitFuFu came in hot after its 2024 IPO — vertically integrated, Bitmain-backed, and global from day one. It’s the largest cloud mining provider in the mining space. It provides cloud mining, sells miners, hosts them, runs its own mining pool (BitFuFuPool), and operates a global fleet clocking over 36 EH/s under management.
While others focused on HPC & AI business, BitFuFu doubled down on mining scale and infrastructure. It aims to own over 1 GW of power capacity and launched its own mining operating system.
The post-halving reality has been rough. Q1 2025 revenue came in at $78 million, down 46% YoY, with self-mining revenue dropping 70.7%. But the company has a track record of being profitable every year since founded, plus its P/S is only 1.6, well below other mining giants such as Mara and Riot.
Watch this one. Especially if BTC pushes above $150K.
🐋 Marathon Digital (MARA): The Goliath, Still Standing
Marathon is the largest public miner by market cap — and has been the face of institutional mining exposure for years. It’s also the most debated name in the game.
On one hand, MARA controls a monster fleet with over 75 EH/s expected by year-end, global mining operations from the U.S. to the UAE, and a budding software business for managing hashrate.
On the other, critics argue it’s bloated, overly reliant on third-party infrastructure, and too slow to pivot in a fast-moving landscape.
Still, when Bitcoin’s hot, Marathon runs. The company holds a large BTC treasury of over 50,000 BTC, is adding immersion-cooled sites, and remains a proxy trade for many traditional investors wanting in on mining without picking niche plays.
Love it or hate it, MARA isn’t going anywhere. And if BTC moons in Q4, it’ll be one of the first tickers to feel the heat.
🧊 Cipher Mining (CIFR): The Quiet Killer
Cipher isn’t flashy. It doesn’t dominate headlines or make bold predictions. What it does do: mine Bitcoin efficiently, at low cost, with minimal dilution and maximum discipline.
Based in Texas, CIFR locked in long-term power contracts at enviably low rates and steadily grew its fleet past 13.5 EH/s. It has some of the best cost-per-BTC metrics in the industry and avoids unnecessary spending or debt.The Texas-based miner produced 602 BTC in Q1, and benefits from low power contracts and disciplined growth.
The market loves it: CIFR is up ~35% YTD, trading at $6.52. It’s becoming a favorite among investors who want hash exposure with less volatility and more transparency. The monthly production updates are clear, consistent, and confidence-building.
👀 Trends to Watch in H2 2025
1. Hashprice Rollercoaster: Hashprice (BTC earned per TH/s per day) has bounced from $39 post-halving lows to nearly $60. If BTC rallies again, miners with fixed-cost power will reap the upside.
2. GPU Hosting Pivot: With AI demand surging, some miners are repurposing infrastructure to host GPUs — think IREN.
3. M&A Season: Expect smaller players with weak cash flow to get scooped up.
4. Regulatory Shifts: Crypto Week laws passed in the U.S. provide more clarity. But ESG pressure and power usage scrutiny will remain part of the narrative.
💭 Final Thought
Bitcoin mining stocks aren’t just about Bitcoin anymore.
They’re about infrastructure. Data. Energy. Efficiency. Optionality. And in 2025, the winners will be those who can balance raw hashpower with strategic foresight.
Whether you’re team CLSK, FUFU, IREN, MARA, or CIFR — the landscape is shifting fast. And with BTC momentum building again, this might just be the beginning.
So — which miner are you backing this cycle?
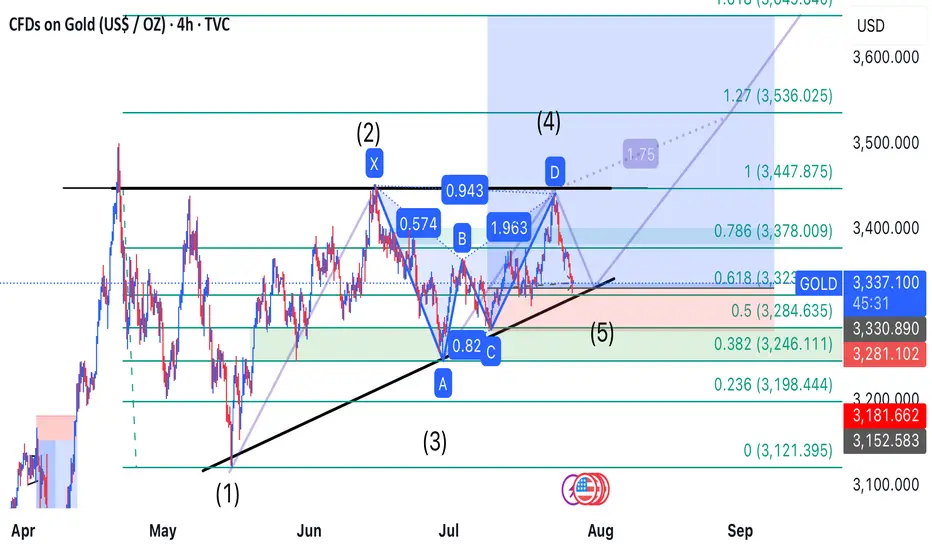
Gold’s Precision Drop: Wave 5 Ignites the Bullish Reversal
---
### 🚀 **Golden Opportunity Ahead: Wave 5 Bullish Breakout Incoming!**
After perfectly completing the **bearish Gartley pattern**, gold dropped precisely to the **target zone at 3,323**, just as predicted. This move confirmed the formation of **Wave 5**, signaling the end of the corrective phase.
Now, all signs point to a **strong bullish reversal**—and the next step is a powerful rally toward the predefined targets. This is a **prime buying opportunity** for traders looking to ride the wave!
### 🎯 **Buy Zone:**
- **Entry:** Around **3,323 USD**
### 📈 **Profit Targets:**
| Target | Fibonacci Level | Price (USD) |
|--------|------------------|-------------|
| TP1 | 1.0 | 13,447.875 |
| TP2 | 1.27 | 13,536.025 |
| TP3 | 1.618 | 13,649.640 |
The link of. The previous analysis is below in the comment
---
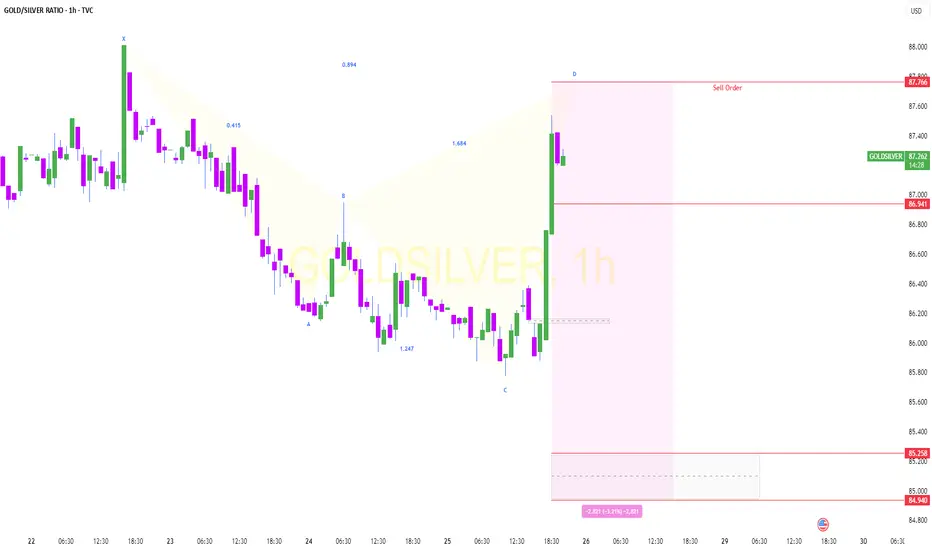
Sell setup if the sell trigger gets activated.Due to a weak trend and a rejection from the all-time high, we’ve seen a strong rejection, suggesting that the price may drop further. If the sell trigger gets activated, it could be a good opportunity to open a sell position.
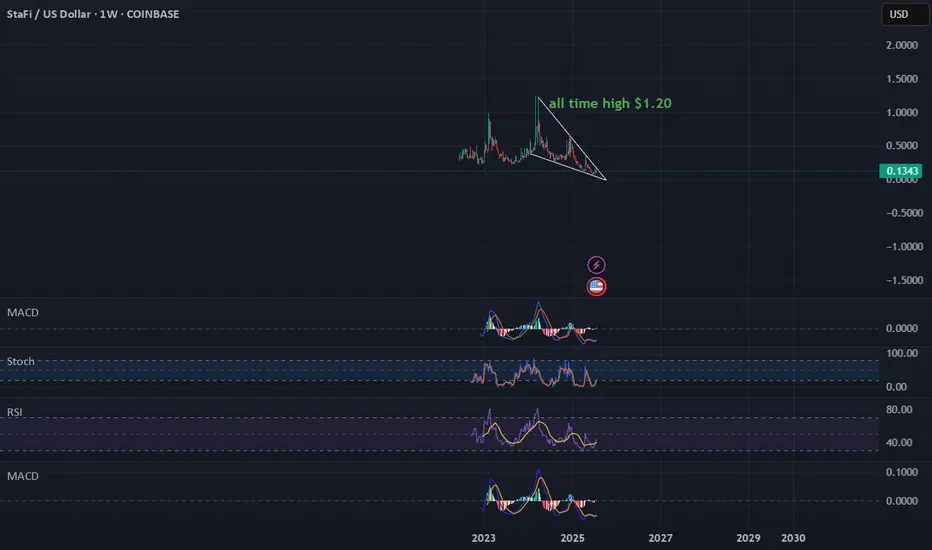
FIS (StaFi) low cap altcoinFIS (StaFi) low cap altcoin 15 million mcap with ethereum growing in marketcap defi has lots of potential as well
trading at $0.13
mcap 15.3 million
3000 holders
all time high $1.20
9x a 10x profit to ath
rsi = avg bullish
macd = avg
project info
StaFi LSD Stack is a LSD(Liquid Staking Derivative) stack, developed and maintained by 61 LAB, mainly built for developers who want to create LSTs(Liquid Staking Token). With StaFi LSD Stack, you can build a new LST by simply clicking, while gaining LST’s composability and programability
$CLOV Bearish Crab ConfirmedStill new to harmonics. Seeing this late but this looks like bearish crab that formed on the 30M. If it is or was it confirmed.

GOLDSILVER Short .GOLDSILVER Index may fall from 87.77 towards target (order block zone), based on shark pattern.