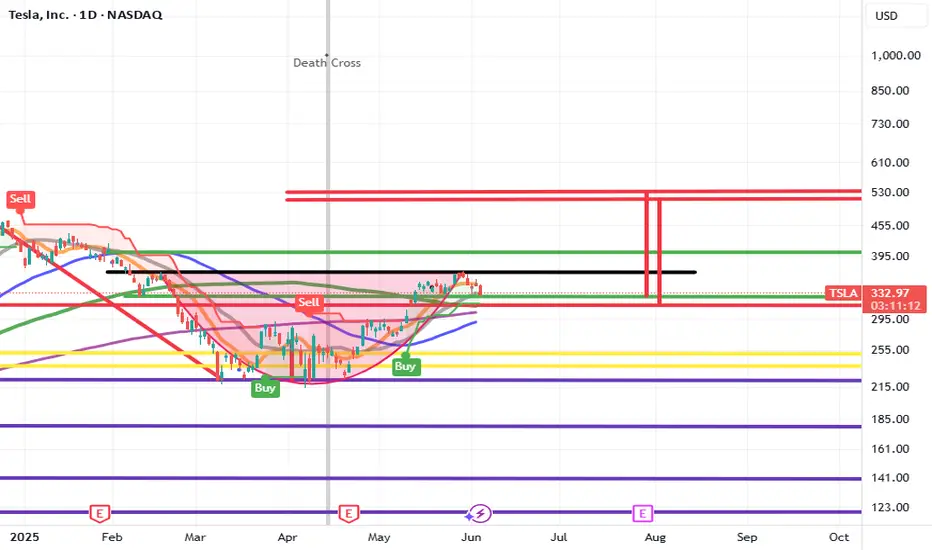
CUP AND HANDLE $TSLA TO $515 MINIMUMThe cup and handle is a bullish chart pattern commonly used by traders to spot potential buying opportunities. It features a rounded "cup" formation followed by a slight downward drift forming the "handle." This pattern typically signals a continuation of an upward trend once the handle completes its consolidation phase.
ROBOTAXI BOOM
BUY NOW NASDAQ:TSLL NASDAQ:TSLA
Harmonic Patterns
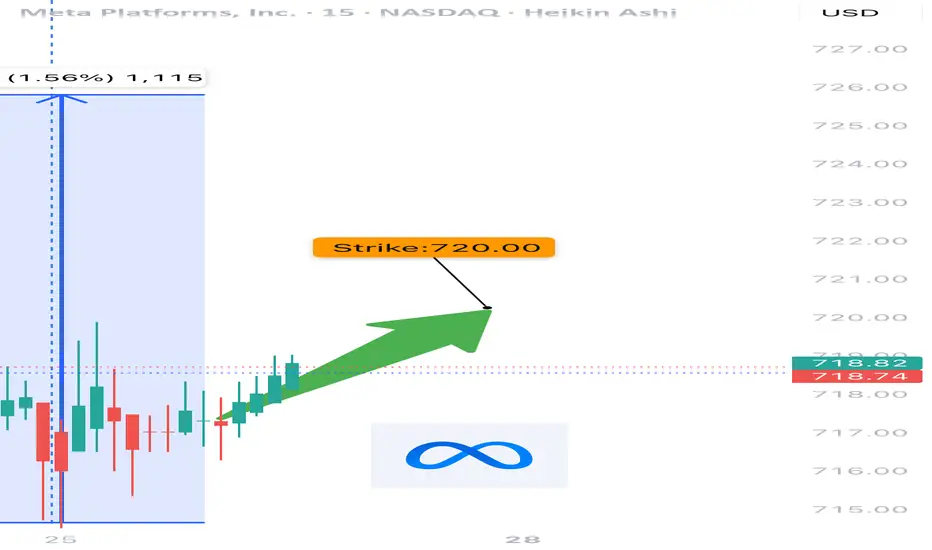
META WEEKLY TRADE SETUP – JULY 25, 2025
📈 META WEEKLY TRADE SETUP – JULY 25, 2025 📈
🔥 Institutional Bulls Are In Control — 3.05 C/P Ratio!
🚨 BUT — It’s 0DTE Friday, so don’t get caught in gamma fire.
⸻
🧠 Model Consensus:
✅ All Models = STRONG BULLISH
⚠️ Entry Timing: Monday preferred (due to gamma + time decay)
📉 Volume still weak = caution on conviction
⸻
🔍 META Flow Stats:
• 🟢 Calls: 65,379
• 🔴 Puts: 21,409
• 📊 C/P Ratio: 3.05 = Institutional bulls stepping in hard
⸻
✅ RECOMMENDED TRADE – PLAN FOR MONDAY
🎯 Instrument: META Call Option
🟢 Strike: $720
📅 Expiry: August 1, 2025
💵 Entry Price: $0.97
💰 Profit Target: $1.45
🛑 Stop Loss: $0.49
⚖️ Confidence: 75%
🕒 Entry Timing: Market open Monday
⸻
⚠️ TRADE NOTES:
• Don’t enter on Friday – too much gamma risk
• Wait for volume confirmation Monday morning
• Expect short-duration swing (hold 3–5 days max)
⸻
📊 Smart money is bullish, timing is everything.
👍 Like & Follow if META is on your radar!
#META #OptionsTrading #0DTE #GammaSqueeze #BullishSetup #TradingView #WeeklyOptions #TechStocks
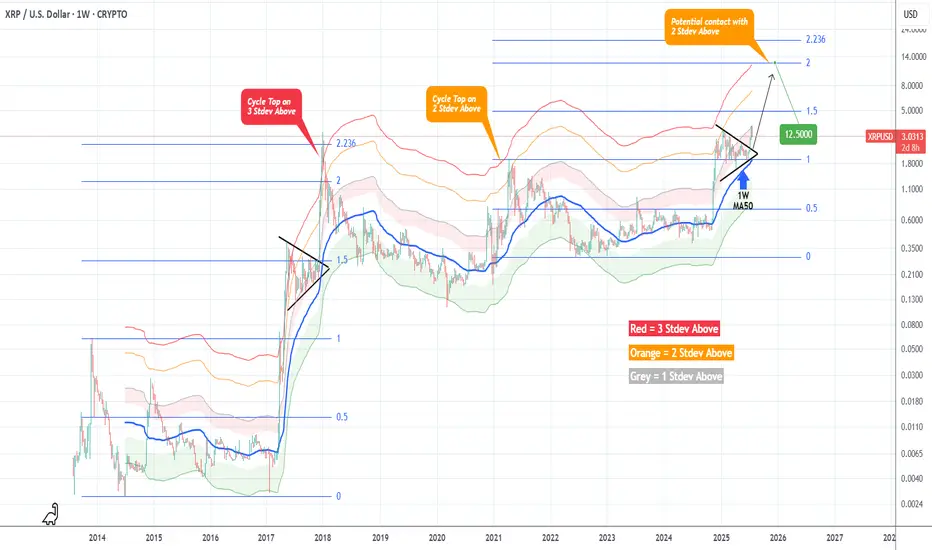
XRPUSD Massive break-out that can Top at $12.500XRP (XRPUSD) got out of its Accumulation Triangle (December 2024 - June 2025) making an aggressive break-out similar to the December 2017 one, which was after an identical Triangle pattern.
The fractals are so comparable that both mostly traded within the 1W MA50 (blue trend-line) and the Mayer Multiple (MM) 2 Stdev Above (orang trend-line).
As you can see, that MM trend-line was where the Top of the previous Cycle (April 2021) was priced and the one before was above the 3 Stdev Above (red trend-line).
Assuming that this Cycle will also go for the 'minimum' 2 Stdev Above test, it can make that contact by the end of the year on the 2.0 Fibonacci extension (Cycle Top-to-bottom) at $12.500.
-------------------------------------------------------------------------------
** Please LIKE 👍, FOLLOW ✅, SHARE 🙌 and COMMENT ✍ if you enjoy this idea! Also share your ideas and charts in the comments section below! This is best way to keep it relevant, support us, keep the content here free and allow the idea to reach as many people as possible. **
-------------------------------------------------------------------------------
💸💸💸💸💸💸
👇 👇 👇 👇 👇 👇
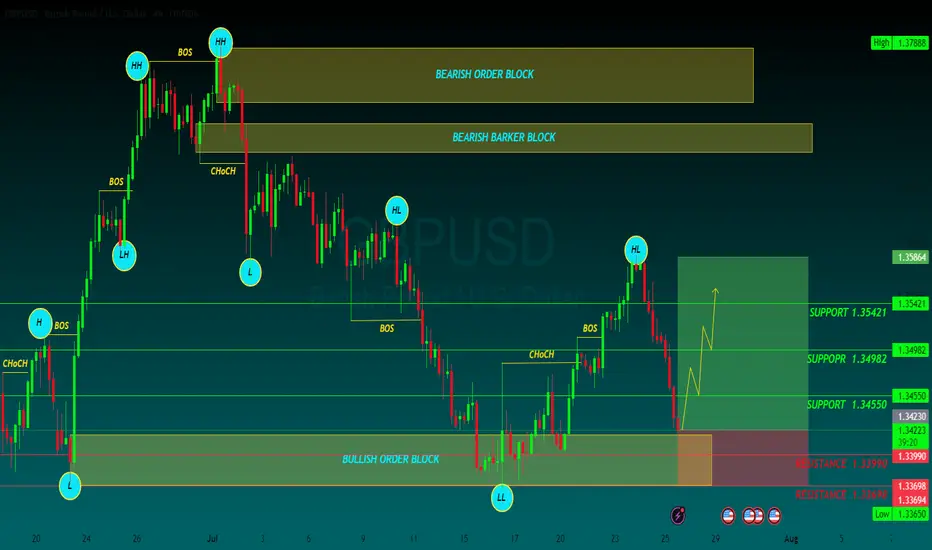
GBPUSD BUYGBP/USD drops to 1.3450 area after weak UK Retail Sales data
GBP/USD continues to push lower after closing in negative territory on Thursday and trades near 1.3450 on Friday. Weaker-than-expected Retail Sales data from the UK and the broad-based US Dollar strength forces the pair to stay on the back foot heading into the weekend
GBP/USD came under bearish pressure on Thursday and lost more than 0.5%, snapping a three-day winning streak in the process. The pair extends its slide on Friday and trades below 1.3500.
The renewed US Dollar (USD) strength weighed on GBP/USD on Thursday. The US Department of Labor reported that the number of first-time applications for unemployment benefits declined to 217,000 in the week ending July 19 from 221,000 in the previous week. This reading came in better than the market expectation of 227,000. Additionally, the S&P Global Composite Purchasing Managers Index (PMI) improved to 54.6 (preliminary) in July from 52.9 in June, reflecting an ongoing expansion in the private sector's business activity, at an accelerating pace.
Meanwhile, the EUR/GBP cross rose more than 0.3% on Thursday as the Euro benefited from the European Central Bank's (ECB) cautious tone on policy-easing. EUR/GBP preserves its bullish momentum and trades at its highest level since early April above 0.8700 on Friday, suggesting that the Euro continues to capture capital outflows out of Pound Sterling.
Early Friday, the UK's Office for National Statistics reported that Retail Sales rose by 0.9% on a monthly basis in June. This reading followed the 2.8% decrease recorded in May but came in worse than the market expectation for an increase of 1.2%, making it difficult for GBP/USD to stage a rebound.
In the second half of the day, Durable Goods Orders data for June will be the only data featured in the US economic calendar. Nevertheless, this data is unlikely to have a long-lasting impact on the USD's valuation.
SUPPORT 1.34550
SUPPORT 1.34982
SUPPORT 1.35421
RESISTANCE 1.33990
RESISTANCE 1.33698
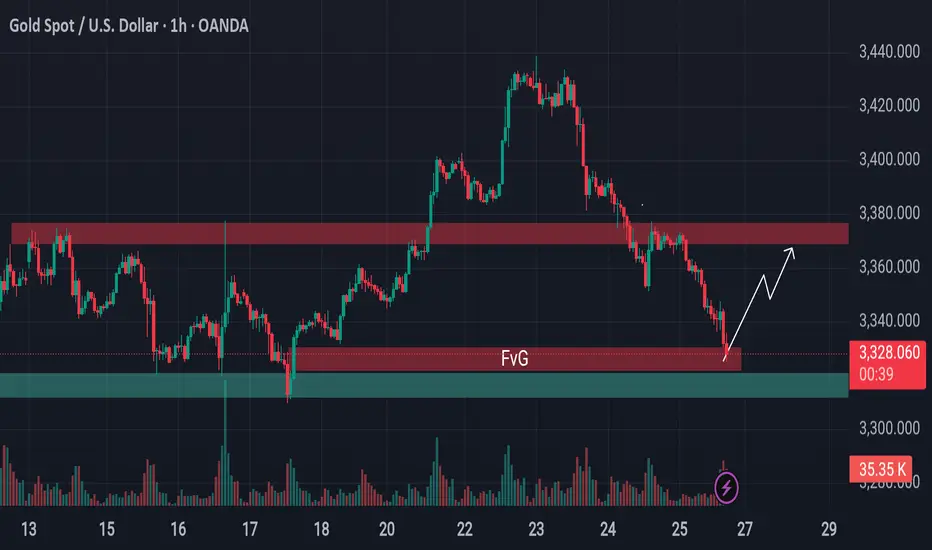
From Breakdown to Breakout? Gold Eyes Support Based Reversal!Gold is approaching a critical support area.
Previously, the price was holding above a key support level, but that zone has now been breached and is likely to act as resistance going forward. However, just beneath the current price, there's a well-established support level still intact—reinforced further by the presence of a bullish Fair Value Gap (FVG).
This setup hints at a possible reversal or a short-term surge from this zone. If market conditions align, gold may stage a pump from here. Keep this level on your radar—it could turn into a decisive point for price direction.
🛡 Always conduct your own analysis before taking any trades. DYOR.
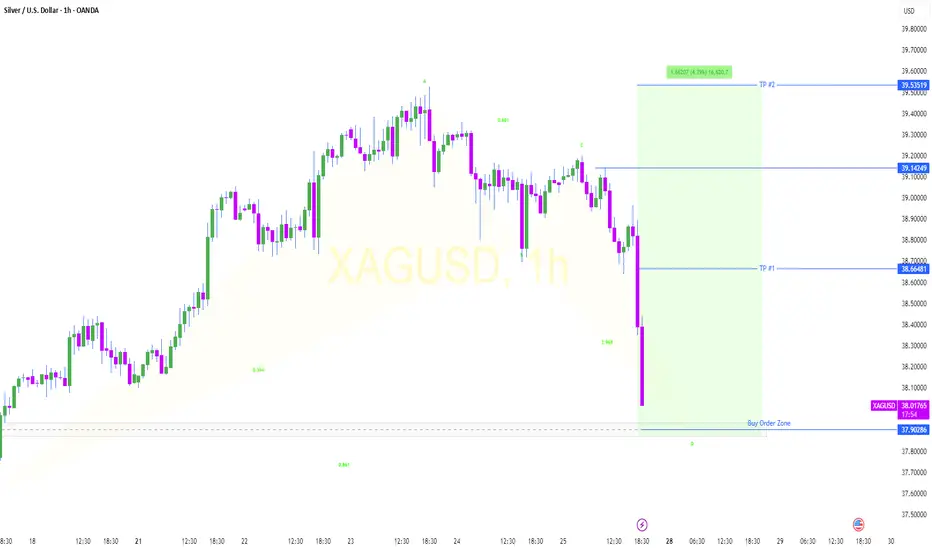
XAG longXAG prices may rise from $37.9, located at the FVG Zone and Leg of BAT Pattern , towards the targets .
USDJPY SELLUSD/JPY rises further and approaches 148.00 as the US Dollar firms up
The US Dollar rallies for the second consecutive day against the Yen, and approaches 148.00. Strong US data support the Fed's "wait and see" stance and underpin demand for the US Dollar. In Japan, the uncertain political context is likely to deter the BoJ from hiking interest rates further.
Previous market optimism is turning into caution as the market shifts its focus to the monetary policy reports by the Bank of Japan and the US Federal Reserve due next week.
The Fed is widely expected to leave interest rates unchanged next week, more so after the strong US business activity and Jobless Claims figures released on Thursday. These data confirmed that the US economy remains resilient with a healthy labour market, which gives further leeway for the Fed to await further insight into the impact of tariffs before resuming rate cuts. The US Dollar has been trading higher following Thursday’s releases.
Also on Thursday, US President Trump paid an unusual visit to the Federal Reserve, only a few days ahead of their monetary policy meeting. Trump complained about the overcosts of the headquarters’ renovation and pressed for a less restrictive monetary policy, but his unusually soft comments after the visit eased investors’ concerns about the previous attacks on the central bank's independence.
In Japan, the somewhat softer Tokyo inflation figures seen on Friday and the trade deal would help the BoJ to continue hiking interest rates, but the bank is likely to stand pat next week and probably delay further monetary tightening until the political situation clarifies. This is likely to keep the Yen upside attempts subdued in the near-term.
SUPPORT 147.642
SUPPORT 147.311
SUPPORT 146.854
RESISTANCE 148.206
RESISTANCE 147.972

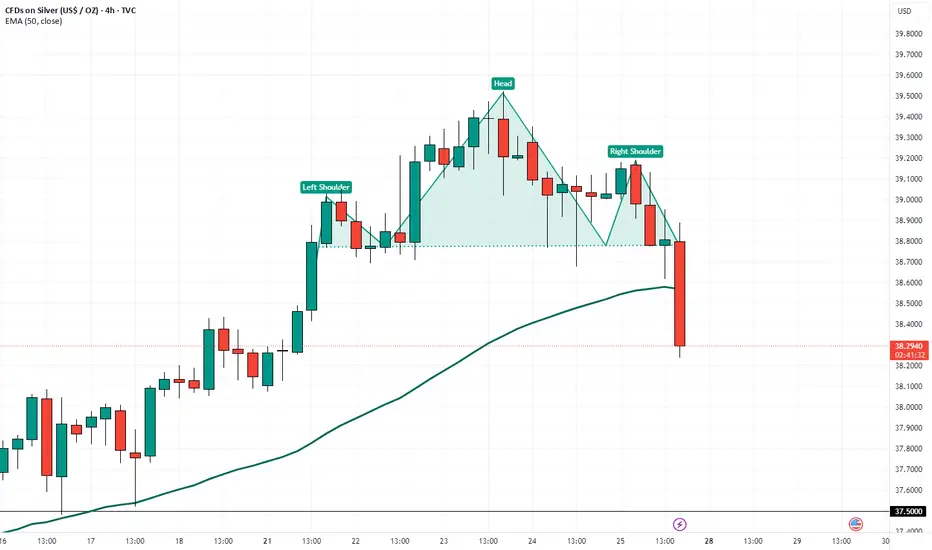
Head & Shoulders Pattern Confirmed bearish sign A clear Head and Shoulders pattern has formed on the 4H timeframe, and confirmation is in place after a decisive break below the neckline around $39.00.
🔍 Technical Breakdown:
Left Shoulder: Formed around July 11–15
Head: July 19–23 peak
Right Shoulder: Developing through July 24–25
Neckline: ~$39.00 zone (now broken)
Current Price: ~$38.30
Target: ~$38.00 – $37.80 (based on pattern projection)
The break below the 50 EMA adds bearish confirmation. Caution is advised unless price reclaims the neckline level.
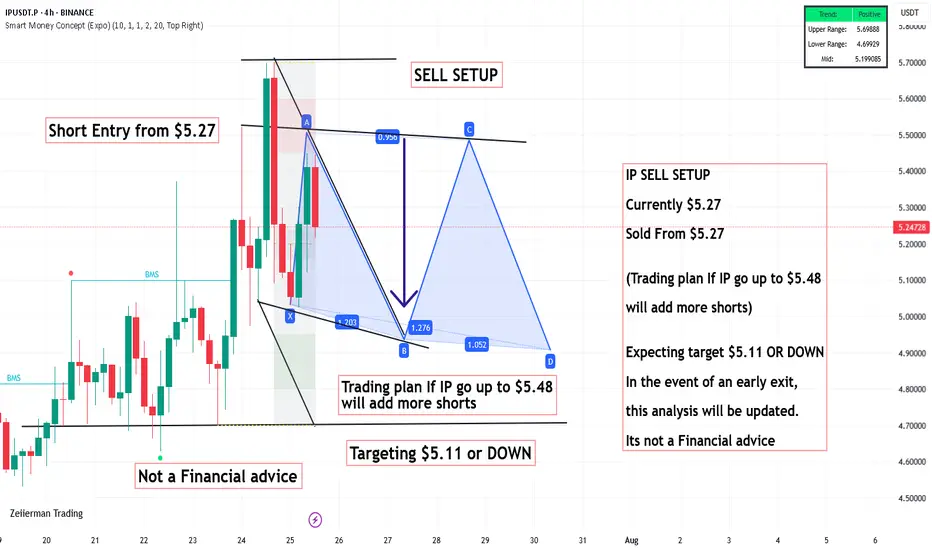
IP SELL SETUP ,Sold From $5.27IP SELL SETUP
Currently $5.27
Sold From $5.27
(Trading plan If IP go up to $5.48
will add more shorts)
Expecting target $5.11 OR DOWN
In the event of an early exit,
this analysis will be updated.
Its not a Financial advice
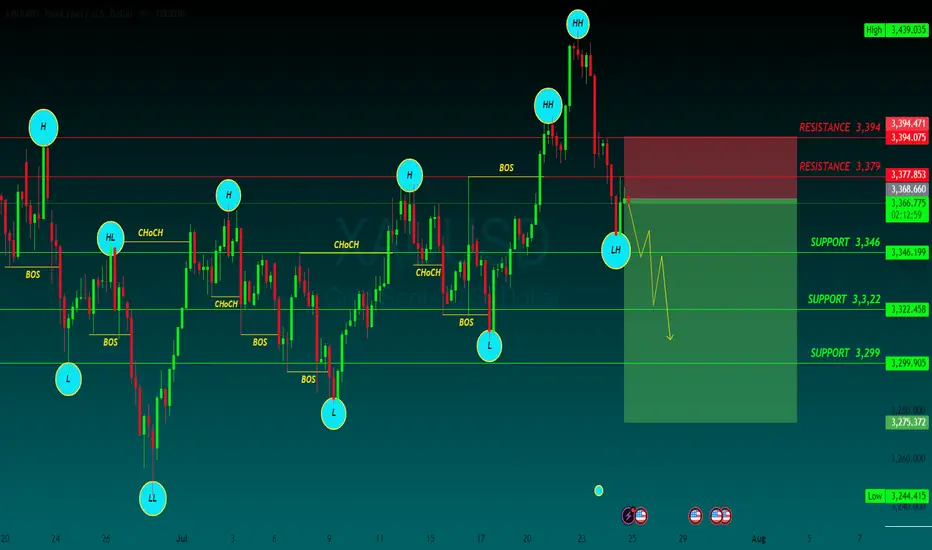
GOLD SELLGold price bears retain control amid fading safe-haven demand, rebounding USD
US President Donald Trump announced late Tuesday that his administration had reached a trade deal with Japan. Furthermore, reports that the US and the European Union are heading towards a 15% trade deal boost investors' confidence and weigh on the safe-haven Gold price for the second straight day on Thursday.
The markets do not expect an interest rate cut from the US Federal Reserve in July despite Trump's continuous push for lower borrowing costs. In fact, Trump has been attacking Fed Chair Jerome Powell personally over his stance on holding rates and repeatedly calling for the central bank chief's resignation.
Moreover, Fed Governor Chris Waller and Trump appointee Vice Chair for Supervision Michelle Bowman have advocated a rate reduction as soon as the next policy meeting on July 30. This keeps the US Dollar depressed near a two-and-a-half-week low and could offer some support to the non-yielding yellow metal.
Traders now look forward to the release of flash PMIs, which would provide a fresh insight into the global economic health and influence the safe-haven commodity. Apart from this, the crucial European Central Bank policy decision might infuse some volatility in the markets and drive the XAU/USD pair.
Meanwhile, the US economic docket features Weekly Initial Jobless Claims and New Home Sales data, which, in turn, would drive the USD and contribute to producing short-term trading opportunities around the commodity. Nevertheless, the fundamental backdrop warrants caution for aggressive traders.
SUPPORT 3,346
SUPPORT 3,322
SUPPORT 3,399
RESISTANCE 3,394
RESISTANCE 3,379
Placing a buy stop here could be reasonable.Because of the consolidation and the trend behind it, it seems reasonable to place a buy stop so we don’t miss out in case of a sharp move.

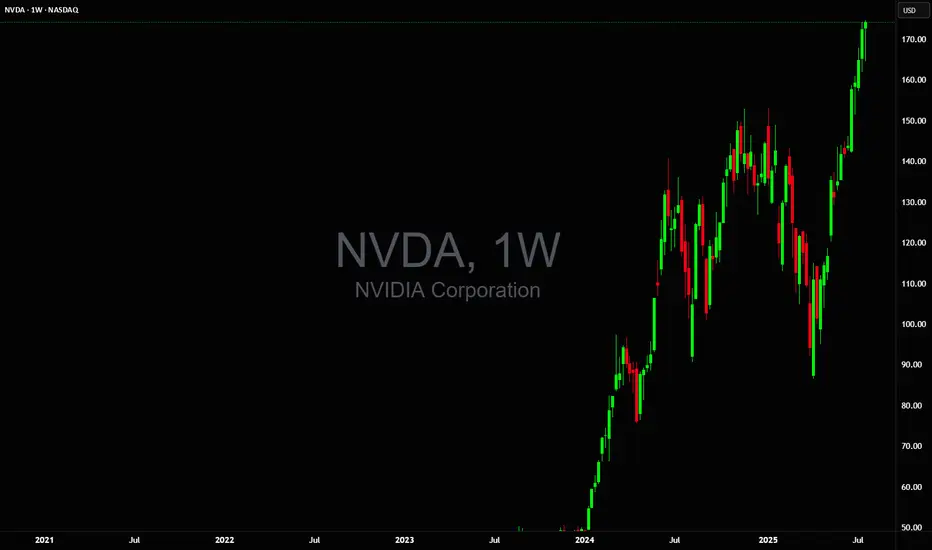
99% of people buying $NVDA don't understand this:🚨99% of people buying NASDAQ:NVDA don't understand this:
NASDAQ:GOOGL : “We’re boosting AI capex by $10B.”
Wall Street: “Cool, that’s like $1B or 0.06 per share for $NVDA.”
So from $170.50 at the time of news to $170.56 right?
No.
NASDAQ:NVDA trades at 98× earnings. So that $0.06? Turns into $6.00
Why?
Because people are expecting that to be happening every single year for 98 years and they're paying All of it Today in Full amount.
So NASDAQ:NVDA will get $1B more per year. But NASDAQ:NVDA price per share already increased by $100B in past 2 days 😂
Then it crashes 40% and everyone is wondering why.
GOLD BULLISHHello,
Here's the gold analysis:
Gold will have started an upward trend with a good probability of 80%.

link buy midterm"🌟 Welcome to Golden Candle! 🌟
We're a team of 📈 passionate traders 📉 who love sharing our 🔍 technical analysis insights 🔎 with the TradingView community. 🌎
Our goal is to provide 💡 valuable perspectives 💡 on market trends and patterns, but 🚫 please note that our analyses are not intended as buy or sell recommendations. 🚫
Instead, they reflect our own 💭 personal attitudes and thoughts. 💭
Follow along and 📚 learn 📚 from our analyses! 📊💡"

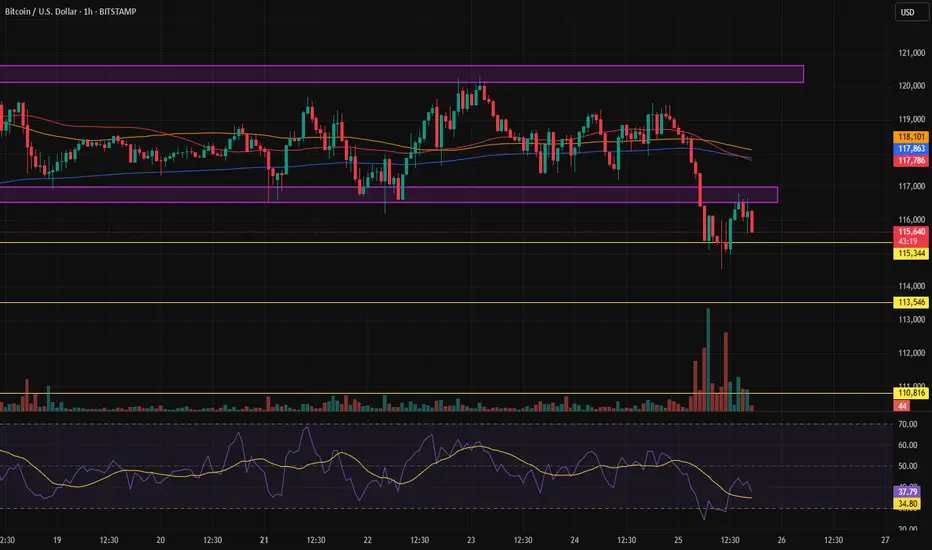
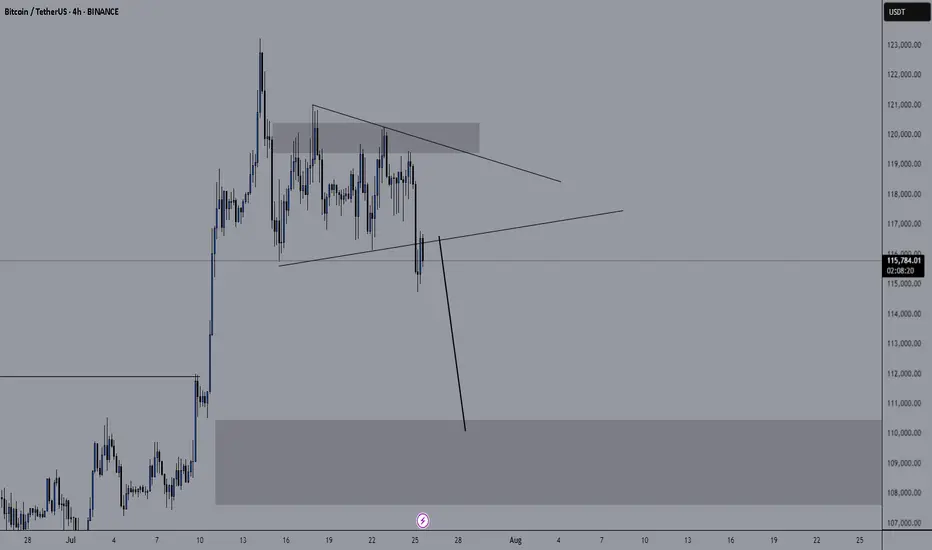
The sell trigger for Bitcoin is being activated.After breaking out of the channel and pulling back to the lower boundary (previous support) of the channel, we expect the price to decline.
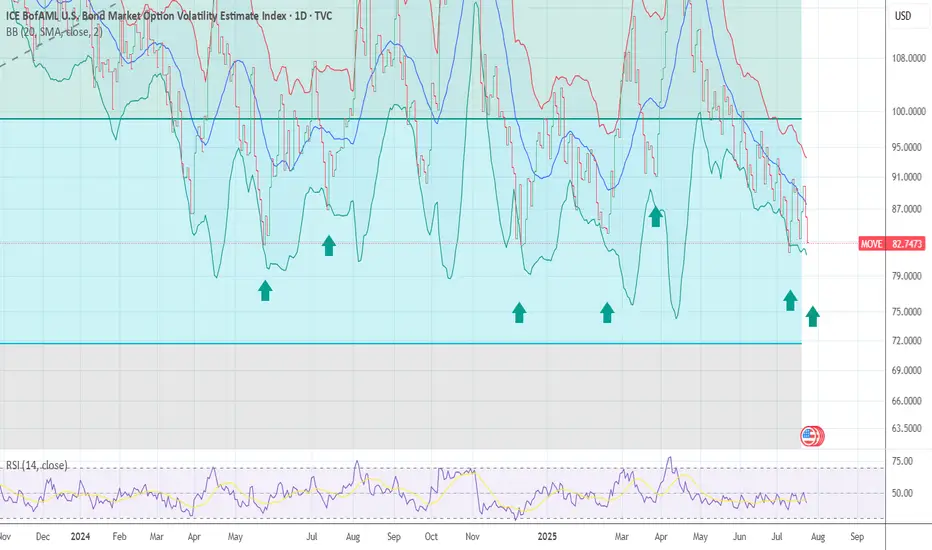
Debt markets at a point of complacency see green arrowsJunk bonds are at a dangerous level now of complacency. I would buy TLT sell HYG
Consider a sales transaction.Hello friends
You can open a sell trade on the 4-hour time frame, but this is a risky trade.
You can open a trade with half a percent risk.
On the higher time frame, the trend is still up.
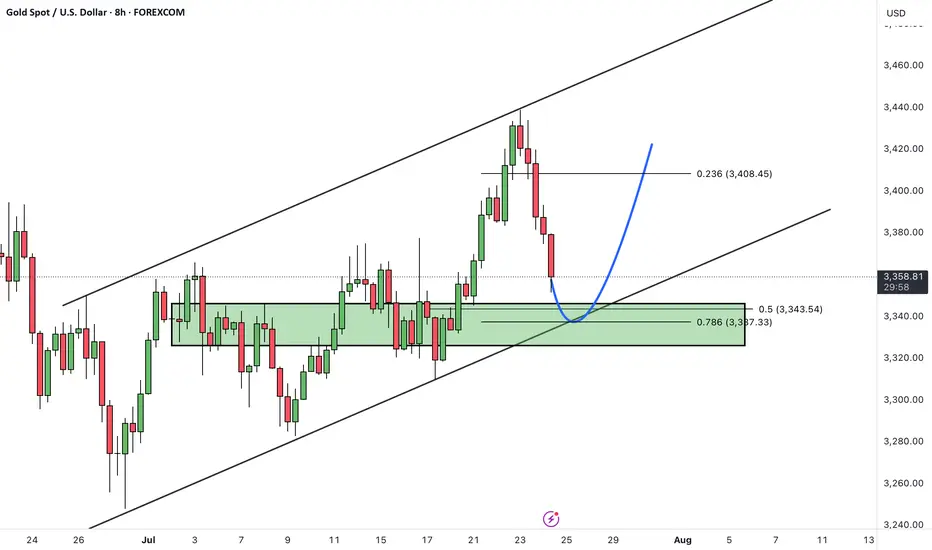
XAUUSDHello Traders! 👋
What are your thoughts on GOLD?
Gold entered a corrective phase after reaching the top of its ascending channel. Price is now approaching the channel bottom, which coincides with a key support zone.
As long as the channel support holds, we expect a bullish reaction from this area, potentially driving price back toward the next target level.
The uptrend remains valid as long as price does not break and close below the lower boundary of the channel.
A rebound from channel support may signal the start of the next upward leg.
Invalidation occurs only if price breaks and holds below the channel.
💡 Will gold bounce from channel support and resume its rally? Share your view in the comments! 🤔👇
Don’t forget to like and share your thoughts in the comments! ❤️
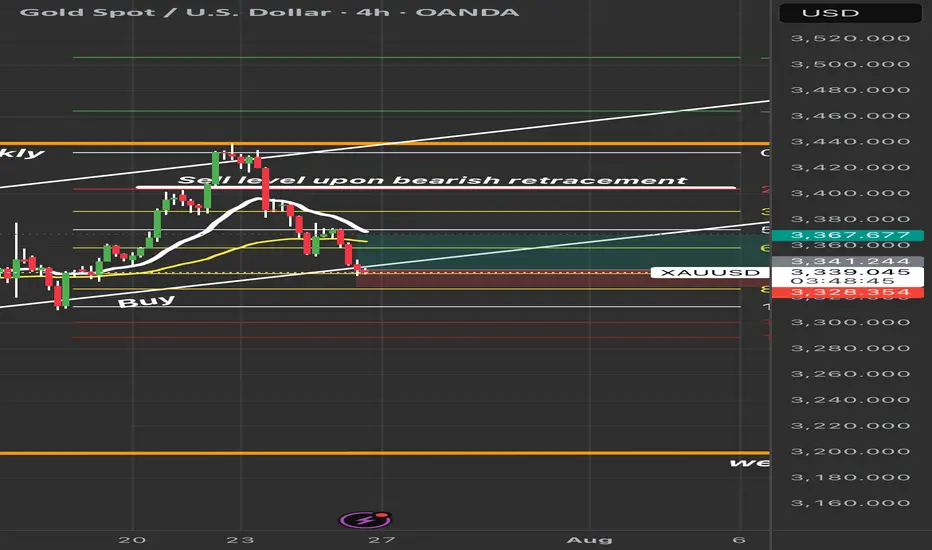
Gold testing SIGNIFICANT DAILY TRENDLINEGold is testing a key ascending trendline support around 3,340. If price holds this level, we could see a strong bullish reaction targeting 3,367 and potentially 3,400+. A break below 3,328 invalidates this setup.”
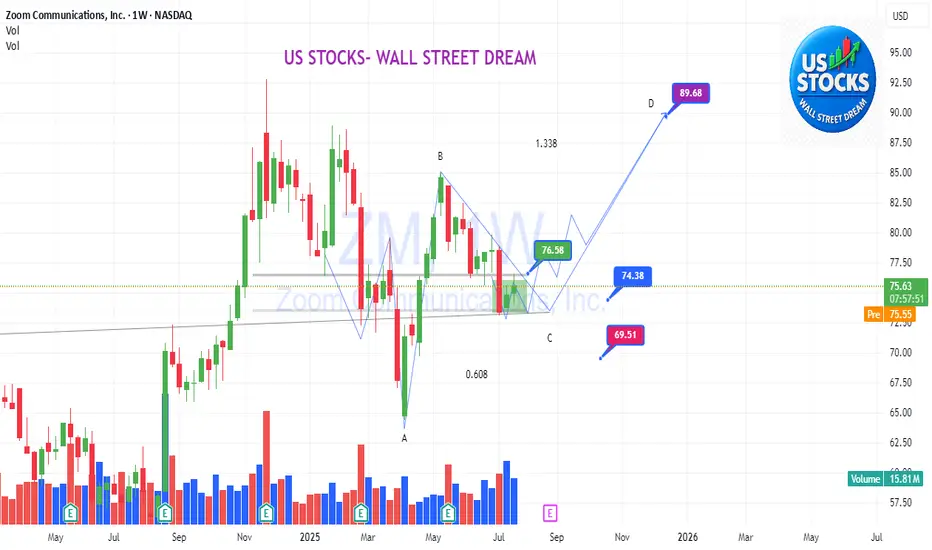
ZM: Right timing to enter the plan?Do you know the right timing to enter the plan?
.
Beautiful quasimodo accummulation pattern.
ACBD pattern.
Keep watching and timing when ZM will run?
.
US STOCKS- WALL STREET DREAM- LET' S THE MARKET SPEAK!
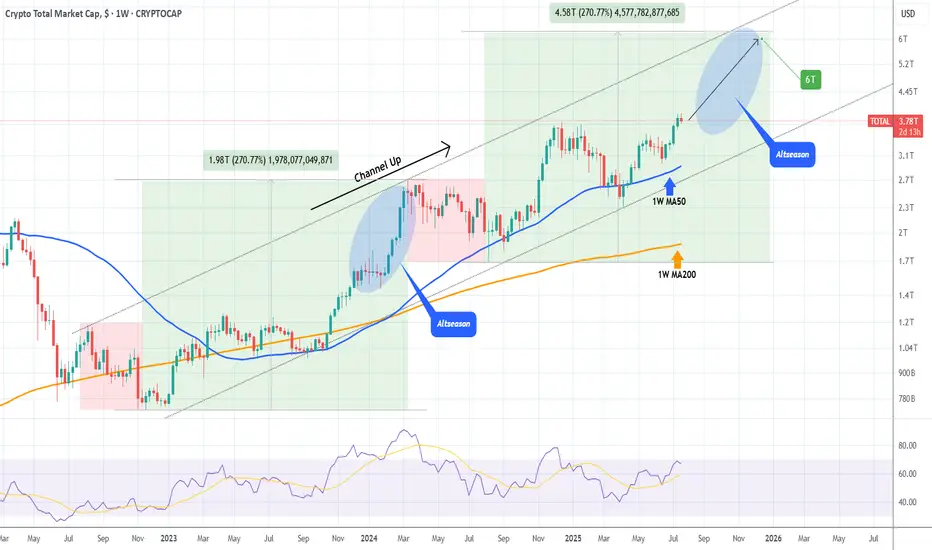
TOTAL CRYPTO MARKET CAP expected to hit $6 Trillion!The Crypto Total Market Cap (TOTAL) has been on a Channel Up since the 2022 market bottom and since the April 07 2025 Low (Higher Low for the pattern), it's initiated the new Bullish Leg, already turning the 1W MA50 (blue trend-line) into Support.
As long as this holds, we expect it to complete a +270% rise from the August 05 2024 Low, similar to the Bull Cycle's first Green Phase, and reach at least a $6 Trillion Market Cap!
More importantly, we expect this final part (blue ellipse) to be what is commonly known as an Altseason, where the lower cap coins show much higher returns and disproportionate gains to e.g. Bitcoin.
-------------------------------------------------------------------------------
** Please LIKE 👍, FOLLOW ✅, SHARE 🙌 and COMMENT ✍ if you enjoy this idea! Also share your ideas and charts in the comments section below! This is best way to keep it relevant, support us, keep the content here free and allow the idea to reach as many people as possible. **
-------------------------------------------------------------------------------
💸💸💸💸💸💸
👇 👇 👇 👇 👇 👇
SP500 & Nasdaq Daily Trade SetupsIn this update we review the recent price action in the E-mini SP500 & Nasdaq futures contracts and identify the next high-probability trade setups and price objectives to target. To review today's video analysis, click here!

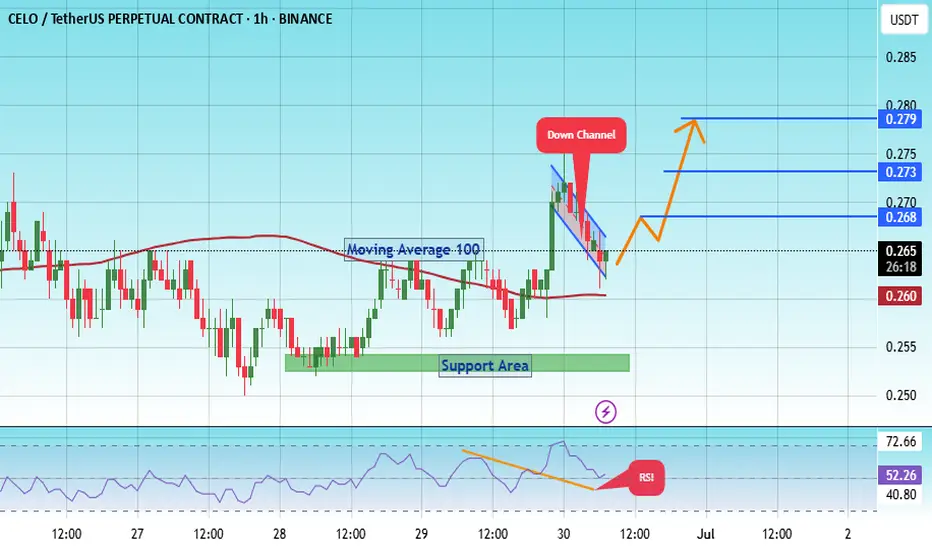
#Celo coin market structure analysis#CELO
The price is moving within a descending channel on the 1-hour frame, adhering well to it, and is on its way to breaking it strongly upwards and retesting it.
We have a bounce from the lower boundary of the descending channel. This support is at 0.262.
We have a downtrend on the RSI indicator that is about to break and retest, supporting the upside.
There is a major support area in green at 0.253, which represents a strong basis for the upside.
Don't forget a simple thing: ease and capital.
When you reach the first target, save some money and then change your stop-loss order to an entry order.
For inquiries, please leave a comment.
We have a trend to hold above the 100 Moving Average.
Entry price: 0.265
First target: 0.268
Second target: 0.273
Third target: 0.279
Don't forget a simple thing: ease and capital.
When you reach your first target, save some money and then change your stop-loss order to an entry order.
For inquiries, please leave a comment.
Thank you.