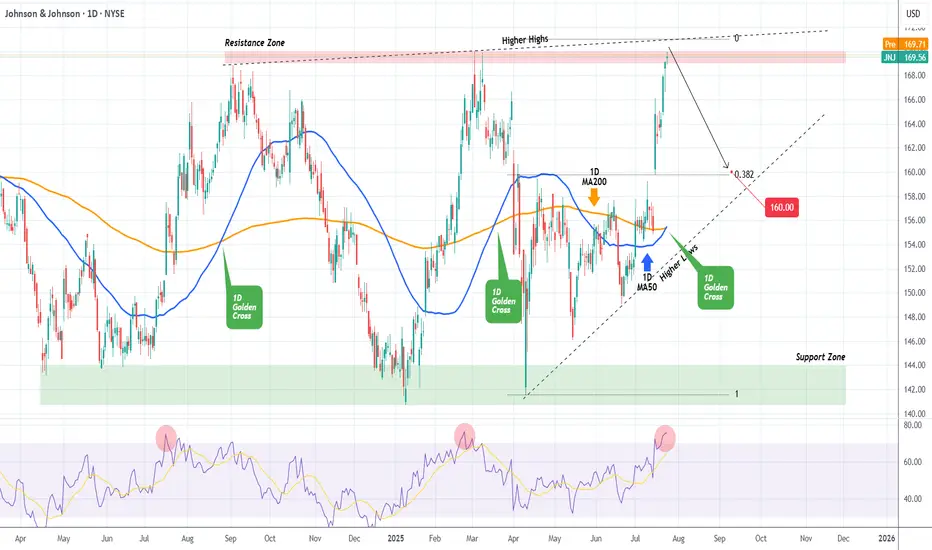
JOHNSON & JOHNSON Sell opportunity on a Double Resistance.It's been 9 months (October 11 2024, see chart below) since our last Johnson & Johnson (JNJ) analysis, where we gave a very timely sell signal that surgically hit our $141.00 Target:
The Channel Down has since broke to the upside and a new Higher Lows structure has emerged but with a clear Resistance Zone for the time being. At the same time, the price is also just below the Higher Highs trend-line that started on the September 04 2024 High.
With the 1D RSI overbought (same as on February 25 2025), we don't give the upside much room to go, so we turn bearish here, targeting the 0.382 Fibonacci extension and Higher Lows trend-line at $160.00.
-------------------------------------------------------------------------------
** Please LIKE 👍, FOLLOW ✅, SHARE 🙌 and COMMENT ✍ if you enjoy this idea! Also share your ideas and charts in the comments section below! This is best way to keep it relevant, support us, keep the content here free and allow the idea to reach as many people as possible. **
-------------------------------------------------------------------------------
💸💸💸💸💸💸
👇 👇 👇 👇 👇 👇
Harmonic Patterns
#DOGE/USDT falling wedge#DOGE
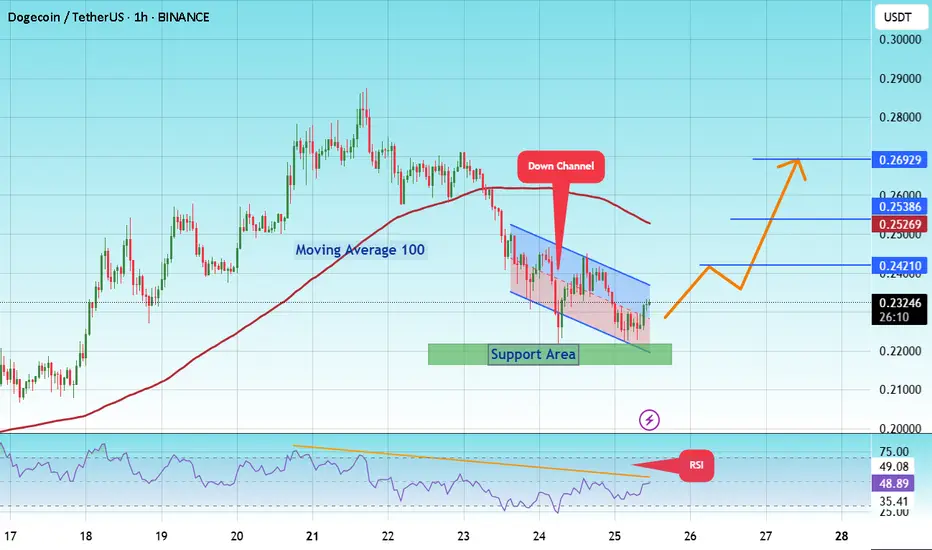
The price is moving within a descending channel on the 1-hour frame and is expected to break and continue upward.
We have a trend to stabilize above the 100 Moving Average once again.
We have a bearish trend on the RSI indicator, supporting the upward break.
We have a support area at the lower boundary of the channel at 0.22270, acting as strong support from which the price can rebound.
We have a major support area in green that pushed the price upward at 0.21777.
Entry price: 0.2320
First target: 0.24210
Second target: 0.25380
Third target: 0.26920
To manage risk, don't forget stop loss and capital management.
When you reach the first target, save some profits and then change the stop order to an entry order.
For inquiries, please comment.
Thank you.
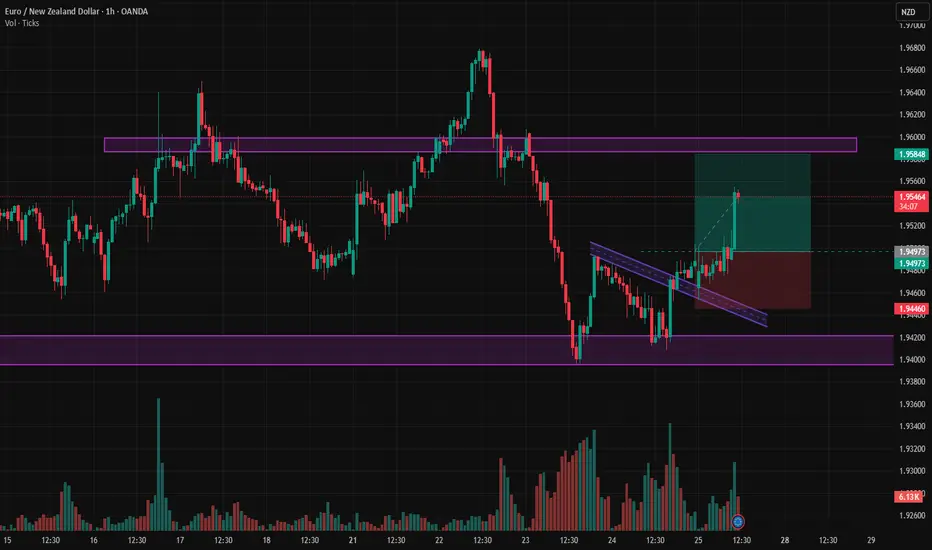
EUROUSDShort Position of EuroUsd
Total 0.5% risk of my total Portfolio
All the things mention with Sl
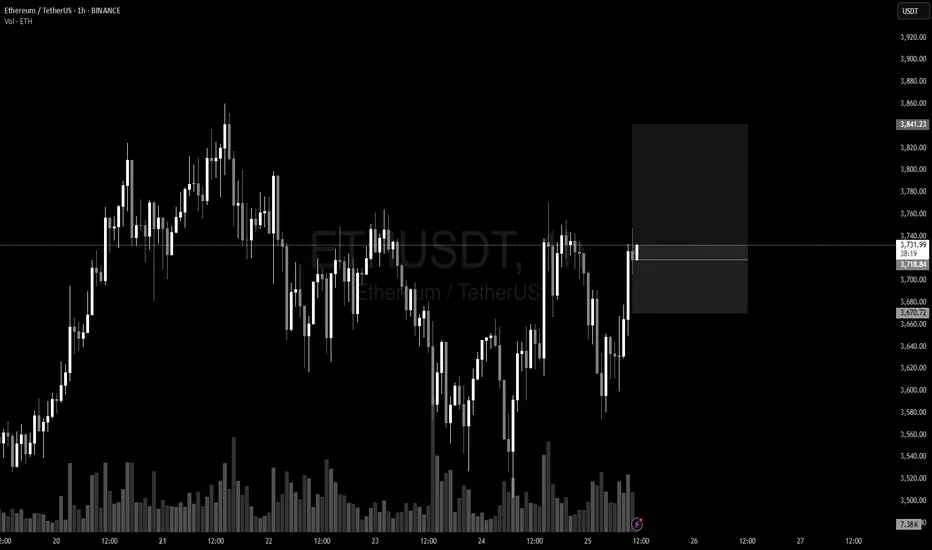
Close to breaking out of the range.After nearly 31 days, a consolidation has formed within the range, which could signal either a buy or sell opportunity.
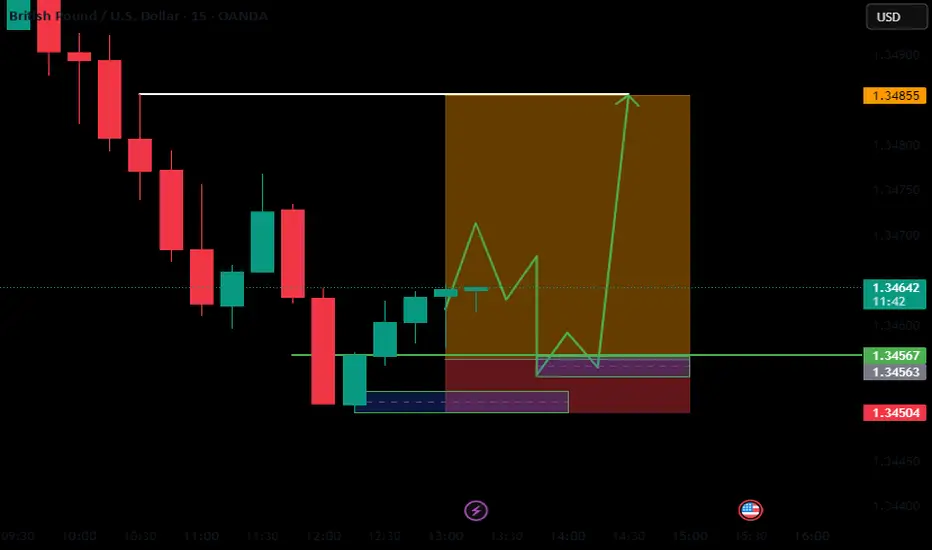
gbpusdwe have active order block on gbpusd and we will wait for confirmation entry dont open position until i active it manually
OANDA:GBPUSD
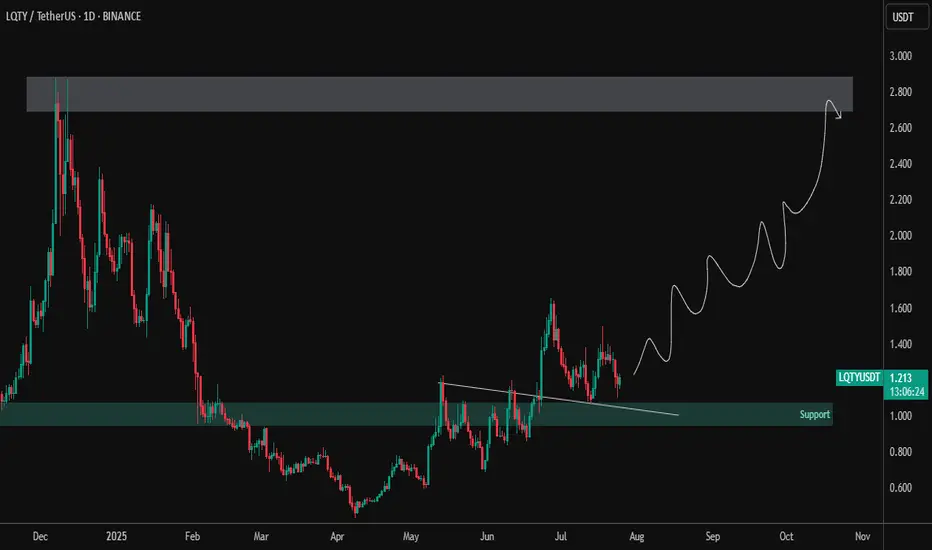
LQTY – Accumulation Completed | Preparing for Trend ReversalLQTY has broken out from a descending structure and reclaimed the key support zone around $1.00–$1.10, showing early signs of accumulation and bullish strength. Currently forming a higher low structure, suggesting a potential long-term uptrend is brewing.
🔹 Technical Highlights:
✅ Clean breakout from descending trendline
✅ Retest of breakout zone holding as support (~$1.10)
🔼 Price printing bullish higher lows on the daily timeframe
🎯 Target zone: $2.70–$2.90 (major resistance from previous highs)
📌 Technical View:
Strong structural base forming
Pullbacks into support area could offer high R/R entries
Break above $1.50 may ignite bullish continuation toward the upper target zone
LQTY appears to be transitioning from accumulation to markup phase. Monitor price action and volume for confirmation of the next leg.
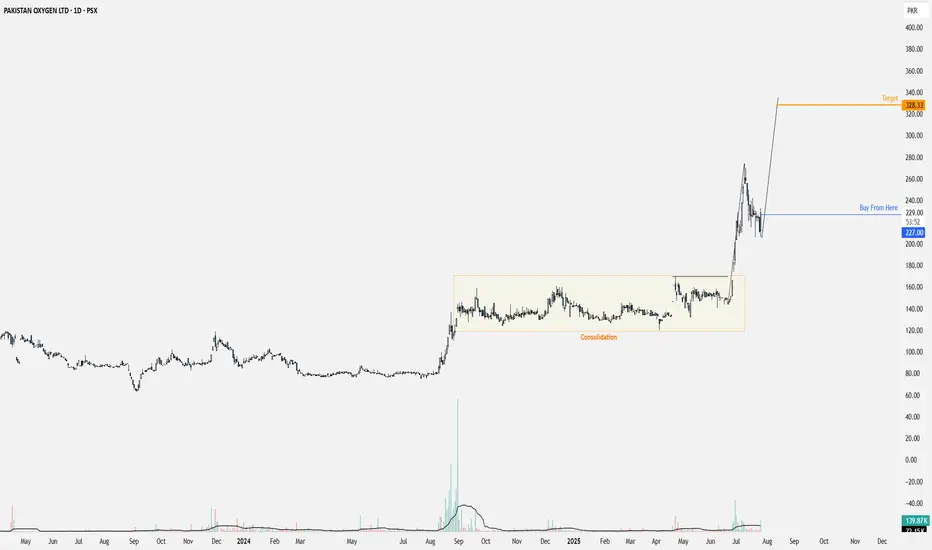
PAKOXY is forming ABCD PatternAfter the longest consolidation, PAKOXY has given a breakout and is now forming an ABCD Pattern.
Handsome ROI.
Bearish Channel Development and Key Support Zone Test1. Technical Overview (15m timeframe):
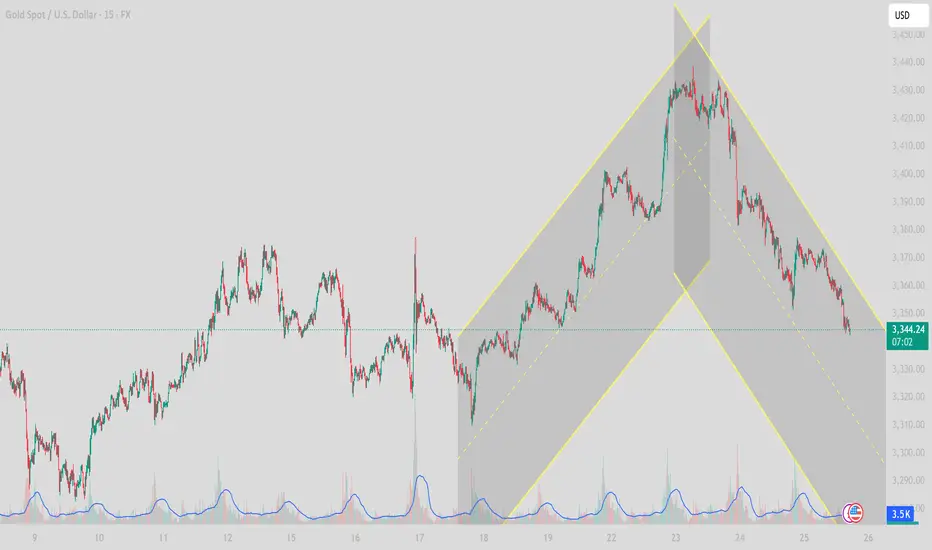
Gold (XAUUSD) is currently trading around 3,342.80, showing signs of continued downward momentum after forming a bearish reversal pattern from the 3,404–3,410 USD resistance area. The price action has now developed into a clear descending channel, with lower highs and lower lows forming in a structured manner.
2. Key Price Levels to Watch:
Immediate Support Zone:
🔹 3,335 – 3,330 USD – This zone aligns with previous structure and the lower bound of the descending channel. A break below this area could accelerate selling pressure toward deeper Fibonacci zones.
Next Major Support (Medium-term):
🔹 3,310 USD – A critical zone where price reacted strongly during the last pullback. A breakdown here would shift sentiment fully bearish in the short-term.
Resistance Levels:
🔹 3,358 – 3,360 USD: Minor intraday resistance near the upper bound of the descending channel.
🔹 3,375 USD: EMA21 and previous structure level.
🔹 3,404 – 3,410 USD: Major confluence resistance from recent highs.
3. Price Action and Indicators:
Descending Channel: Price is respecting the upper and lower trendlines of the bearish channel. No bullish breakout signal confirmed.
Volume: Decreasing on the bounce, rising on the decline – a bearish volume structure.
RSI: Near oversold (not shown, but implied from price exhaustion), could suggest a bounce, but no divergence confirmation yet.
EMA Trend: EMA21 and EMA50 (not shown but assumed from price slope) are likely crossing downward on higher timeframes, reinforcing bearish pressure.
4. Strategy Suggestion – Scenarios for Intraday Traders:
🔻 Scenario A – Continuation Short (Sell on Retracement)
Entry: Around 3,358–3,360 (upper bound of descending channel).
SL: Above 3,365.
TP1: 3,335
TP2: 3,310
Confirmation: Look for bearish engulfing or pin bar rejections on the 5m–15m timeframe.
🔺 Scenario B – Countertrend Long (Bounce from Channel Base)
Entry: Near 3,330–3,335 (support zone).
SL: Below 3,325.
TP1: 3,350
TP2: 3,360
Note: This is a riskier trade and should only be taken with bullish reversal confirmation (hammer, bullish divergence on RSI, or break of structure on LTF).
5. Summary:
Gold is currently in a short-term bearish correction, respecting a well-defined descending channel. Price is approaching a critical support zone (3,330–3,335), where a potential intraday bounce may occur, but trend remains bearish unless a clear break
Fakeout or pullback?In my opinion, even though the trend is bullish, short positions are easier to take right now. That’s because on the way up, the price keeps hitting the EMAs, which makes upward movement harder — but on the way down, there’s nothing in its path.
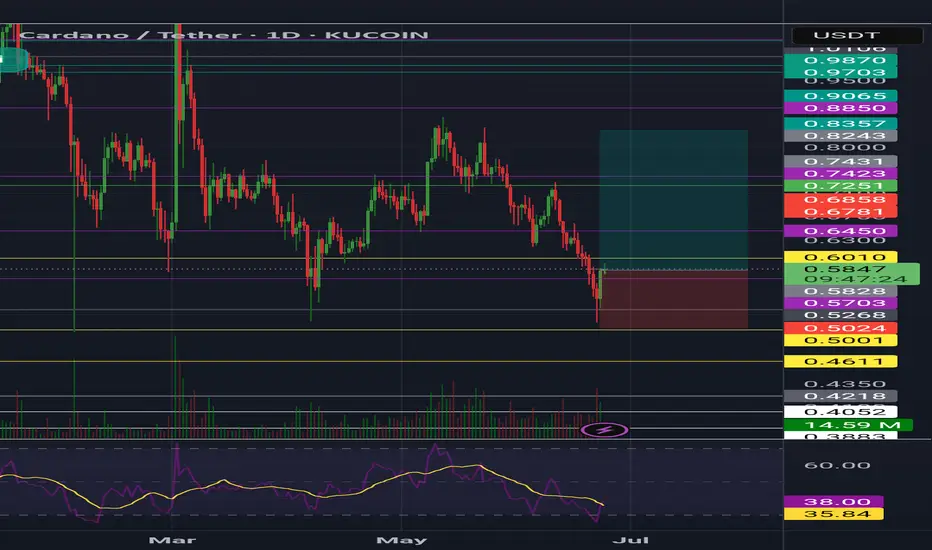
CardanoAda usdt Daily analysis
Time frame daily
Risk rewards ratio >3 👈👌
Double bottom pattern has been created
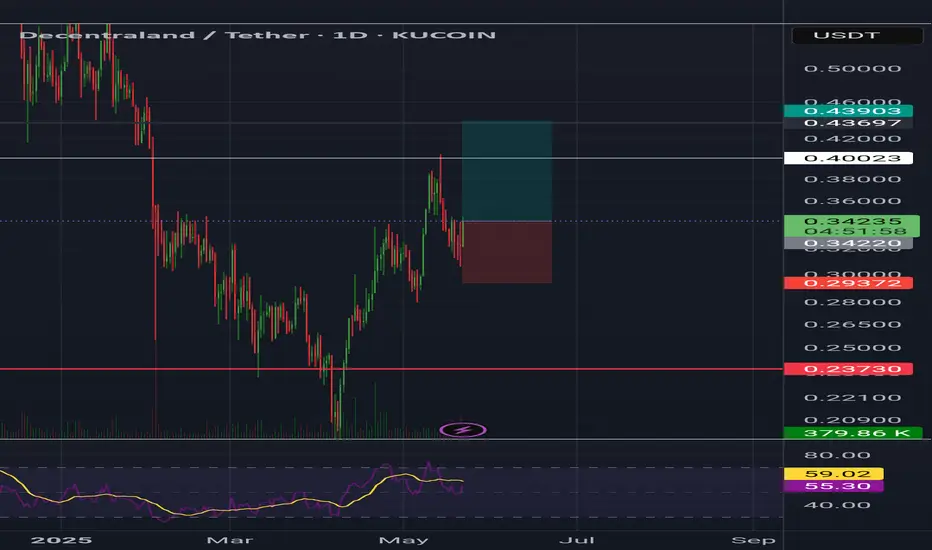
ManaDecentraland token
Mana usdt Daily analysis
Time frame daily
Risk rewards ratio =2 👈👌
Target = 0439 $
0.44$ - 0.46$ is strong resistance for mana
If price can break this resistance it will go to 0.6$
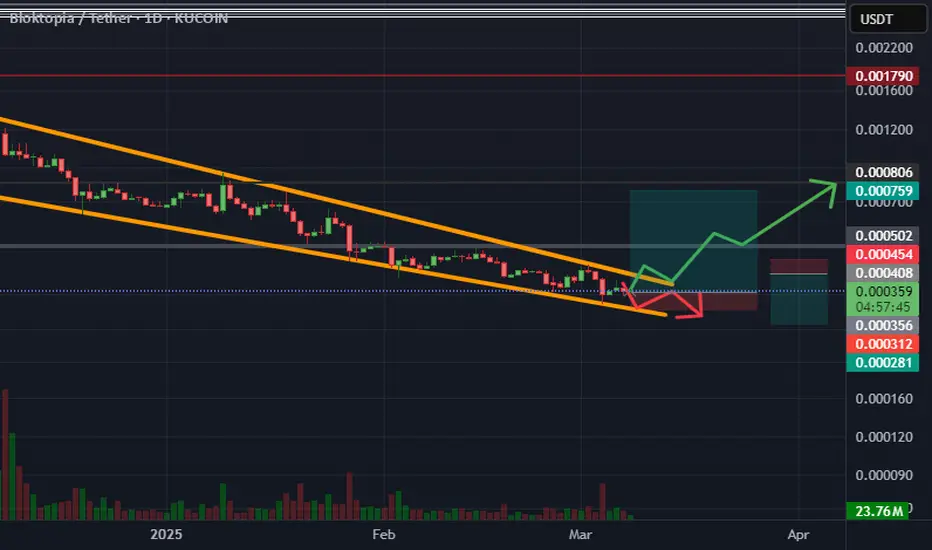
Blokblok usdt daily analyses
time frame daily
long position risk of ratio >9
target 0.00075$
if price breaks the upper line my long position will start. duration of this forecast is long
if it cannot break and move between orange lines my short position will be active. this duration is short
short position risk of ratio >2
target 0.00027$
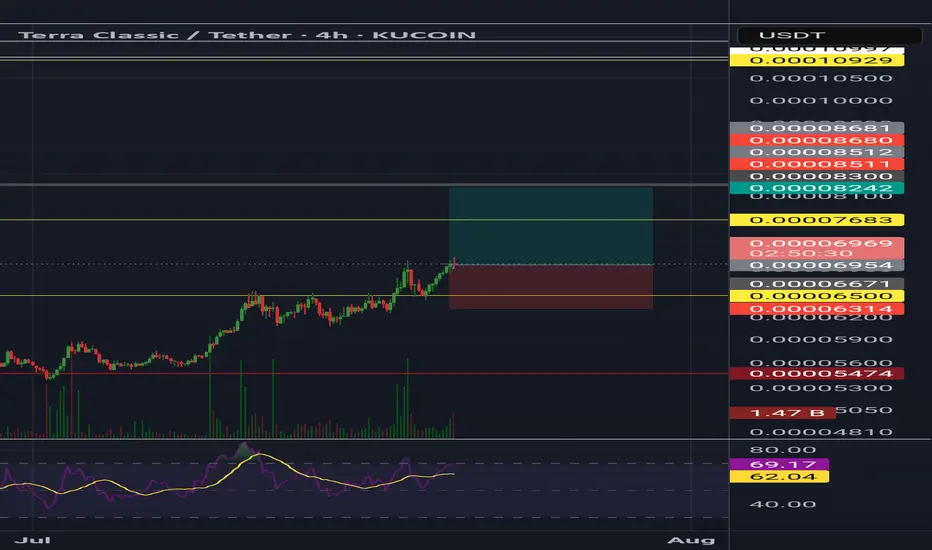
Terra classic Lunc usdt Daily analysis
Time frame 4hours
Risk rewards ratio =2 👈
Target = 0.000083 $
Double benefit in short time is good for traders
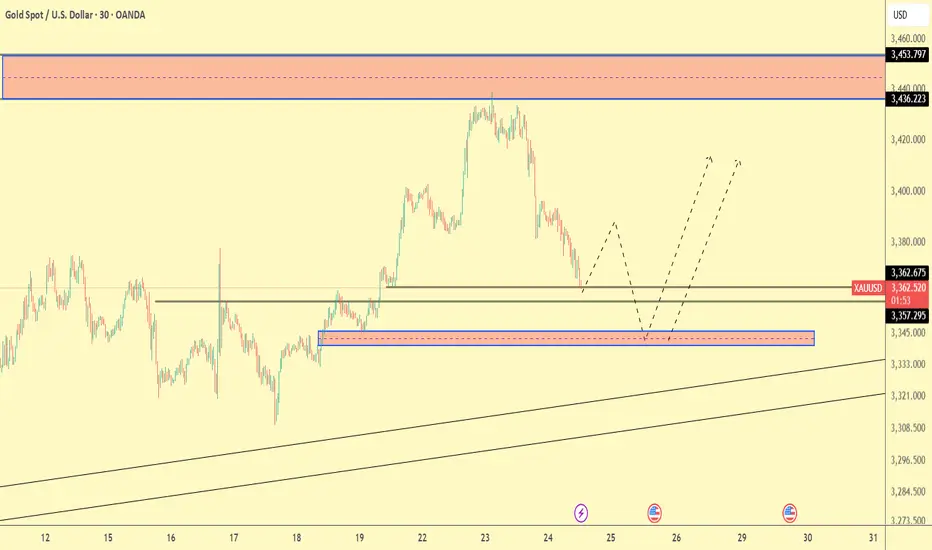
Gold Trade Plan 24/07/2025Dear Traders,
The price is currently near the demand zone in the range of 3358-3362. If the price holds above the support line, it could rise towards the 3388-3390 zone and then enter a correction again. However, if the 3362-3358 zone is broken, I expect a drop towards around 3350, followed by a potential rise towards the 3400 zone.
regards,
Alireza!
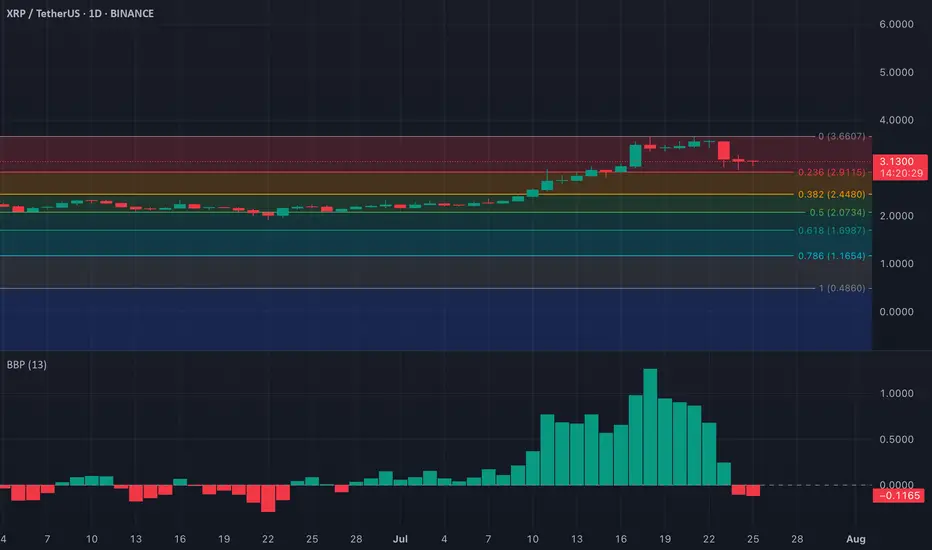
XRP – Bearish Signals from Elder-Ray IndexXRP’s bullish momentum appears to be fading, according to recent readings from the Elder-Ray Index on the daily chart. Over the past two sessions, the indicator has printed consecutive red bars, reflecting a clear shift in sentiment as buying pressure weakens.
The Elder-Ray Index evaluates the strength of bulls versus bears by measuring the difference between an asset’s price and its exponential moving average (EMA). A negative reading, like the one currently seen on XRP, means the asset is trading below its EMA — a sign that bearish pressure is outweighing bullish momentum. Traders may want to monitor closely for further downside confirmation.
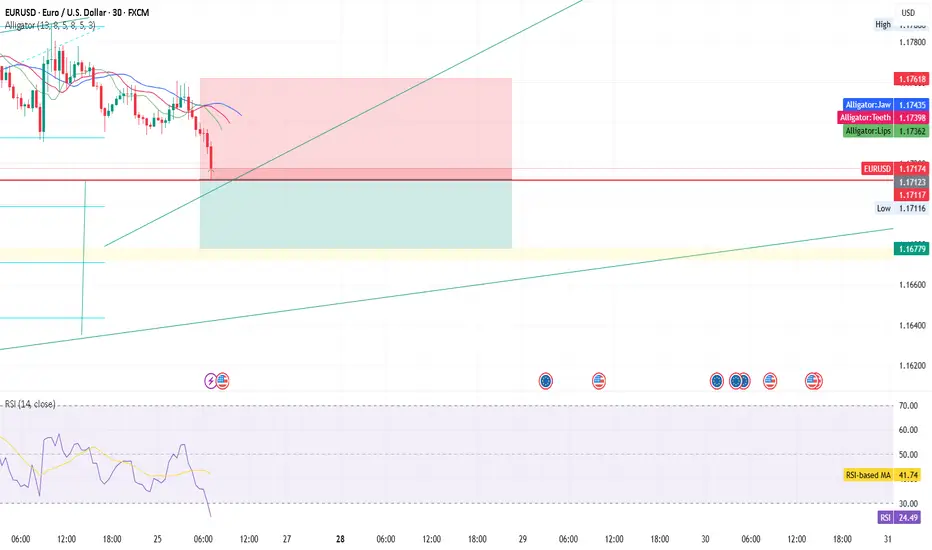
EURUSD Long Setup: Technically and Fundamentally Supported Push 📈 I'm expecting a climb of this pair due to weakening USD.
This idea is based on both technical and fundamental parameters:
🔍 Fundamentals
ECB kept rates unchanged, signaling stability and reluctance to tighten policy further.
FED is expected to cut rates in 5 days, as inflation eases and growth concerns rise in the US.
A weaker dollar is likely to support EURUSD strength.
1.20 is a psychological and political level – above that, European exporters begin to suffer, and ECB might intervene verbally or with policy action.
🧠 Technical Setup
Price has reclaimed a key support zone around 1.17069 – 1.17488, with consolidation signaling accumulation.
Break of the descending trendline shows bullish intent.
Next major resistance lies at 1.18971, followed by 1.20049 – a strong historical level and likely ECB reaction zone.
Final target at 1.20669 – 1.20682 marked by previous highs.
Entry Zone: 1.17045–1.17488 (current area of interest)
Stop Loss: Below 1.16724
Targets: 1.18971 / 1.20049 / 1.20669
💬 Feel free to monitor price action at key zones. Entry should be based on reaction at support or a confirmed breakout. This is not a blind entry setup.
📅 If the FED cuts rates as expected, USD weakness could accelerate the move.

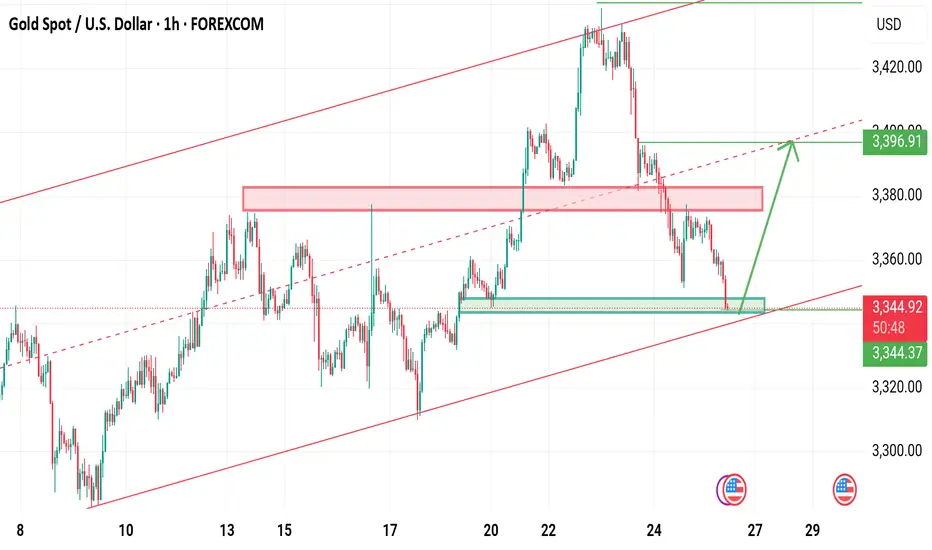
XAUUSD Last hope for buyers Gold is currently still holding rising channel last hope for buyers the bottom trendine .
Below 3335 buyers will be liquidate
What's possible scanarios we have?
▪️I'm gonna take buy trade from 3340-3338 area by following our rising Trend along with structural liquidity sweeps strategy, my target will be 3357 then 3368 in extension.
▪️if H4 candle closing below 3335 this Parallel moves will be invalid and don't look for buy till confirmation
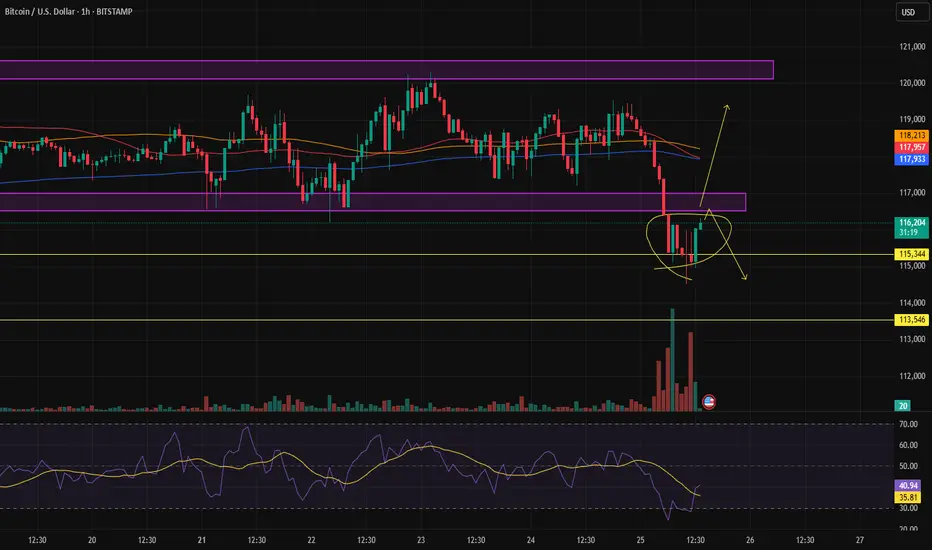
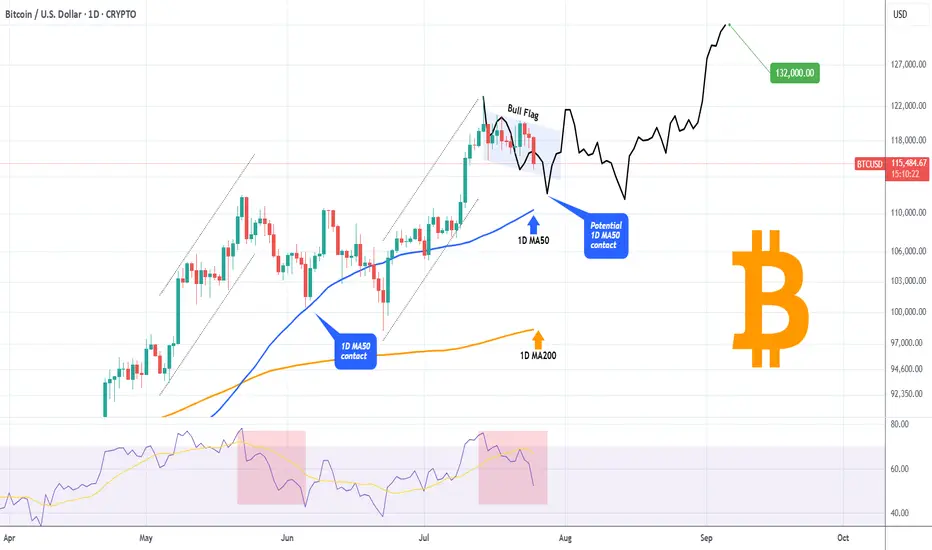
BITCOIN Is this just a giant Bull Flag?Bitcoin (BTCUSD) is basically on its first strong pull-back since the July 14 All Time High (ATH), as it is the 3rd straight red day going from roughly $120300 to below $115000 as of this moment.
Technically this Channel Down pull-back looks like a Bull Flag to the uptrend that started following the June 22 Low. The 1D RSI pattern is similar to the May 22 - 30 fractal, which was also a correction that started after a Channel Up and initially hit the 1D MA50 (blue trend-line), only to rebound a settle for a last dip lower closer to the 1D MA200 (orange trend-line).
If the 1D MA50 fails to contain the current correction, we may again be faced with a slightly more prolonged pull-back, which may be translated into an Accumulation Phase that could eventually lead to prices above $130000 by September.
Do you think that will be the case or we will see an instant rebound? Feel free to let us know in the comments section below!
-------------------------------------------------------------------------------
** Please LIKE 👍, FOLLOW ✅, SHARE 🙌 and COMMENT ✍ if you enjoy this idea! Also share your ideas and charts in the comments section below! This is best way to keep it relevant, support us, keep the content here free and allow the idea to reach as many people as possible. **
-------------------------------------------------------------------------------
💸💸💸💸💸💸
👇 👇 👇 👇 👇 👇
Did you take advantage of the setup I mentioned?We’ll decide the next move after reaching the top.
Good luck!
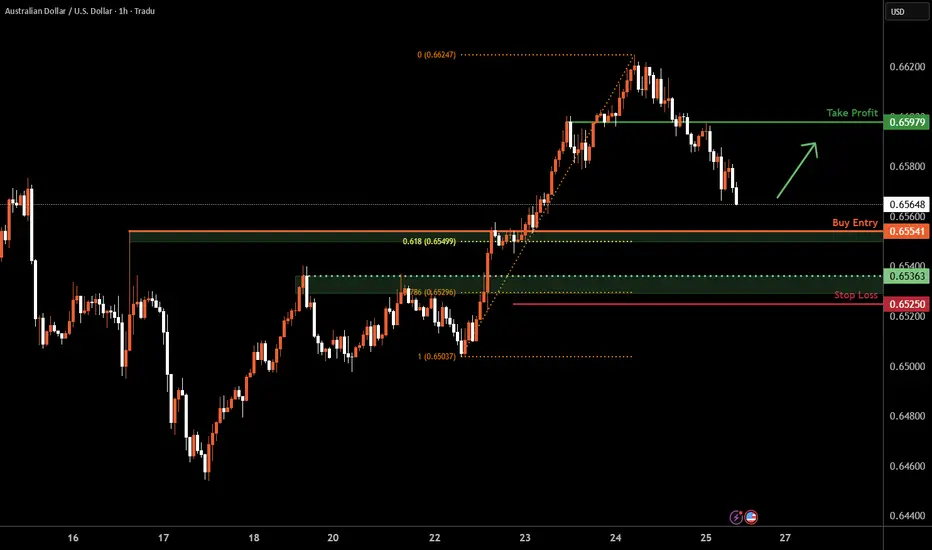
Aussie H4 | Falling toward a pullback supportThe Aussie (AUD/USD) is falling towards a pullback support and could potentially bounce off this level to climb higher.
Buy entry is at 0.6554 which is a pullback support that aligns with the 61.8% Fibonacci retracement.
Stop loss is at 0.6525 which is a level that lies underneath a pullback support and the 78.6% Fibonacci retracement.
Take profit is at 0.6597 which is a pullback resistance.
High Risk Investment Warning
Trading Forex/CFDs on margin carries a high level of risk and may not be suitable for all investors. Leverage can work against you.
Stratos Markets Limited (tradu.com ):
CFDs are complex instruments and come with a high risk of losing money rapidly due to leverage. 66% of retail investor accounts lose money when trading CFDs with this provider. You should consider whether you understand how CFDs work and whether you can afford to take the high risk of losing your money.
Stratos Europe Ltd (tradu.com ):
CFDs are complex instruments and come with a high risk of losing money rapidly due to leverage. 66% of retail investor accounts lose money when trading CFDs with this provider. You should consider whether you understand how CFDs work and whether you can afford to take the high risk of losing your money.
Stratos Global LLC (tradu.com ):
Losses can exceed deposits.
Please be advised that the information presented on TradingView is provided to Tradu (‘Company’, ‘we’) by a third-party provider (‘TFA Global Pte Ltd’). Please be reminded that you are solely responsible for the trading decisions on your account. There is a very high degree of risk involved in trading. Any information and/or content is intended entirely for research, educational and informational purposes only and does not constitute investment or consultation advice or investment strategy. The information is not tailored to the investment needs of any specific person and therefore does not involve a consideration of any of the investment objectives, financial situation or needs of any viewer that may receive it. Kindly also note that past performance is not a reliable indicator of future results. Actual results may differ materially from those anticipated in forward-looking or past performance statements. We assume no liability as to the accuracy or completeness of any of the information and/or content provided herein and the Company cannot be held responsible for any omission, mistake nor for any loss or damage including without limitation to any loss of profit which may arise from reliance on any information supplied by TFA Global Pte Ltd.
The speaker(s) is neither an employee, agent nor representative of Tradu and is therefore acting independently. The opinions given are their own, constitute general market commentary, and do not constitute the opinion or advice of Tradu or any form of personal or investment advice. Tradu neither endorses nor guarantees offerings of third-party speakers, nor is Tradu responsible for the content, veracity or opinions of third-party speakers, presenters or participants.
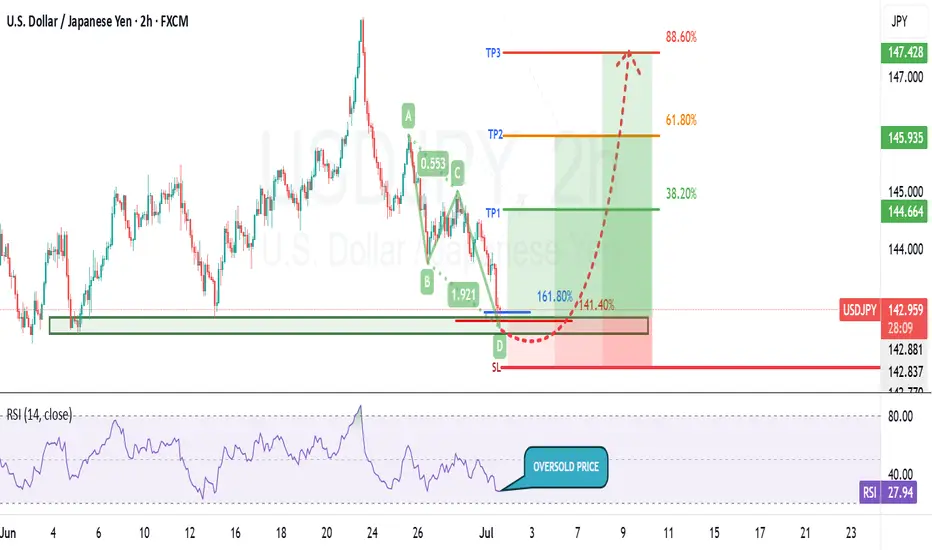
BUY USDJPYThe price drop on UJ has been wild however price is at a good support zone, we see the ABCD pattern by way of a bullish Fibonacci invasion setup hoping it will give good liquidity. Buy wisely.
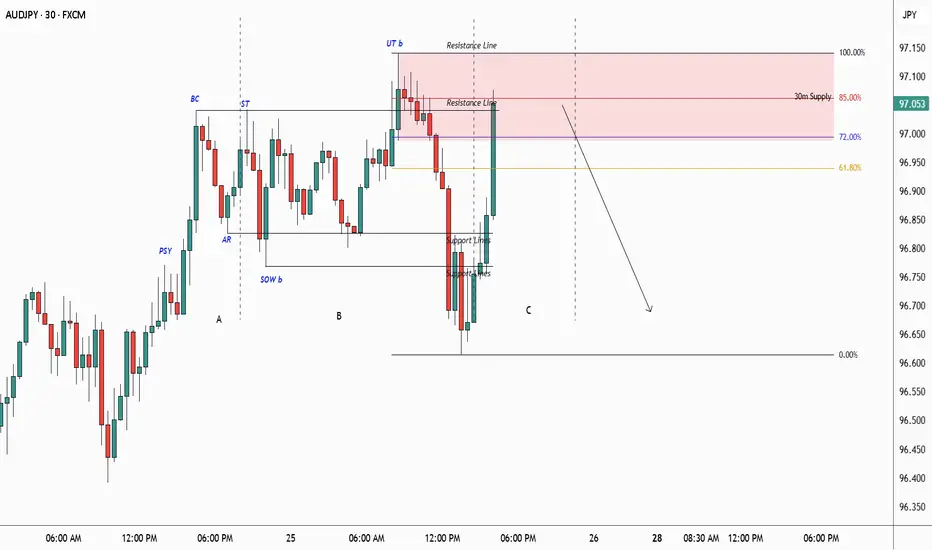
AUDJPY Possible Short set-upPrice is currently forming a possible Distribution Schematic 2 Wyckoff. Also, price may currently form the Phase C of the schematic.