USOIL WTIWest Texas Intermediate (WTI) oil is a major benchmark for crude oil pricing, known for its high quality—being both light and sweet due to its low sulfur content and low density. WTI is sourced primarily from inland Texas and is the underlying commodity for oil futures traded on the New York Mercantile Exchange (NYMEX). The main physical delivery point is Cushing, Oklahoma, a critical U.S. oil storage and trading hub.
Current Price (as of August 1, 2025)
WTI crude oil is trading around $69.15–$69.36 per barrel.
Recently, WTI prices have seen volatility due to global economic factors, including U.S. tariffs, OPEC+ production, and shifts in oil demand. Despite a small decline on the day, oil prices have posted their strongest weekly performance since June, rising over 6% for the week.
Market and Outlook
Recent price movement reflects concerns about global trade tensions, new tariffs, and their impact on economic growth and energy demand. At the same time, supply risks remain due to geopolitical factors such as potential sanctions on Russian oil and U.S.-China trade developments.
Analyst forecasts for the remainder of 2025 suggest continued volatility, with WTI potentially ranging between $56 and $73 per barrel, influenced by demand, OPEC+ decisions, and geopolitical events.
Quick Facts Table
Feature Detail
Type Light, sweet crude
Benchmark NYMEX (U.S.), major global reference
Main Delivery Point Cushing, Oklahoma
Latest Price (Aug 1, 2025) $69.15–$69.36 per barrel
Typical Drivers U.S. tariffs, OPEC+ decisions, trade policy, supply risks, global demand
WTI oil plays a central role in global energy markets, serving as a benchmark for North American and international oil pricing. Its price reflects both supply fundamentals and broader macroeconomic and geopolitical developments.
#OIL #WTI
Harmonic Patterns

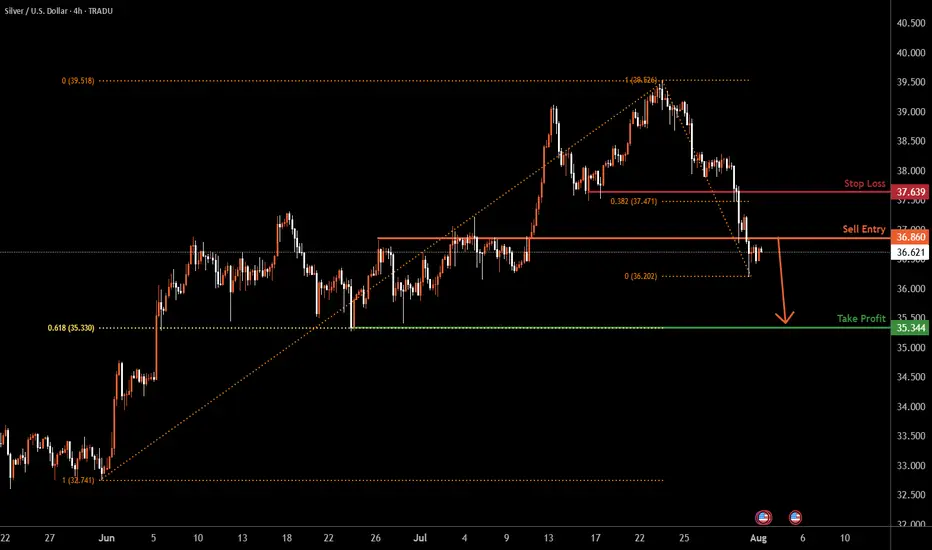
Silver H4 | Potential bearish dropBased on the H4 chart analysis, we could see the price reverse from the sell entry at 3.86, and could drop from this level to the downside.
Stop loss is at 37.63, which is a pullback resistance that is slightly above the 38.2% Fibonacci retracement.
Take profit is at 35.34, which is a swing low support that lines up with th e 61.8% Fibonacci retraecment.
High Risk Investment Warning
Trading Forex/CFDs on margin carries a high level of risk and may not be suitable for all investors. Leverage can work against you.
Stratos Markets Limited (tradu.com ):
CFDs are complex instruments and come with a high risk of losing money rapidly due to leverage. 65% of retail investor accounts lose money when trading CFDs with this provider. You should consider whether you understand how CFDs work and whether you can afford to take the high risk of losing your money.
Stratos Europe Ltd (tradu.com ):
CFDs are complex instruments and come with a high risk of losing money rapidly due to leverage. 66% of retail investor accounts lose money when trading CFDs with this provider. You should consider whether you understand how CFDs work and whether you can afford to take the high risk of losing your money.
Stratos Global LLC (tradu.com ):
Losses can exceed deposits.
Please be advised that the information presented on TradingView is provided to Tradu (‘Company’, ‘we’) by a third-party provider (‘TFA Global Pte Ltd’). Please be reminded that you are solely responsible for the trading decisions on your account. There is a very high degree of risk involved in trading. Any information and/or content is intended entirely for research, educational and informational purposes only and does not constitute investment or consultation advice or investment strategy. The information is not tailored to the investment needs of any specific person and therefore does not involve a consideration of any of the investment objectives, financial situation or needs of any viewer that may receive it. Kindly also note that past performance is not a reliable indicator of future results. Actual results may differ materially from those anticipated in forward-looking or past performance statements. We assume no liability as to the accuracy or completeness of any of the information and/or content provided herein and the Company cannot be held responsible for any omission, mistake nor for any loss or damage including without limitation to any loss of profit which may arise from reliance on any information supplied by TFA Global Pte Ltd.
The speaker(s) is neither an employee, agent nor representative of Tradu and is therefore acting independently. The opinions given are their own, constitute general market commentary, and do not constitute the opinion or advice of Tradu or any form of personal or investment advice. Tradu neither endorses nor guarantees offerings of third-party speakers, nor is Tradu responsible for the content, veracity or opinions of third-party speakers, presenters or participants.
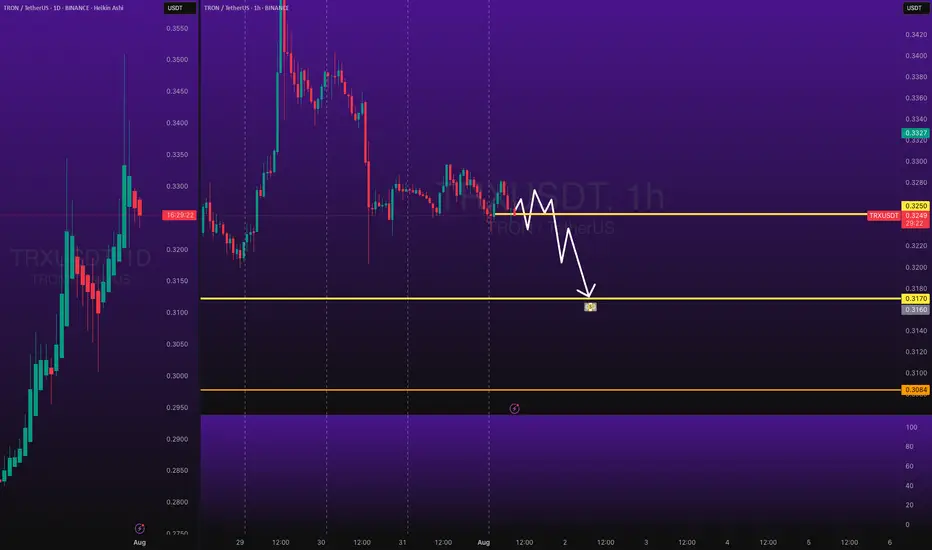
TRXUSDT Short Trade - Price CorrectionsBINANCE:TRXUSDT Short Day Trade - Low Risk, with my back testing of this strategy, it hits multiple possible take profits, manage your position accordingly.
Note: Manage your risk yourself, its risky trade, see how much your can risk yourself on this trade.
Use proper risk management
Looks like good trade.
Lets monitor.
Use proper risk management.
Disclaimer: only idea, not advice
HBARSimiliar scenario to BYBIT:BTCUSDT.P just have to wait for the daily close.
I marked out a potential entry are with the red line, which is a 4H order block which COULD be tapped
Again I will update you on my entry ASAP
Do not forget to follow and like, it helps me alot.
Stay blessed
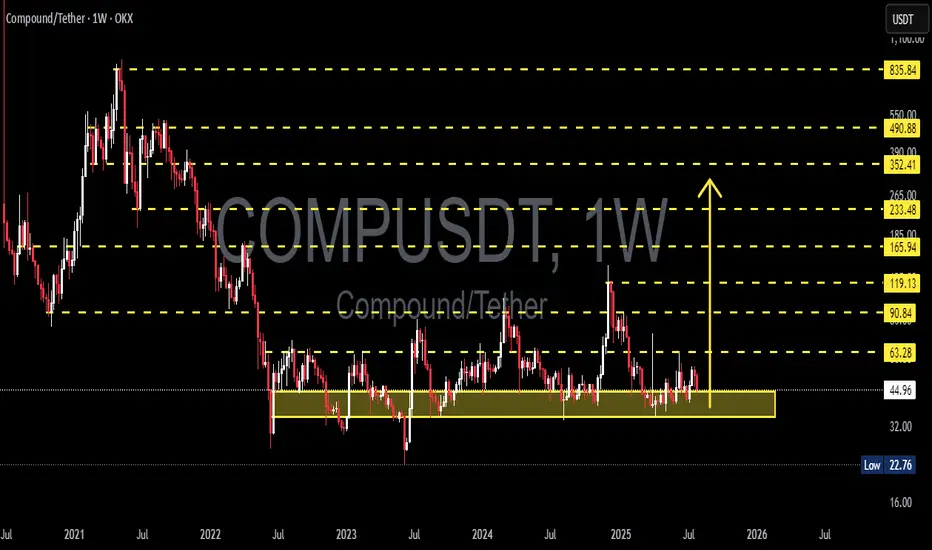
COMPUSDT in a Strong Demand Zone! Reversal Potential / Breakdown🔍 In-Depth Analysis (Timeframe: Weekly / 1W)
The COMP/USDT pair is currently hovering above a long-term demand zone that has held strong since mid-2022. Price is sitting around $44.90, just above the key support area of $32 – $45 (highlighted in yellow), which has acted as a major accumulation zone for over 2 years.
🧱 Critical Zone: Smart Money Accumulation or Exhaustion?
The $32–$45 demand zone has been tested multiple times, indicating smart money interest and hidden buying pressure.
Price action in this range forms a clear base structure or horizontal accumulation pattern, a classic setup before a large directional move.
However, the prolonged sideways consolidation hints at an imminent breakout or breakdown — momentum is building.
---
📊 Key Technical Pattern:
🟨 Rectangle Range (Accumulation Structure)
Price has been ranging between $32 and $63.28 with no clear breakout.
Strong rejections every time price dips below $35 indicate consistent buyer defense.
🔃 Mean Reversion Behavior
Repeated moves back to the mid-range reflect an indecisive market (equilibrium phase), often seen before expansion.
---
📈 Bullish Scenario (Potential Reversal):
If price breaks above major resistance at $63.28:
1. Upside Targets:
🎯 $90.84 (key resistance zone)
🎯 $119.13 (prior distribution zone)
🎯 $165.94 (macro target if sentiment turns highly bullish)
2. Confirmation needed via weekly close above $63 with strong volume.
3. A bullish breakout may form a new Higher Low and Higher High structure on both daily and weekly timeframes.
🟢 Bullish confirmation: Weekly bullish engulfing + volume breakout above $63.
---
📉 Bearish Scenario (Potential Breakdown):
If price closes below the $32 support:
1. Possible downside targets:
⚠️ $22.76 (next logical support)
🚨 $16 (last consolidation base pre-2021 rally)
2. A break below this long-term support could trigger a final capitulation flush before a potential macro reversal.
🔴 Bearish confirmation: Weekly close below $32 with increased volume and sustained selling.
---
⚖️ Strategic Takeaway:
COMP/USDT is currently at a pivotal decision zone — a crossroads between massive upside potential and deeper downside risk.
This is not just another support area, it’s a macro-level demand zone that will likely dictate trend direction in the coming months.
⏳ A major move is brewing — whether breakout or breakdown, be ready.
#COMPUSDT #CryptoOutlook #TechnicalAnalysis #AltcoinSeason #DeFi #CryptoTrading #AccumulationZone #BreakoutSetup #BearishScenario #BullishSetup #CryptoAnalysis
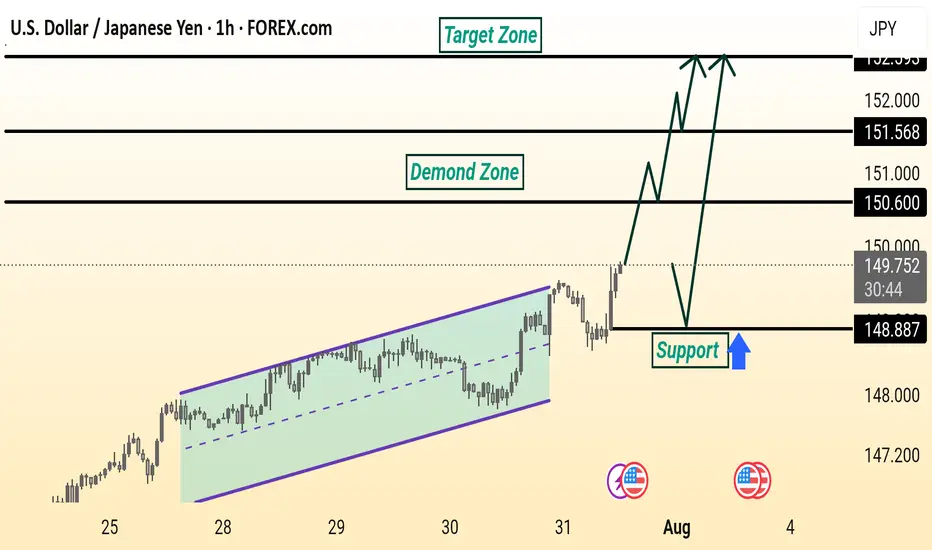
USD/JPY Analysis is Ready USD/JPY is showing a bullish setup. Price broke out of a rising channel and is expected to retest the 148.887 support level before moving higher toward the 150.600 and 151.568 resistance zones, targeting the 152.000 area. The demand zone adds strength to the potential upside.
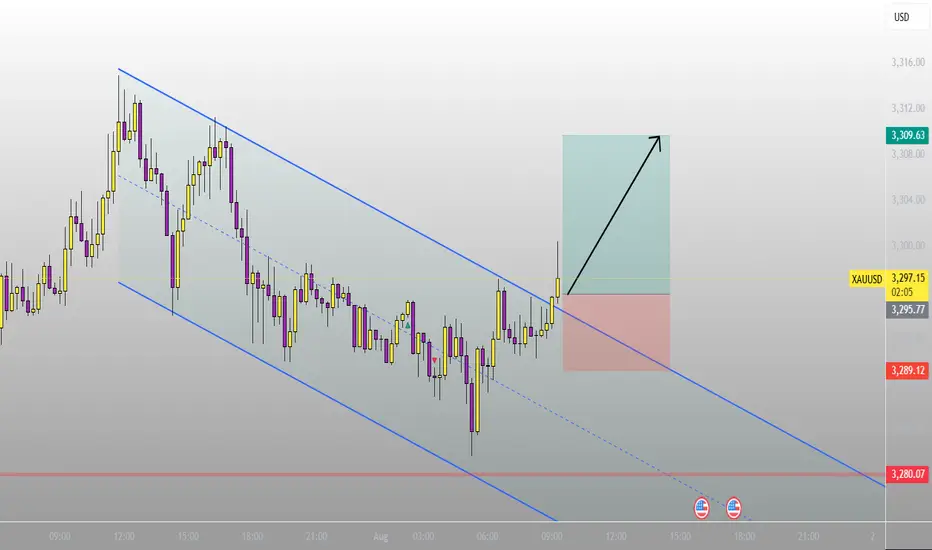
XAUUSD
XAUUSD Updated in 15M :
The gold signal is marked on the chart based on the latest price changes and the supply and demand in the market. These points include the entry point, stop loss, and take profit
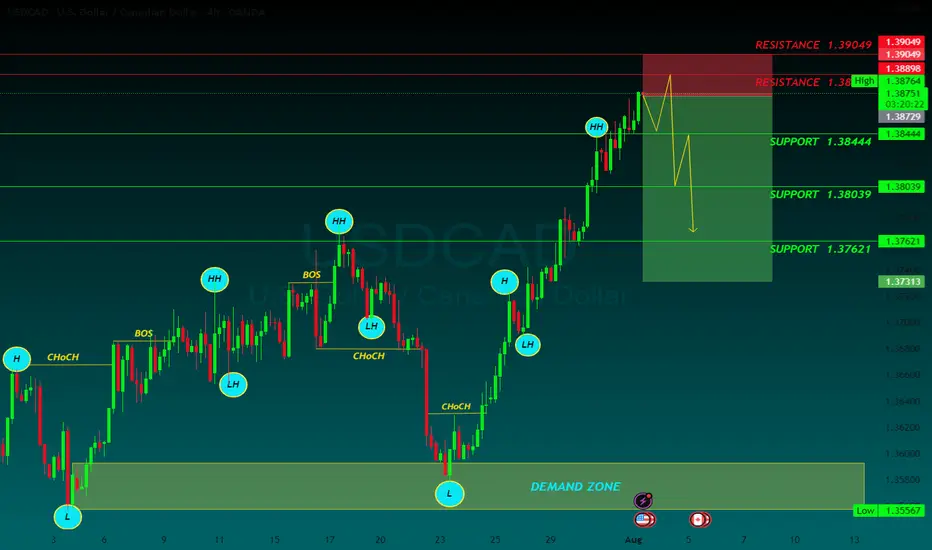
USDCAD SELLUSD/CAD rallies further, approaches 1.3900 on higher levies to Canada
The US Dollar keeps marching higher, as the Canadian Dollar struggles after Trump decided to increase tariffs to Canada to 35% from the previous 25%, escalating the trading tension with one of its main trading partners. The US President justified his decision on Canada’s alleged reluctance to cooperate on curbing the traffic of fentanyl and other drugs across the US border
The year will be politically marked by Trump’s return to the White House. A Republican government is seen as positive for financial markets, but Trump’s pledge to cut taxes and impose tariffs on foreign goods and services may introduce uncertainty to both the political and economic landscape.
Canada’s political crisis peaked in late 2024 with a no-confidence vote against Prime Minister Justin Trudeau, leading to snap elections and a weakened Liberal minority government. Policy uncertainty and economic challenges dominate 2025’s outlook, raising concerns over market stability and investor confidence.
The BoC is set to continue easing interest rates through 2025, at least at a faster pace than the Fed is expected to, which could apply pressure on CAD’s already-rising rate differential.
SUPPORT 1.38444
SUPPORT 1.38039
SUPPORT 1.37621
RESISTANCE 1.38889
RESISTANCE 1.39049
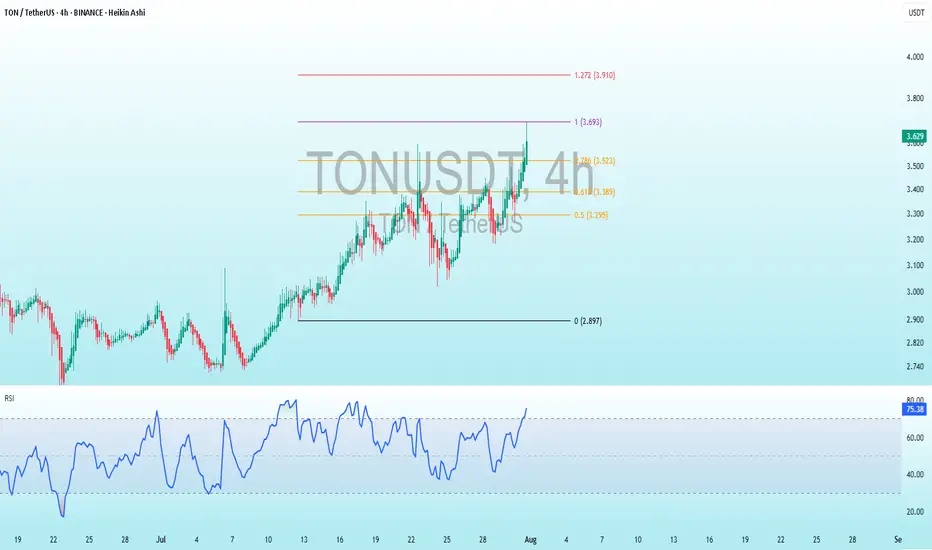
TON Bearish DivergenceBINANCE:TONUSDT
Trade Setup:
Target 1: 3.523 (0.786 Fibonnaci Golden Zone).
Target 2: 3.389 (0.618 Fibonnaci Golden Zone).
Target 3: 3.295 (0.786 Fibonnaci Golden Zone).
Target 4: 2.897 (0 Fibonnaci).
Stop Loss: 3.910 (1.272 Fibonnaci).
RSI Analysis: The RSI is showing a bullish divergence, suggesting potential bullish momentum. The current RSI is around 75.44, approaching overbuy territory, so caution is advised.
Pattern targetIn the previous analysis, we spotted a head and shoulders pattern and mentioned that if it gets activated, it will hit the pattern target — and that’s exactly what happened.
A clean and beautiful setup.
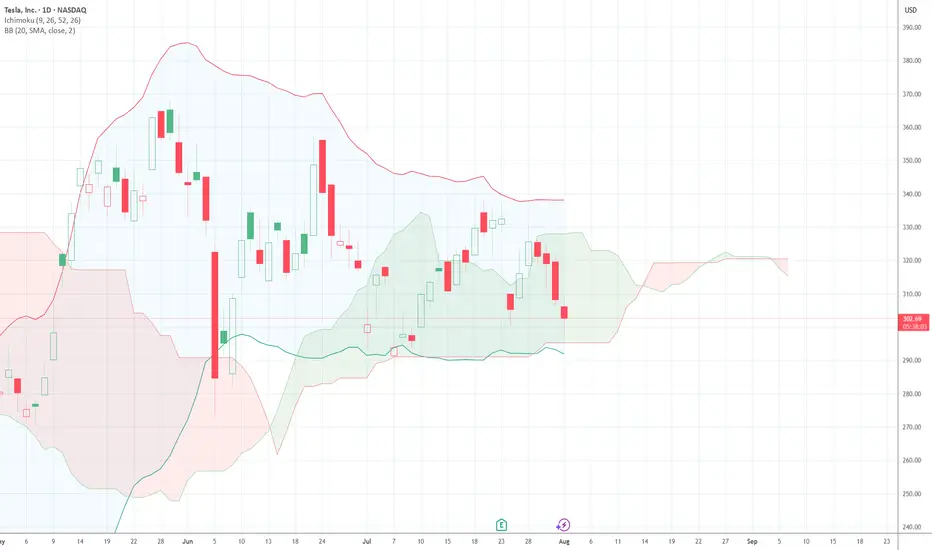
$TSLA 3rd Time's a CharmI bottom called NASDAQ:TSLA twice in a row. About to do it a third time today. 312.5C 8/8 @ 4.47 were just bought for $1.3 million.
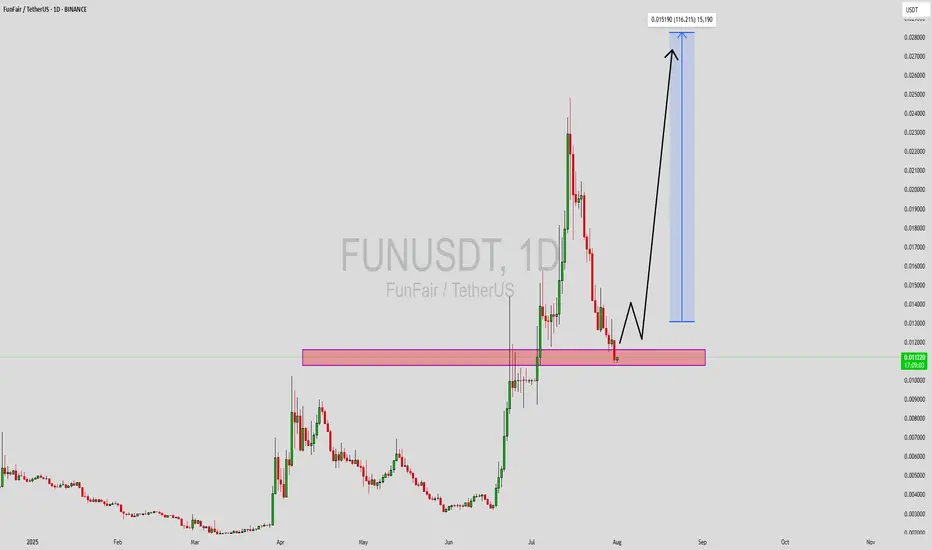
FUNUSDT Forming Bullish ReversalFUNUSDT is currently forming a bullish reversal pattern, signaling a potential shift in market momentum after a prolonged consolidation. This pattern, combined with a steady increase in trading volume, suggests growing investor interest and the possibility of an upcoming trend reversal. The structure aligns well with historical price action, where FUN has previously bounced from similar technical setups, making this an attractive chart for swing traders and medium-term investors.
The volume profile shows accumulation behavior, typically seen before major breakouts. This reflects the confidence of larger market participants entering at lower levels. If FUNUSDT confirms the breakout above resistance zones, the next leg up could lead to a potential price surge of 140% to 150% from current levels. Given its relatively low market cap and recent technical developments, the upside potential remains significant if momentum sustains.
What adds to the bullish thesis is the overall pattern integrity supported by clear trendline reactions and support zone validation. FUN has also maintained a healthy base formation, which often precedes explosive upward moves. A close above key resistance with volume confirmation would likely attract more traders and potentially push FUN into price discovery territory.
Keep this altcoin on your watchlist as it presents a high-reward setup supported by solid technical foundations and increasing trader sentiment.
✅ Show your support by hitting the like button and
✅ Leaving a comment below! (What is You opinion about this Coin)
Your feedback and engagement keep me inspired to share more insightful market analysis with you!
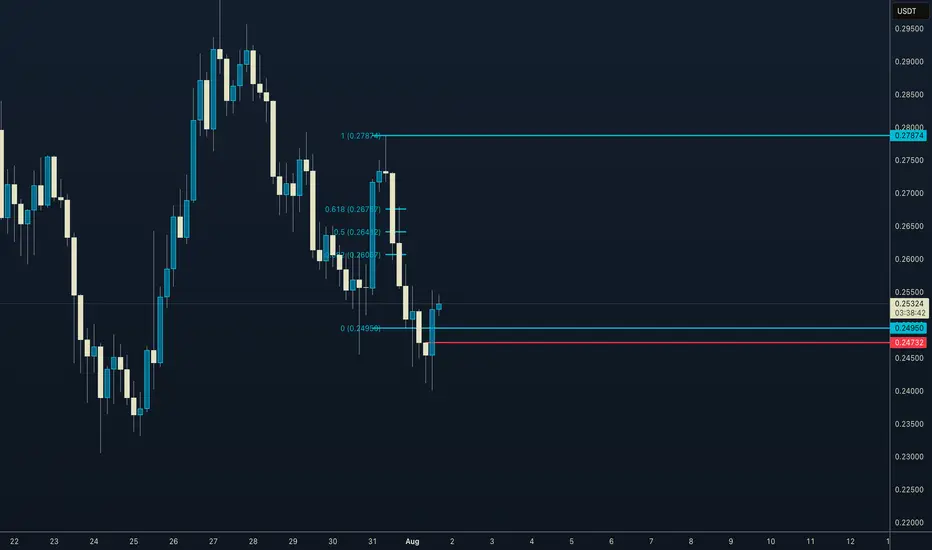
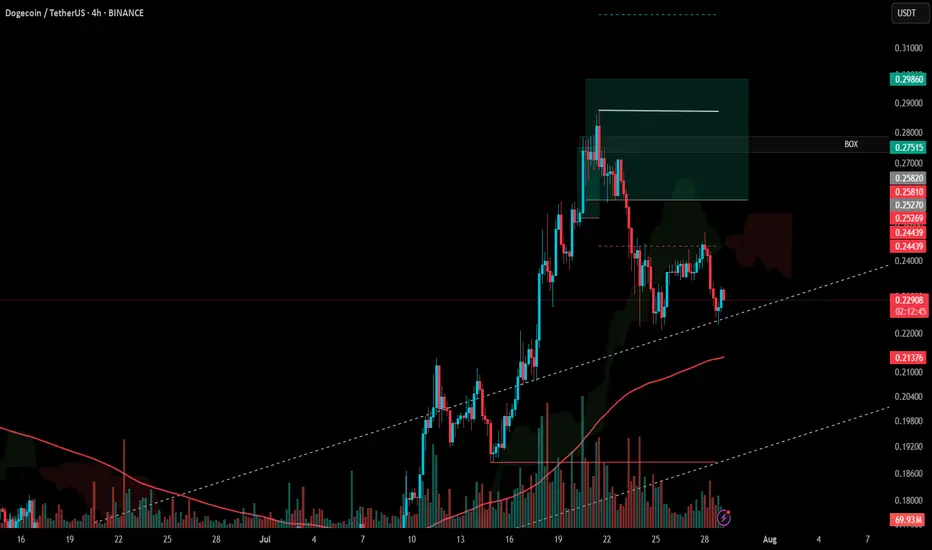
#DOGE Update #3 – July 29, 2025#DOGE Update #3 – July 29, 2025
I’m still holding my Doge position and haven’t been stopped out. I plan to lower my average cost by adding to the position at potential reversal zones. This is how I intend to proceed. My entry level is currently $0.2583, and my target is $0.2986, which means I’m aiming for roughly a 15% profit.
At the moment, the price has pulled back about 11% from that level. There’s nothing to worry about—it’s perfectly normal. Doge is continuing its movement by taking support from the bottom of an upward trend. I’m still in the position and planning to exit with profit without setting a stop.
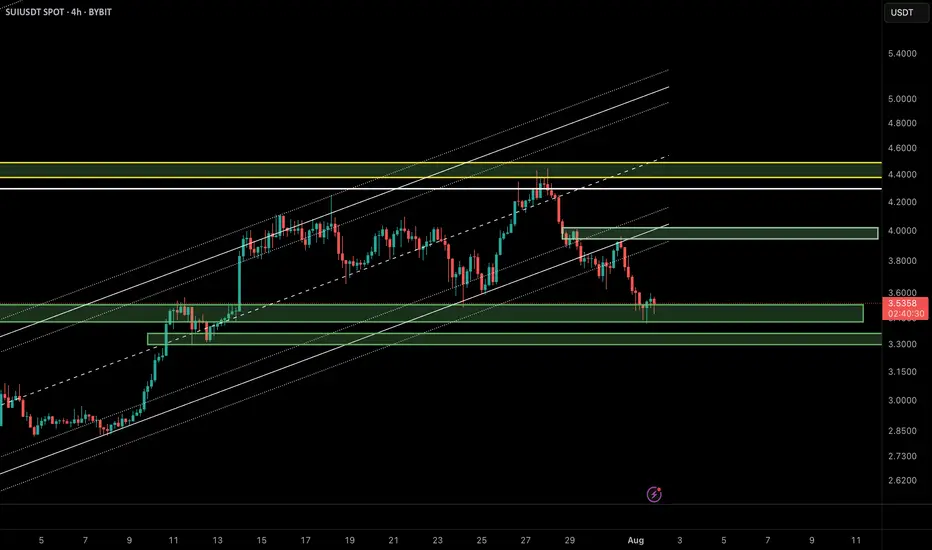
SUI/USDT Update – Bounce Setup from Demand Zone?In the previous analysis, we highlighted a short opportunity near $4.20, which played out perfectly. Now, SUI has reached a key demand zone around $3.40–$3.55, overlapping with the lower boundary of the ascending channel and a previously defined bullish order block.
🔹 Market Structure:
After breaking the bullish structure, price is now revisiting a major liquidity zone between $3.40 and $3.55.
🔹 Price Behavior:
Wicks to the downside suggest buy-side absorption and potential for short-term reversal.
🔹 Possible Scenario:
If the $3.40 zone holds, we could see a corrective move up to the supply zone around $3.90–$4.00.
📌 Key Levels:
• Support: $3.40–$3.55
• Resistance: $3.90–$4.00
❗️If the $3.40 support fails, bullish momentum will likely be invalidated in the short term.
🧠 Pro Tip (SMC-based):
When a demand zone aligns with liquidity sweep and channel support, it often becomes a high-probability area for institutional re-entries. Wait for a clear confirmation like BOS or bullish engulfing candle before entering.
⸻
🔗 Like, share, and follow for more Smart Money & Elliott Wave-based insights!
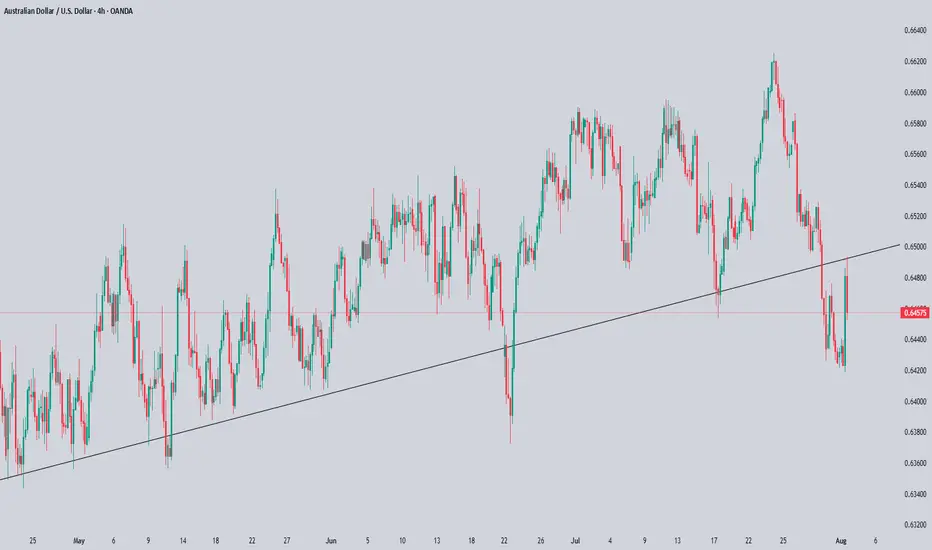
AUDUSD Technical & Order Flow AnalysisOur analysis is based on a multi-timeframe top-down approach and fundamental analysis.
Based on our assessment, the price is expected to return to the monthly level.
DISCLAIMER: This analysis may change at any time without notice and is solely intended to assist traders in making independent investment decisions. Please note that this is a prediction, and I have no obligation to act on it, nor should you.
Please support our analysis with a boost or comment!
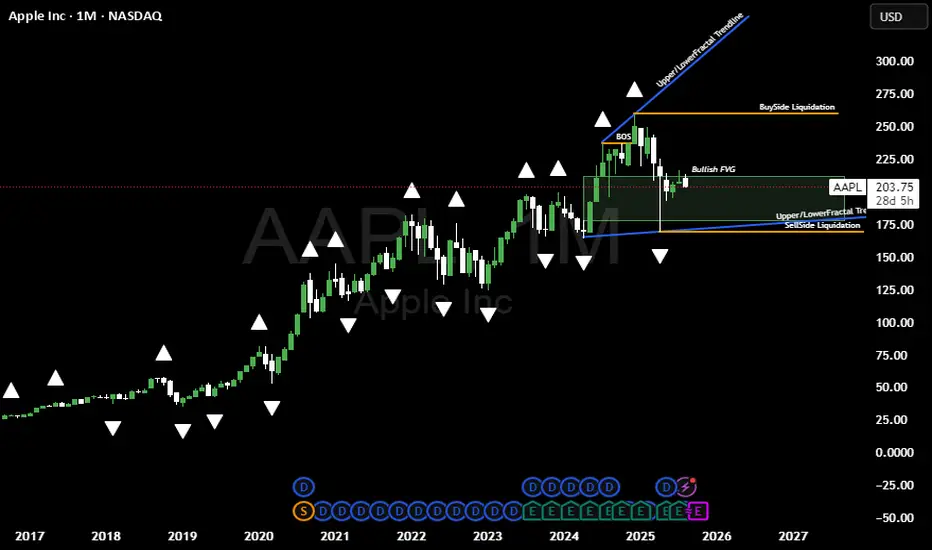
Bullish Idea on APPLNASDAQ:AAPL / Lovley day its been a while, am planing to share my views on the markets atleast once a week from now going forward. Basically on this bias idea above here @LutthMage we are leaning more on long term holding, WITH AN ADVANTAGE OF TAKING SHORT TERM TRADES BASED ON OUR LONG TERM INVESTMENT IDEA WE ARE SURE YOU WILL UNDERSTAND AS TIME GOES BY.
NOW LET THE GAMES BEGIN```
On the chart above we a basically bullish due to 4 reasons
1. The trend is our friend its currently bullish, because AAPL is BREAKING STRUCTURE NO VISIBLE Change of character as of yet
2. We got a widening channel currenly bouncing of the lower level line of the channel.
3. Price is playing around a Bullish FVG
4. APPLE JUST CREATED SELL SIDE LIQUIDITY.
We will keep you posted on the short term trades we execute based on this bullish bias on APPL, ofcourse only if they do appear for now we sit and do the hardest thing to do wich is NOTHING.
AS TIME GOES BY YOU WILL CHARACTERIZE A WASH RINSE AND REPEAT PROCESS FROM US @LutthMage NASDAQ:AAPL
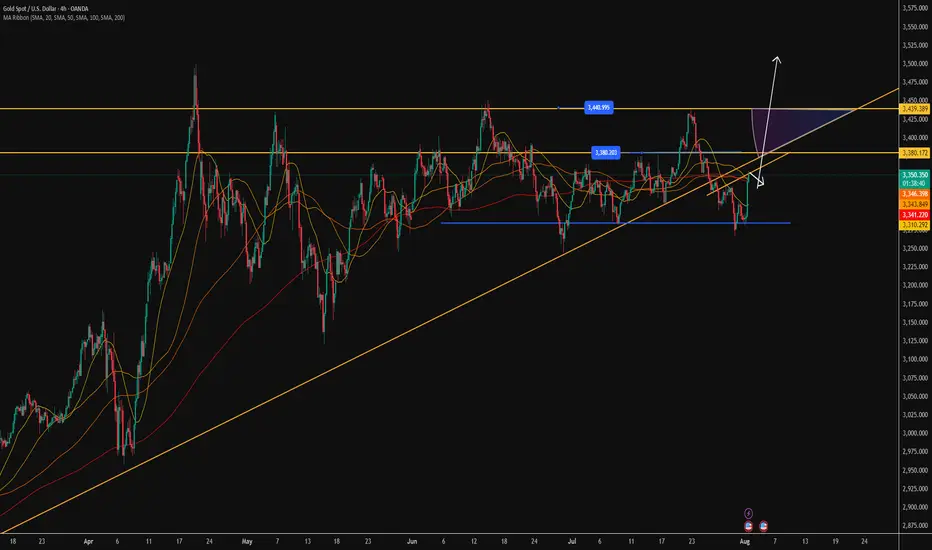
Gold Price Target: 3380-3400+, Set a Trailing StopGold Price Target: 3380-3400+, Set a Trailing Stop
As shown in Figure 4h:
Gold finally rallied this weekend.
Despite recent heavy losses for long positions, the past two days have been encouraging.
We ultimately managed to successfully buy the dip in the 3280-3300 range and recover all our losses.
Gold prices continue to rise, and everyone is asking if it's time to sell.
Now is the critical time to exit.
We must acknowledge one fact:
Gold currently presents a huge opportunity.
Of course, the risks are also increasing.
At times like these, I always emphasize that the best approach is to set a 10-point trailing stop.
Even if gold prices soar, we can move with them.
This non-farm payroll data was a huge disappointment.
It was a truly positive surprise for gold.
The market expected 110,000 new jobs, but the result was a disappointing 73,000, a decrease of half from the previous month.
The market went into a tizzy after the outperformance. But even more shocking news is yet to come: Non-farm payrolls for May and June were revised downward by a combined 258,000.
This means the June gain was revised downward from 140,000 to 14,000.
The May gain was abruptly revised downward from 140,000 to 19,000.
The strong data of the past two months was completely false.
Market followers have become the "clowns" of the Fed and Trump.
Now you understand why everyone praised Powell's hawkish speech two days ago.
Because Powell said: "Only if there is a severe decline in employment will we consider cutting interest rates."
Just this Wednesday, some good non-farm payroll data was released.
This undoubtedly gave the market a false impression.
Everyone believed that a rate cut was impossible, and the probability of a September cut had dropped to 40%.
However, today's poor non-farm payroll data, combined with revisions to May and June data, revealed the truth.
The job market has been dismal over the past quarter.
The market reacted quickly, and gold prices soared on this sentiment.
My advice is to buy gold at a low price and hold on.
For investors who have successfully bought in the 3280-3300 level in recent days, I recommend setting a 10-15 pip trailing stop-loss.
Gold prices are likely to continue their upward trend next Monday.
Our next target is above 3380-3400 points.
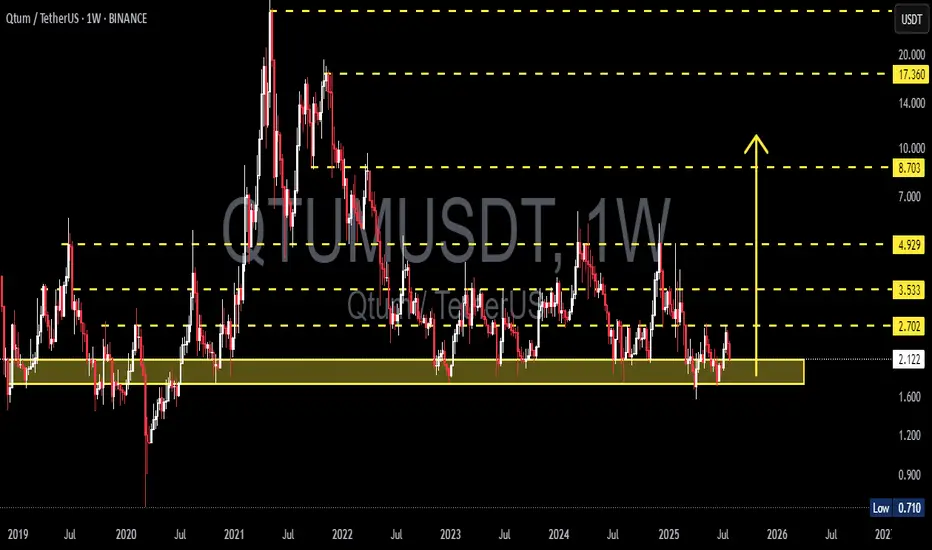
QTUM/USDT – Make or Break? Testing the Edge of Accumulation?🧠 Overview:
After going through a volatile multi-year cycle, QTUM is now back at one of the most critical historical support zones. This demand area has acted as a strong reversal point multiple times since 2020 and is once again being tested as price consolidates near the bottom of its macro range.
---
📉 Price Structure & Key Levels:
📍 Major Support Zone (1.70 – 2.10 USDT):
A proven accumulation zone based on multiple long wicks and price rejections in the past.
This is where smart money tends to accumulate during market uncertainty.
📍 Layered Resistance Levels (Bullish Targets):
2.70 USDT → Initial breakout validation
3.53 USDT → Mid-range resistance
4.93 USDT → Key structural level
8.70 USDT → Mid-term breakout target
17.36 USDT → Peak from previous macro cycle
---
🧩 Current Pattern: "Sideways Accumulation Range"
QTUM is clearly in a range-bound accumulation phase, with tight price action within a key support area. Historically, such patterns often precede large impulsive moves, especially when accompanied by volume surges and breakouts from structure.
> ⚠️ Important Note: Sideways movement at historical support, combined with increasing accumulation volume, often leads to a breakout into the markup phase.
---
📈 Bullish Scenario: Potential Upside Momentum
Trigger: A confirmed breakout and weekly candle close above 2.70 USDT.
Additional Confirmation: Strong bullish candle with increased volume.
Targets:
3.53 USDT (local resistance)
4.93 USDT (mid-range structural level)
8.70 USDT (swing target)
17.36 USDT (macro cycle high)
🎯 High reward-to-risk potential if entries are made near support with a stop-loss under 1.70 USDT.
---
📉 Bearish Scenario: Breakdown Risk
Trigger: Weekly candle closes below 1.70 USDT.
Implication: Breakdown from long-term demand zone.
Downside Targets:
1.20 USDT → Minor horizontal support
0.71 USDT → Historical all-time low
Warning Sign: High volume breakdown = likely sign of institutional selloff or panic exit.
---
📊 Strategic Summary:
> QTUM is at a pivotal crossroads.
The 1.70 – 2.10 USDT range is a decisive area.
A bullish breakout could spark a major recovery rally,
while a breakdown may lead to a deeper capitulation.
This is a “calm before the storm” situation. Traders should monitor closely as the next few weekly candles could define the trend for the rest of 2025.
#QTUMUSDT #QTUM #CryptoAnalysis #AltcoinSetup #TechnicalAnalysis #AccumulationPhase #SupportAndResistance #BreakoutPlay #CryptoBreakout
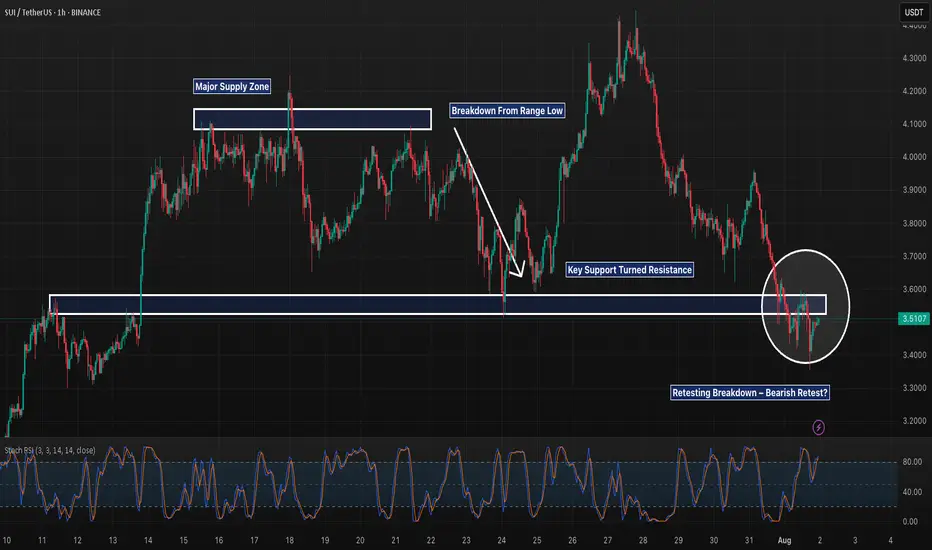
SUI 1H – Breakdown & Retest of Key Support, But Will It Reject?SUI 1H – Breakdown & Retest of Key Support, But Will It Reject or Reclaim?
Description:
SUI just completed a textbook range breakdown after weeks of sideways chop between ~$3.60–$4.10. The prior support floor has now flipped into resistance, and the recent bounce appears to be retesting that structure. If this retest gets rejected, continuation toward lower support zones (potentially $3.30 and below) becomes likely.
However, reclaiming and holding above $3.60 could trap late shorts and fuel a squeeze. Structure still favors bears for now, but it’s decision time.
📌 Breakdown structure
📌 Bearish retest
📌 Eyes on confirmation or invalidation
This is the battle zone — stay sharp.
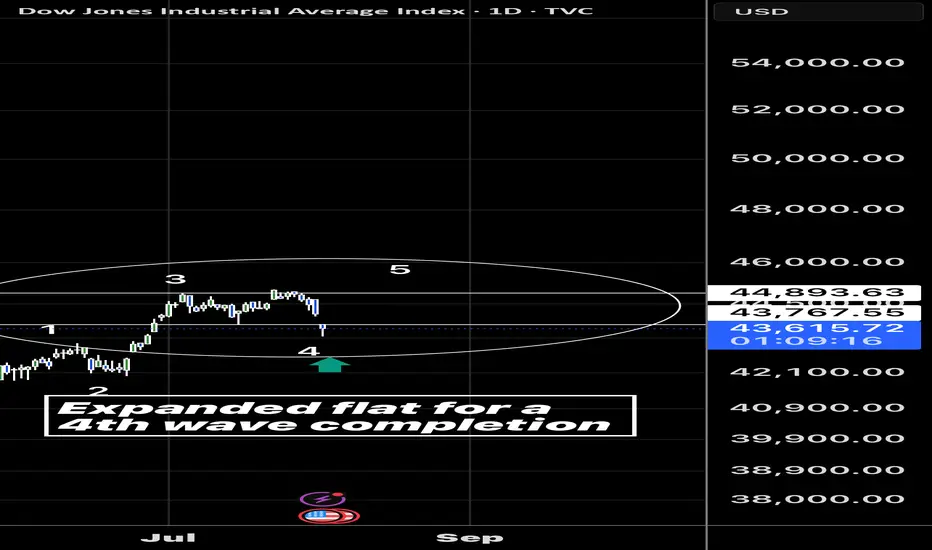
CARRY TRADE RISK IT IS SHOWING CRACKSThe chart posted in my work on TSXV:USS yen I have NOT CHANGED THE WAVE STRUCTURE AT ALL take notice of my statement CRASH COMING
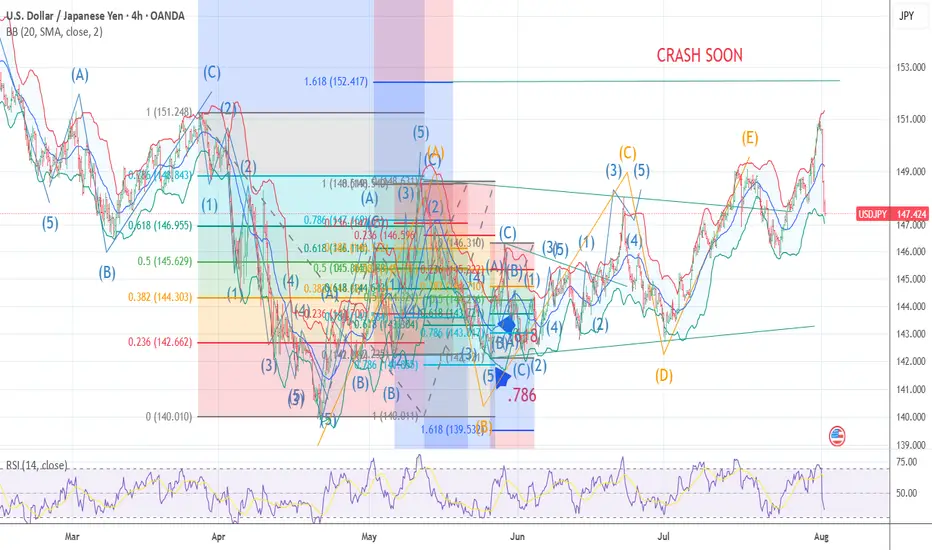
Expanded flat on the Dow for 4th wave completion? If it is we can see some new highs… a close back above 43760 today would set it up
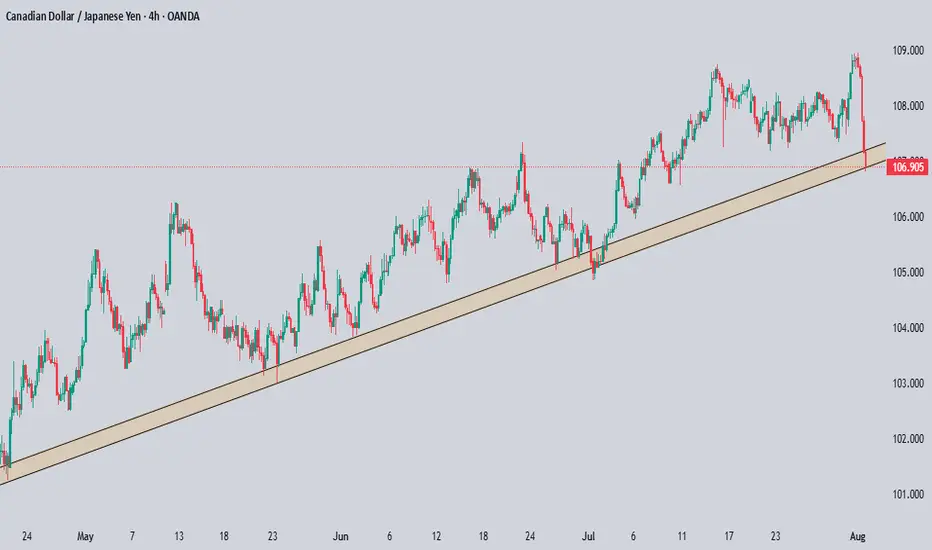
CADJPY Technical & Order Flow AnalysisOur analysis is based on a multi-timeframe top-down approach and fundamental analysis.
Based on our assessment, the price is expected to return to the monthly level.
DISCLAIMER: This analysis may change at any time without notice and is solely intended to assist traders in making independent investment decisions. Please note that this is a prediction, and I have no obligation to act on it, nor should you.
Please support our analysis with a boost or comment!
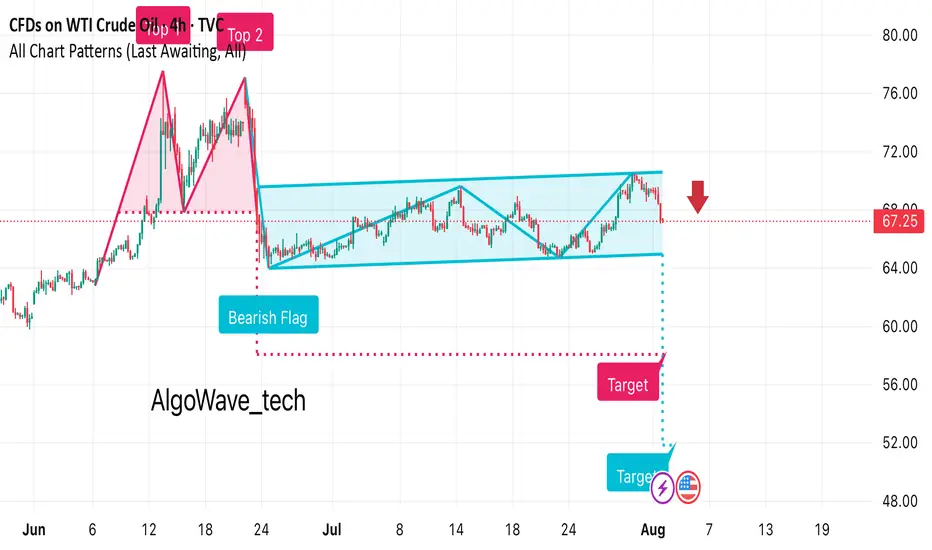
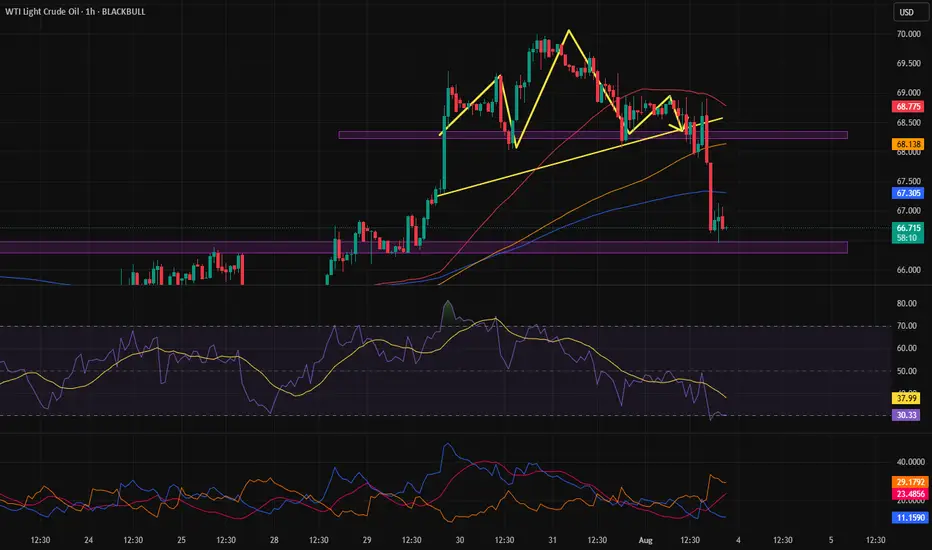
It looks like this chart for WTI Crude Oil is showing a bearish • Previous Move: There’s a strong downward leg before the flag formation, indicating bearish momentum.
• Flag Pattern: Price consolidates in an upward-sloping channel after the drop.
• Breakout: The chart suggests a bearish breakout below the channel, marked with a red arrow at around $67.25.
• Target Projection: The measured move target appears to be around the $53–54 range, based on the flagpole height.