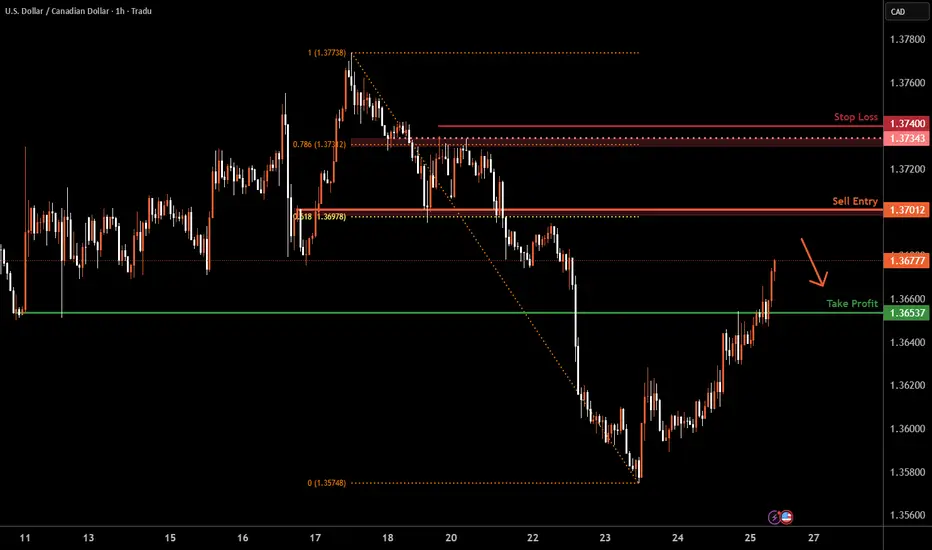
USD/CAD H4 | Potential bearish reversalUSD/CAD is rising towards an overlap resistance and could potentially reverse off this level to drop lower.
Sell entry is at 1.3701 which is an overlap resistance that aligns with the 61.8% Fibonacci retracement.
Stop loss is at 1.3740 which is a level that sits above the 78.6% Fibonacci retracement and an overlap resistance.
Take profit is at 1.3653 which is a pullback support.
High Risk Investment Warning
Trading Forex/CFDs on margin carries a high level of risk and may not be suitable for all investors. Leverage can work against you.
Stratos Markets Limited (tradu.com ):
CFDs are complex instruments and come with a high risk of losing money rapidly due to leverage. 66% of retail investor accounts lose money when trading CFDs with this provider. You should consider whether you understand how CFDs work and whether you can afford to take the high risk of losing your money.
Stratos Europe Ltd (tradu.com ):
CFDs are complex instruments and come with a high risk of losing money rapidly due to leverage. 66% of retail investor accounts lose money when trading CFDs with this provider. You should consider whether you understand how CFDs work and whether you can afford to take the high risk of losing your money.
Stratos Global LLC (tradu.com ):
Losses can exceed deposits.
Please be advised that the information presented on TradingView is provided to Tradu (‘Company’, ‘we’) by a third-party provider (‘TFA Global Pte Ltd’). Please be reminded that you are solely responsible for the trading decisions on your account. There is a very high degree of risk involved in trading. Any information and/or content is intended entirely for research, educational and informational purposes only and does not constitute investment or consultation advice or investment strategy. The information is not tailored to the investment needs of any specific person and therefore does not involve a consideration of any of the investment objectives, financial situation or needs of any viewer that may receive it. Kindly also note that past performance is not a reliable indicator of future results. Actual results may differ materially from those anticipated in forward-looking or past performance statements. We assume no liability as to the accuracy or completeness of any of the information and/or content provided herein and the Company cannot be held responsible for any omission, mistake nor for any loss or damage including without limitation to any loss of profit which may arise from reliance on any information supplied by TFA Global Pte Ltd.
The speaker(s) is neither an employee, agent nor representative of Tradu and is therefore acting independently. The opinions given are their own, constitute general market commentary, and do not constitute the opinion or advice of Tradu or any form of personal or investment advice. Tradu neither endorses nor guarantees offerings of third-party speakers, nor is Tradu responsible for the content, veracity or opinions of third-party speakers, presenters or participants.
Harmonic Patterns
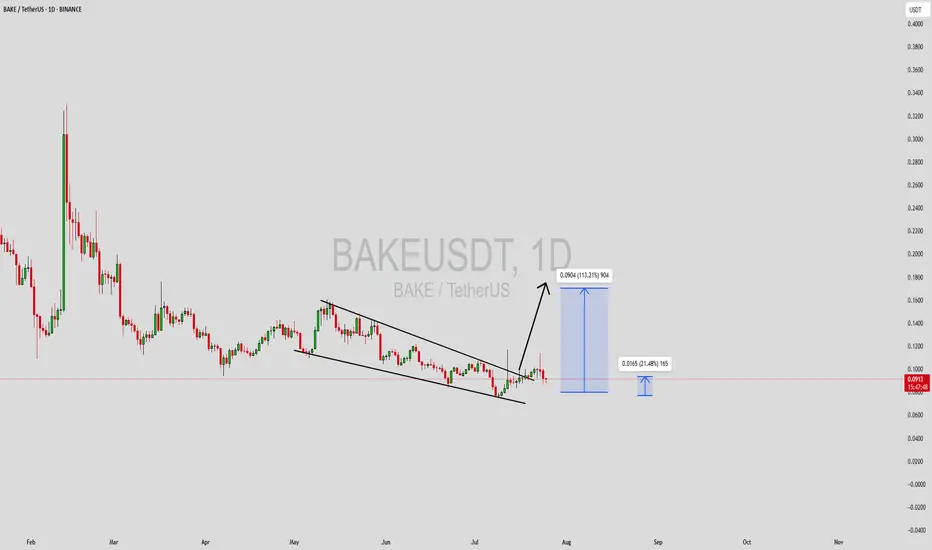
BAKEUSDT Forming Falling WedgeBAKEUSDT is presenting an interesting breakout scenario after forming a clean falling wedge pattern on the daily chart. Falling wedges are typically bullish reversal patterns, especially when confirmed by a breakout with volume. In this case, the wedge appears to be breaking to the upside, supported by a noticeable uptick in buying volume. Technical projections are pointing toward a potential price increase of 90% to 100%+, making this setup a valuable opportunity for swing traders and momentum investors.
BAKE (BakeryToken) remains an integral part of the DeFi and NFT landscape, particularly within the Binance Smart Chain ecosystem. Its utility, paired with renewed market attention and increased community engagement, could act as a fundamental driver behind this projected upward move. With the crypto market gradually rotating back into altcoins, BAKE could benefit from speculative capital flowing into undervalued DeFi assets.
Traders should keep a close watch on key resistance breakouts and continuation volume patterns. A confirmed daily candle close above the wedge resistance would further validate the bullish breakout thesis. Additionally, historical price action shows that BAKE has the potential to move sharply once momentum kicks in, offering a favorable risk-to-reward setup.
Overall, the technicals align well with rising investor sentiment. If the broader crypto environment stays supportive, BAKEUSDT could see a strong recovery rally in the short to mid term.
✅ Show your support by hitting the like button and
✅ Leaving a comment below! (What is You opinion about this Coin)
Your feedback and engagement keep me inspired to share more insightful market analysis with you!
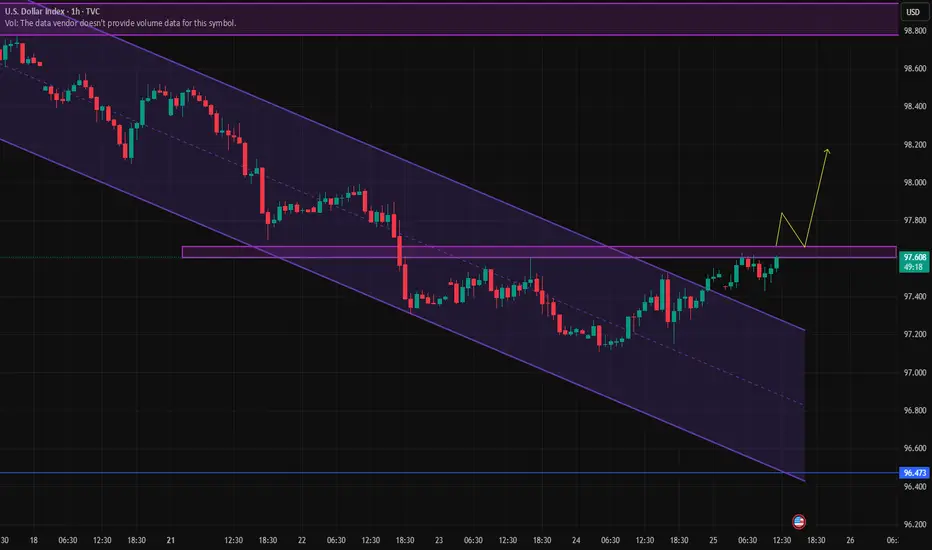
Is the DXY finally changing its trend?It seems that the DXY is showing a tendency to change its trend, but we have to see whether the sellers will allow it or not.
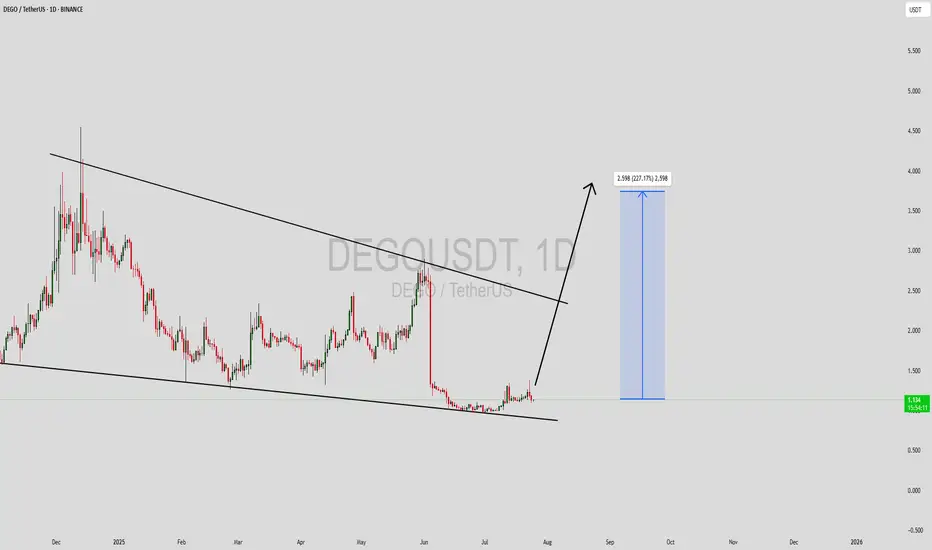
DEGOUSDT Forming Descending ChannelDEGOUSDT is currently showing signs of a strong bullish reversal setup after forming a well-defined descending channel pattern on the daily timeframe. Historically, descending channels are seen as bullish continuation or reversal patterns when price breaks above the upper trendline with increased volume. At present, DEGO appears to be nearing a breakout zone, accompanied by healthy volume, which may signal the start of a major upward move. The technical projection estimates a potential gain of 240% to 250%+, making this setup attractive for swing and position traders.
The increasing investor interest in DEGO Finance is another factor supporting the bullish outlook. As a DeFi and NFT infrastructure protocol, DEGO has maintained relevance even in volatile market phases. The combination of strong fundamentals and technical confirmation from a descending channel breakout could serve as a catalyst for an explosive price surge. Traders should keep an eye on confirmed daily closes above the resistance line and volume spikes for potential entry opportunities.
From a risk-reward perspective, DEGOUSDT offers an asymmetric setup, with the current price trading near the lower range of its historical levels. If the momentum continues and buyers step in with strength, the target range marked by the channel breakout could be hit quickly. Always watch for confirmation signals like retest support and bullish candle formations before entry to manage trade exposure effectively.
This setup is ideal for those who track high-volatility breakout patterns and understand how volume signals can lead to explosive rallies. DEGO is worth watching closely over the next few sessions, especially if market sentiment across the DeFi sector strengthens.
✅ Show your support by hitting the like button and
✅ Leaving a comment below! (What is You opinion about this Coin)
Your feedback and engagement keep me inspired to share more insightful market analysis with you!
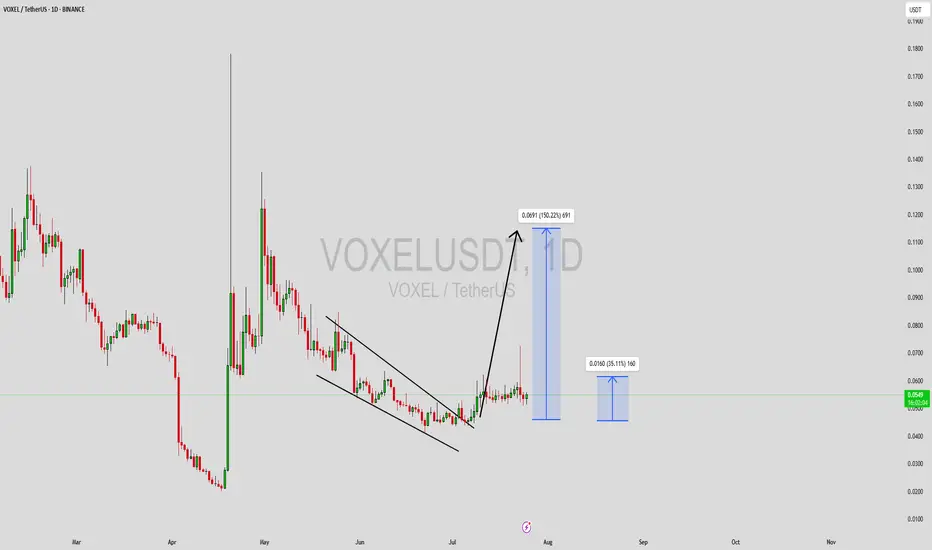
VOXELUSDT Forming Strong Bullish PotentialVOXELUSDT is currently exhibiting a highly promising setup with strong bullish potential, as shown in the latest price structure. The chart clearly displays a falling wedge formation, a pattern known for its bullish implications when confirmed with a breakout. VOXEL has recently broken out of this wedge with increased volume, suggesting a significant shift in momentum. Based on this breakout structure, an expected gain of 140% to 150%+ seems technically plausible in the upcoming sessions.
The token has demonstrated consistent accumulation in the lower price range, which often precedes sharp upward moves, especially in low-cap or mid-tier gaming/metaverse coins like VOXEL. With market participants increasingly shifting their attention toward undervalued gaming and metaverse projects, VOXEL is positioned to benefit from both technical and narrative-driven catalysts. The current market sentiment favors assets with solid technical foundations and growing community interest—both of which VOXEL currently exhibits.
Furthermore, the recent increase in trading volume reinforces the bullish scenario. Volume expansion post-breakout is typically a strong indicator of institutional or whale accumulation. Traders looking to capitalize on high-risk, high-reward setups should closely monitor VOXELUSDT for further confirmation candles and volume surges, which could signal the beginning of a parabolic run.
Given its current structure and historical price behavior, VOXEL may offer a rare opportunity for outsized returns if momentum continues. It is crucial, however, to manage risk and set realistic take-profit zones based on key resistance levels highlighted on the chart.
✅ Show your support by hitting the like button and
✅ Leaving a comment below! (What is You opinion about this Coin)
Your feedback and engagement keep me inspired to share more insightful market analysis with you!
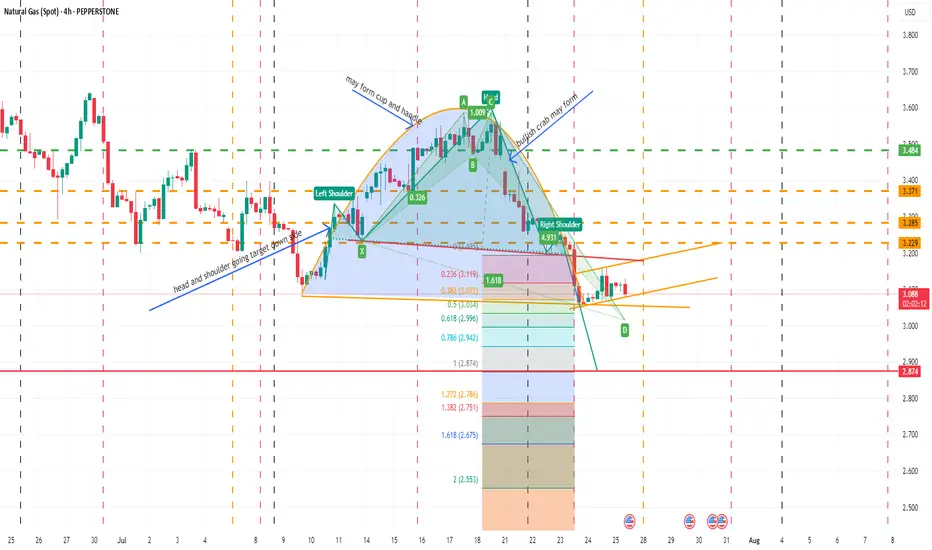
NATURAL GAS SPOTMay form inverse cup and handle, bullish crab also about to form , after completing one head and shoulder pattern already posted earlier new head and shoulder going on. In daily and 4 hr chart below ichimoku cloud. In weekly within cloud. Moving averages showing weakness in daily and weekly, monthly candle also no bearish. May be in such scenario bullish crab pattern may fail but need to be careful as over sold territory. Let see how all works in future though so far all as per analysis. I am not SEBI registered analyst.
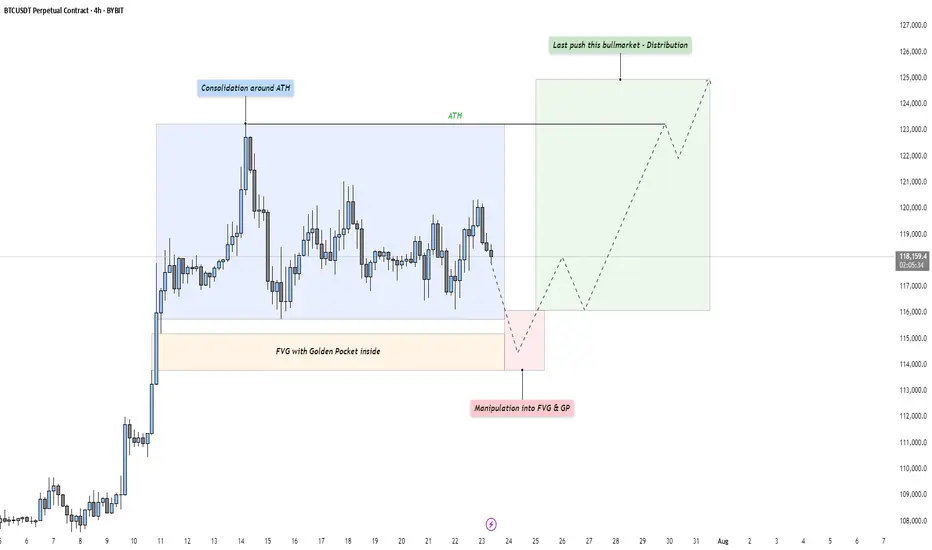
BTC - Last Push: Consolidation, Manipulation & DistributionMarket Context
After a strong upward impulse, Bitcoin has entered a mid-term consolidation phase just below its all-time high. This kind of price action is typical as the market digests recent gains and larger participants prepare for the next move. These pauses in momentum often precede either trend continuation or a reversal — and the structure here suggests we might be witnessing the former, but not without a final shakeout.
Phase 1: Consolidation Around the All-Time High
The first phase is defined by a tight range just beneath the all-time high, where price moves sideways in a balanced struggle between buyers and sellers. This is often where retail participants become overly bullish, anticipating a breakout. However, the lack of a sustained move higher indicates that smart money may be waiting for better entries — or preparing to engineer liquidity to fuel the next move.
Phase 2: Manipulation Into the Fair Value Gap and Golden Pocket
Directly below the range lies a clean Fair Value Gap, with a Golden Pocket retracement nestled inside it. This zone represents a strong area of interest. A sharp move into this area would likely sweep late long positions and trigger stop-losses from range traders — a classic manipulation pattern. This phase serves two purposes: collect liquidity and offer favorable pricing for larger players looking to position themselves before expansion. Watch for signs of absorption or reversal as price enters this zone.
Phase 3: Expansion – The Last Push of the Bull Market?
Following the liquidity sweep and reaction from the Fair Value Gap and Golden Pocket zone, we could see a renewed expansion toward higher highs. This is the phase where volume returns, sentiment shifts, and price accelerates. If this plays out, it could mark the final leg of this bull cycle — potentially driving Bitcoin to new all-time highs with strength.
Execution Thoughts
If you're looking to participate, it's wise to wait for a confirmation signal on a lower timeframe — like the 5-minute or 15-minute chart — once price enters the Fair Value Gap and Golden Pocket zone. Watch for a strong bullish reaction, break of structure, or shift in order flow to signal that buyers are stepping back in.
Final Thoughts
Let the market come to your level and don’t chase moves without context. These three phases — consolidation, manipulation, and expansion — are timeless patterns seen across all markets. Stay patient, stay objective, and react with clarity.
If this breakdown helped you see the setup more clearly, a like would mean a lot — and I’d love to hear your thoughts in the comments! Are you watching the same zone, or do you see something different?
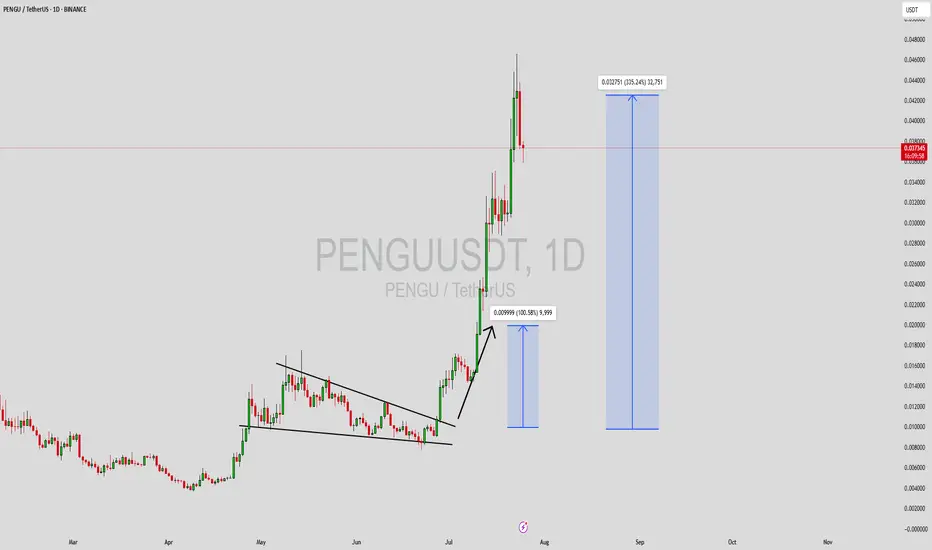
PENGUUSDT Forming Falling WedgePENGUUSDT has recently formed a classic falling wedge pattern on the chart—a well-known bullish reversal structure that often precedes explosive upward price movements. As the wedge narrows and consolidates, it typically signals a decline in selling pressure, preparing for a significant breakout. In PENGU's case, this technical setup, paired with increasing volume, points toward a potentially massive upside of 300% to 350% or more, making it one of the most closely watched low-cap altcoins right now.
This crypto project has been attracting fresh investor interest across various social platforms and trading forums, signaling growing awareness and community engagement. The technical pattern aligns with recent shifts in market sentiment, and volume confirmation during the breakout would provide further confidence to traders. Historically, such setups in meme and low-cap community tokens have led to sharp rallies once momentum builds up, particularly when backed by enthusiastic investor sentiment.
Market conditions currently favor altcoin breakouts, and PENGU appears to be positioning itself for a parabolic move. Traders looking for high-risk, high-reward plays may find this pair especially attractive, given the technical clarity and strong accumulation signals seen at current levels. The confluence of pattern breakout, solid volume, and social buzz could create a perfect storm for significant upside.
As always, risk management is key, but the setup offers a compelling technical opportunity worth watching closely in the coming days. A confirmed breakout above resistance could kickstart the rally and attract further retail and speculative flow.
✅ Show your support by hitting the like button and
✅ Leaving a comment below! (What is You opinion about this Coin)
Your feedback and engagement keep me inspired to share more insightful market analysis with you!
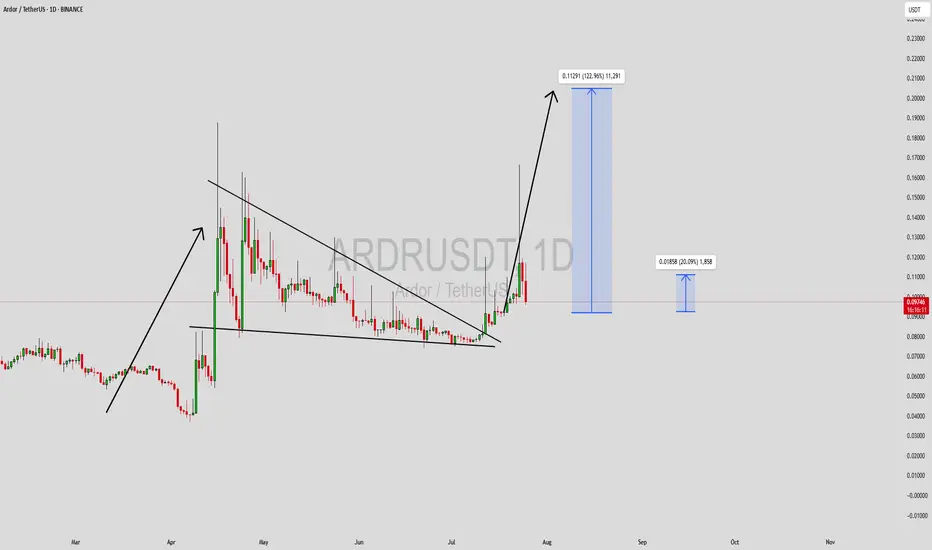
ARDRUSDT Forming Falling WedgeARDRUSDT is displaying a strong bullish technical structure following the successful breakout from a falling wedge pattern—a formation typically associated with trend reversals and substantial upside moves. This breakout is accompanied by solid volume, which further validates the move and hints at strong buying interest. Historically, falling wedge breakouts have produced impressive gains, and in this case, the chart is suggesting a potential rally in the range of 90% to 100%+.
Ardor (ARDR) is gaining traction among traders and long-term investors due to its scalable blockchain infrastructure and real-world applications, especially in enterprise use cases. As the project continues to evolve, market participants are starting to take note of its utility and strong development backing. The recent price consolidation within the wedge and the explosive breakout is a textbook signal for bullish continuation, especially when it occurs after prolonged accumulation.
The price target zones projected on the chart—up to the 0.1129 USDT level—highlight the bullish momentum that may follow. Technical indicators such as MACD crossover and RSI divergence also support this outlook. If the current trend persists and market sentiment remains supportive, ARDRUSDT could easily hit and even surpass these levels, delivering triple-digit percentage returns.
This setup represents a classic high-reward scenario for both breakout traders and position holders aiming to capitalize on mid-term trends. Keep an eye on volume spikes, as they often precede or confirm large moves. With overall market sentiment leaning bullish and increasing social engagement, ARDR is shaping up to be a potential breakout performer in the coming weeks.
✅ Show your support by hitting the like button and
✅ Leaving a comment below! (What is You opinion about this Coin)
Your feedback and engagement keep me inspired to share more insightful market analysis with you!
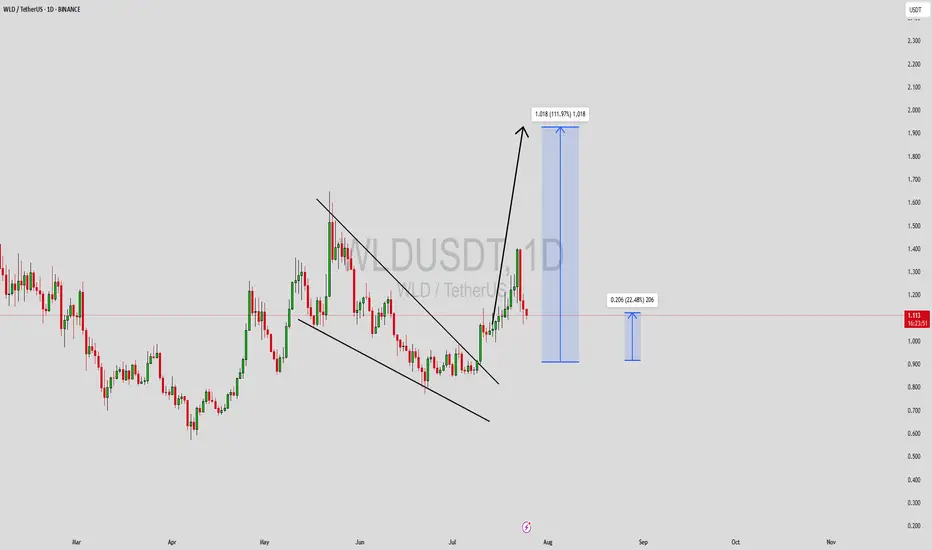
WLDUSDT Forming Falling WedgeWLDUSDT is currently forming a falling wedge pattern, a bullish technical setup known for signaling a potential trend reversal. The narrowing price action within this wedge suggests that sellers are losing strength, while buyers are gradually gaining control. This setup is particularly promising when supported by a rise in volume, and in WLDUSDT’s case, the trading volume has been steadily increasing—an early confirmation of growing investor interest.
Worldcoin (WLD) has attracted major attention due to its unique identity-based ecosystem and backing by high-profile figures in the tech world. The project has recently seen renewed momentum as discussions around digital identity, privacy, and AI integration continue to heat up. The falling wedge pattern, combined with good volume and fundamental strength, increases the probability of an upside breakout. Technical projections point toward a conservative gain of 19% to 20%, making it a suitable target for short- to mid-term traders looking for solid risk-reward setups.
From a technical analysis standpoint, key resistance levels lie near the upper boundary of the wedge, and a breakout with volume confirmation could push prices swiftly toward those targets. Momentum indicators such as RSI and MACD are also showing signs of bullish divergence, hinting at a potential reversal. This setup becomes more favorable in the context of WLD's fundamental narrative and broader market sentiment.
WLD’s long-term vision and growing adoption potential position it as more than just a short-term play. While the immediate gain may be moderate compared to more speculative altcoins, its low-risk technical setup and increasing demand make it an appealing choice for both new and experienced crypto traders.
✅ Show your support by hitting the like button and
✅ Leaving a comment below! (What is You opinion about this Coin)
Your feedback and engagement keep me inspired to share more insightful market analysis with you!
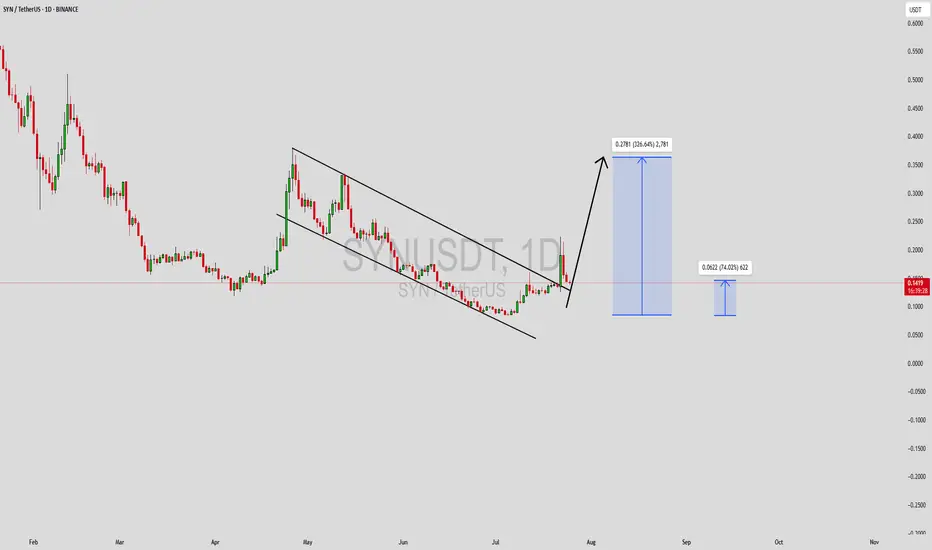
SYNUSDT Forming Falling WedgeSYNUSDT is currently exhibiting a falling wedge pattern, a classically bullish structure that often precedes a breakout to the upside. This setup forms when price action contracts between two downward-sloping trend lines, indicating a slowing of selling momentum and the potential for a strong reversal. As SYNUSDT trades within this narrowing range, increasing investor interest and a notable uptick in volume suggest that a breakout could be on the horizon.
A falling wedge pattern, when supported by good volume, often signals accumulation by smart money ahead of a bullish reversal. With SYN (Synapse) being a prominent player in the cross-chain interoperability and bridging space, the project continues to attract both retail and institutional attention. The expected gain of 290% to 300% aligns with previous breakout behaviors seen from similar wedge patterns in SYN’s trading history. As the crypto market gradually recovers from recent volatility, assets with solid use cases and active development teams are likely to outperform—and SYN fits that profile.
Technical indicators such as RSI and MACD are showing early signs of a reversal, supporting the bullish bias. A confirmed breakout above the upper trendline with a sustained volume increase could trigger a swift rally, reclaiming previous resistance zones and offering traders an attractive risk-to-reward ratio. The 4H and daily charts suggest momentum is building, which makes this a key watchlist candidate in the short term.
With its real-world utility in DeFi infrastructure and increasing partnerships, SYN is becoming a cornerstone for multichain liquidity transfers. SYNUSDT may be poised for a meaningful upward move if this falling wedge pattern completes successfully.
✅ Show your support by hitting the like button and
✅ Leaving a comment below! (What is You opinion about this Coin)
Your feedback and engagement keep me inspired to share more insightful market analysis with you!
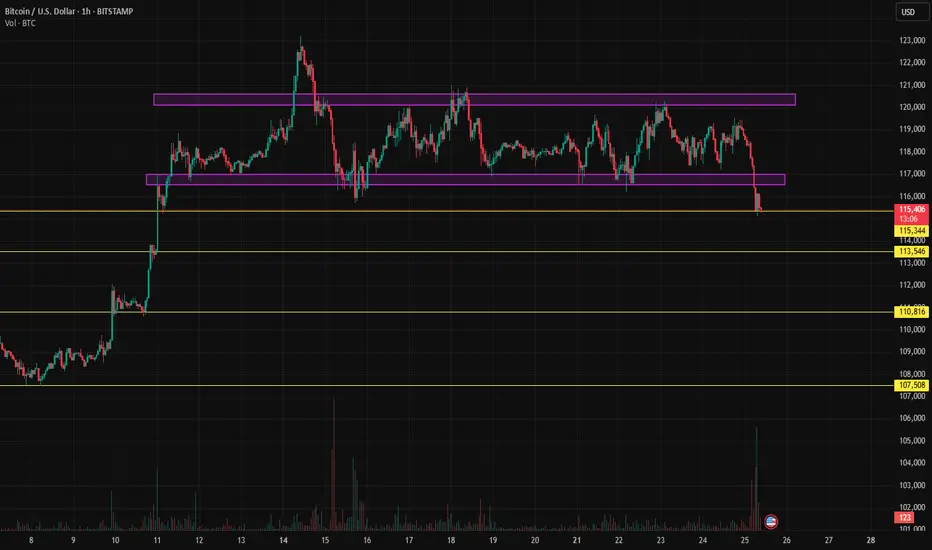
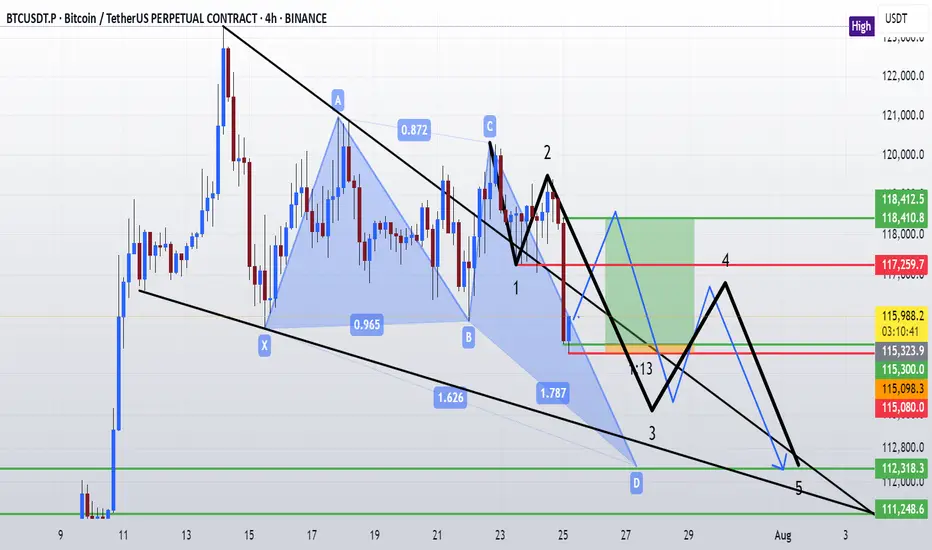
How far will Bitcoin drop? 115? 113? 110? Or even lower?Bitcoin has finally managed to break out of the range after nearly two weeks. Now we need to see whether this breakout gets confirmed or not, and if it does, what volume of selling it will face.
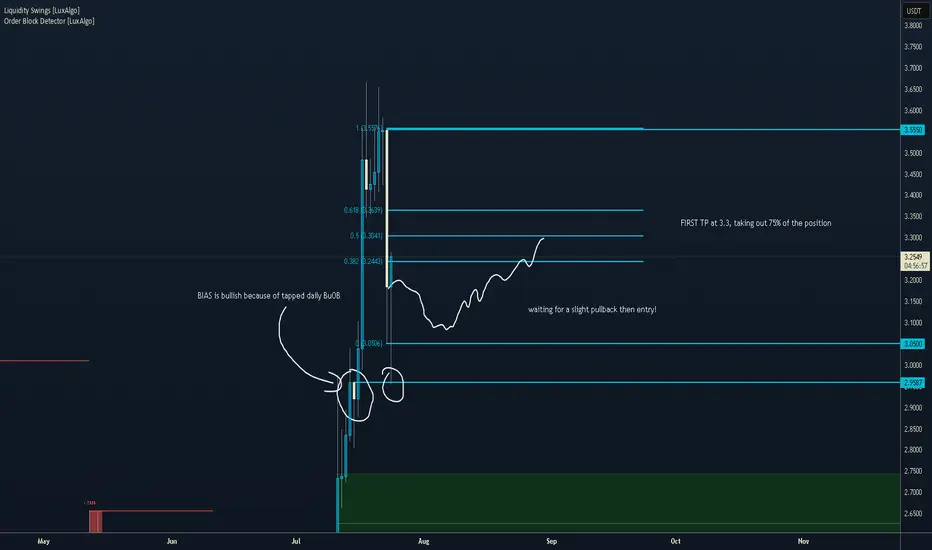
XRPEarly Pullback Potential:
Given the overbought RSI (76.45-89.52) and recent 3% price swings, a slight pullback early in the day is plausible, especially during lower-volume pre-market hours before the New York open (8:00 AM EDT). Key support levels to watch are $3.05 (immediate support) and $2.95 (20-day EMA). A drop to $2.90-$2.95 is possible if profit-taking intensifies, as suggested by declining volume and bearish MACD signals.
Pump on New York Open : The New York market open often brings increased liquidity and institutional activity, which could trigger a price pump. XRP’s recent correlation with bullish market sentiment (Fear & Greed Index at 74, Greed) and high futures open interest ($9.25B) supports potential upside. A breakout above $3.25 could target $3.30-$3.50
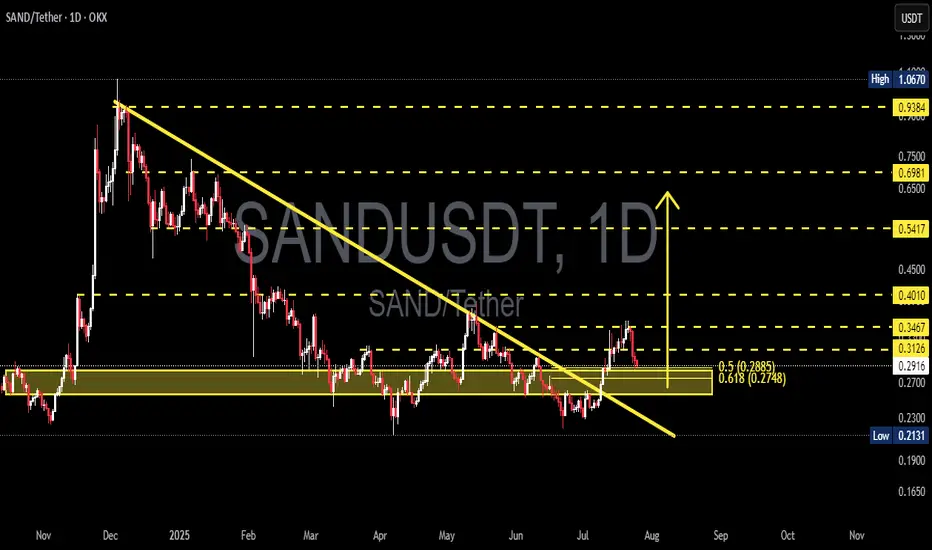
SANDUSDT Breaks Major Downtrend – Golden Pocket Retest!
Technical Analysis:
SAND/USDT has successfully broken out of a descending trendline that had been capping the price since late 2024. The breakout occurred with increased volume, signaling strong buyer interest.
Following the breakout, price rallied and is now retesting a key support zone, which includes:
A demand zone (yellow box) between 0.2748 - 0.2885, aligning with the Fibonacci Golden Pocket (0.618 - 0.5)
A solid horizontal support around 0.2913
Fibonacci retracement levels are clearly defined:
0.3126
0.3467
0.4010
0.5417
Up to major resistance near 0.9384
---
Bullish Scenario 🟢:
If the price holds above the Golden Pocket zone and prints bullish confirmation (such as a bullish engulfing or hammer candlestick), then further upside potential is likely:
1. Initial targets: 0.3126 and 0.3467
2. Mid-range targets: 0.4010 and 0.5417
3. Long-term potential: 0.6981 and possibly the major resistance at 0.9384
Stronger confirmation would come from a daily candle closing above 0.3126.
---
Bearish Scenario 🔴:
If price breaks below the 0.2748 zone, it could indicate a failed breakout, potentially leading to:
1. Initial support: 0.2700
2. Deeper pullback zone: 0.2131 (previous low)
3. Potential fakeout of the trendline breakout
A daily close below 0.2748 would strongly validate the bearish setup.
---
Chart Pattern Overview:
Descending Triangle Breakout already confirmed
Price is now in the retest phase of the breakout
The Golden Pocket Fibonacci zone is the crucial point of trend continuation or reversal
---
Conclusion:
The breakout from the long-standing downtrend marks a strong shift in structure. However, a successful retest at the Golden Pocket will be key to confirming further bullish continuation. If buyers defend this zone, SAND is likely to print a higher low and resume its upward move.
#SANDUSDT #CryptoBreakout #AltcoinAnalysis #TechnicalAnalysis #FibonacciLevels #TrendlineBreakout #GoldenPocket #BullishSetup #BearishSetup
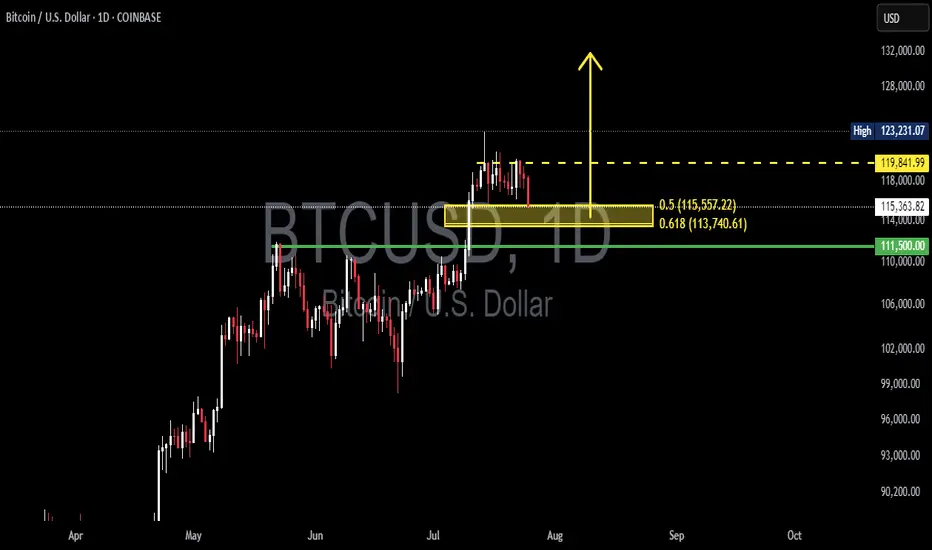
BTCUSD Daily Analysis – Golden Pocket Hold Before a Bullish?🧠 Chart Description & Market Structure:
The BTCUSD daily chart is showing a consolidation phase after forming a local high near $123,231. Currently, the price is retracing and approaching a key Fibonacci retracement zone between the 0.5 level ($115,557) and 0.618 level ($113,740) — also known as the Golden Pocket, which is often a strong reversal area.
---
📈 Bullish Scenario:
If the price holds within or just above the 0.5–0.618 Fibonacci zone (highlighted in yellow) and forms a bullish reversal candlestick (like a hammer, bullish engulfing, or pin bar), there’s a high probability for BTC to resume its uptrend.
Bullish upside targets include:
$119,842 as minor resistance.
$123,231 as the previous swing high and a key breakout confirmation.
A successful break above $123,231 could send BTC toward the next major targets around $128K–$132K.
---
📉 Bearish Scenario:
If the price fails to hold the 0.618 Fibonacci level ($113,740) and breaks down below the key psychological support at $111,500, a deeper correction may occur.
Downside targets:
$108K–$106K as the next major support zone.
A break below this could lead to the formation of a lower high structure and potentially trigger a bearish continuation.
---
📊 Pattern Observations:
Potential Bullish Flag or Rectangle Consolidation: The price action suggests horizontal consolidation after a strong rally — possibly a re-accumulation zone before a bullish continuation.
Golden Pocket Retest: Price is currently testing the Fibonacci 0.5–0.618 zone, often targeted by institutional buyers and technical traders as a potential entry point.
---
🧭 Key Levels to Watch:
Major Resistance: $123,231 (swing high)
Minor Resistance: $119,842
Fibonacci 0.5: $115,557
Fibonacci 0.618: $113,740
Key Support: $111,500
---
🔖 Conclusion:
BTC is currently in a decision zone. Price action within the $115,500–$113,700 range will be crucial. Will this be a healthy retracement before the next leg up — or the beginning of a deeper correction?
#BTCUSD #BitcoinAnalysis #CryptoTA #FibonacciRetracement #CryptoChart #BitcoinDaily #BullishSetup #BearishSetup #CryptoMarket
25.07.25 Morning ForecastPairs on Watch -
FX:USDJPY
CAPITALCOM:DE40
FX:GBPUSD
FX:AUDUSD
A short overview of the instruments I am looking at for today, multi-timeframe analysis down to what I will be looking at for an entry. Enjoy!

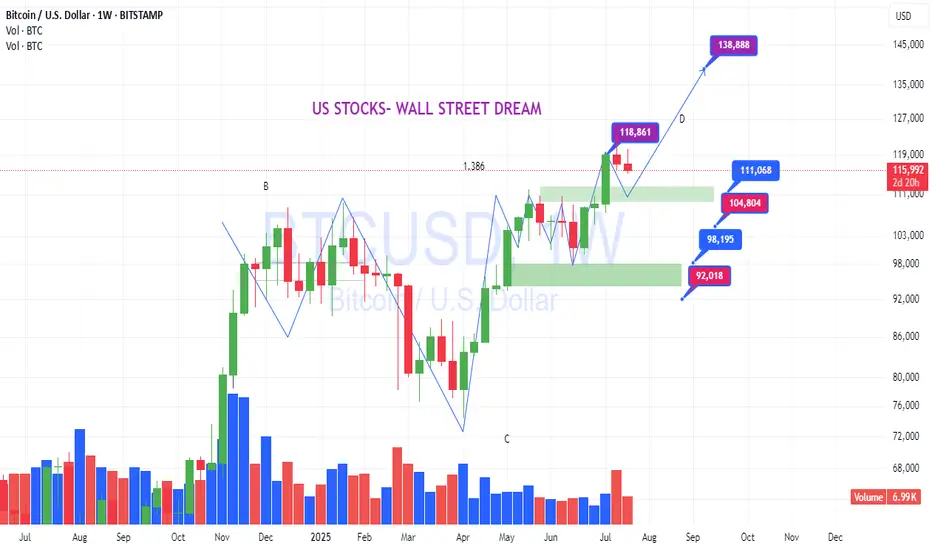
BTCUSD: Who caught the bottom of the previous wave?BTCUSD: Who caught the bottom of the previous wave?
.
I’ve said it before, the market only has a few familiar patterns, repeating them over and over to the point of boredom.
.
US STOCKS- WALL STREET DREAM- LET'S THE MARKET SPEAK!
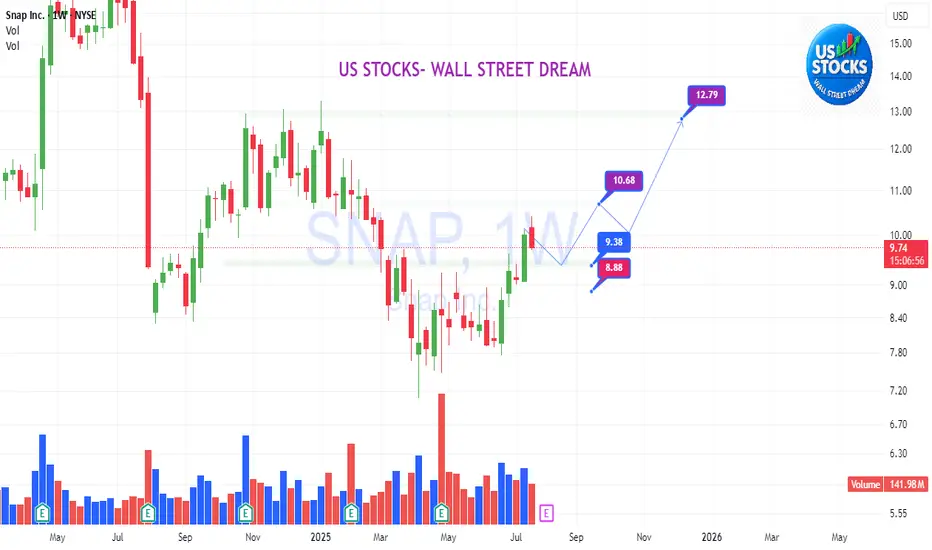
SNAP: Will you join plan with us?SNAP:
.
Will you join plan with us?
Do you want to ride a whole long-term wave that rises from the bottom?
.
US STOCKS- WALL STREET DREAM- LET'S THE MARKET SPEAK!
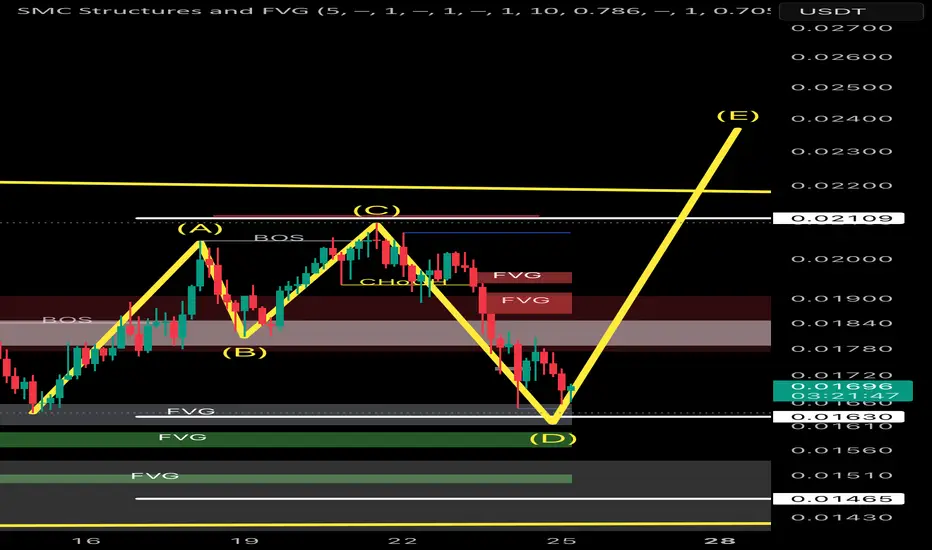
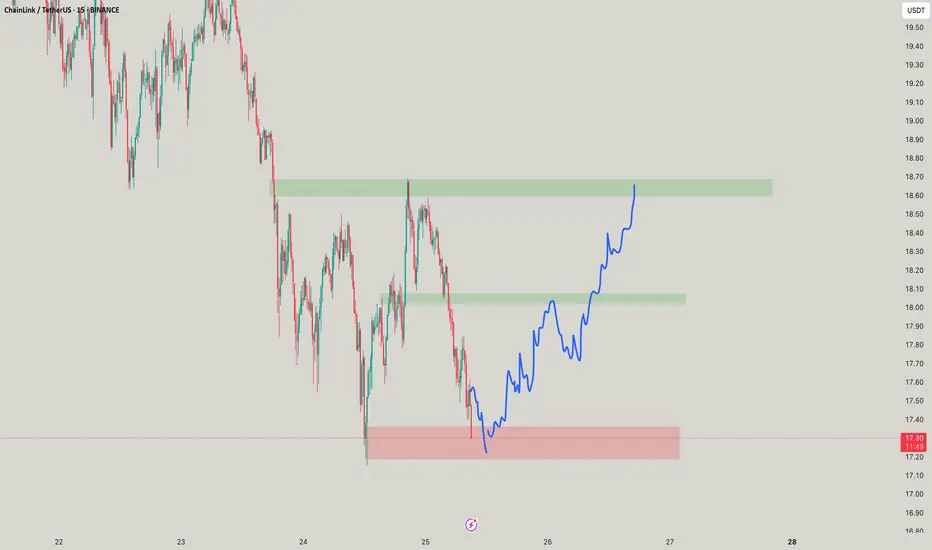
GALAUSDT📌 Key Points:
• Weekly support held perfectly ✅
• Bullish harmonic structure completed ✅
• Fair value gaps below price confirming strength ✅
Let’s see how this plays out — eyes on 0.024 👀💥
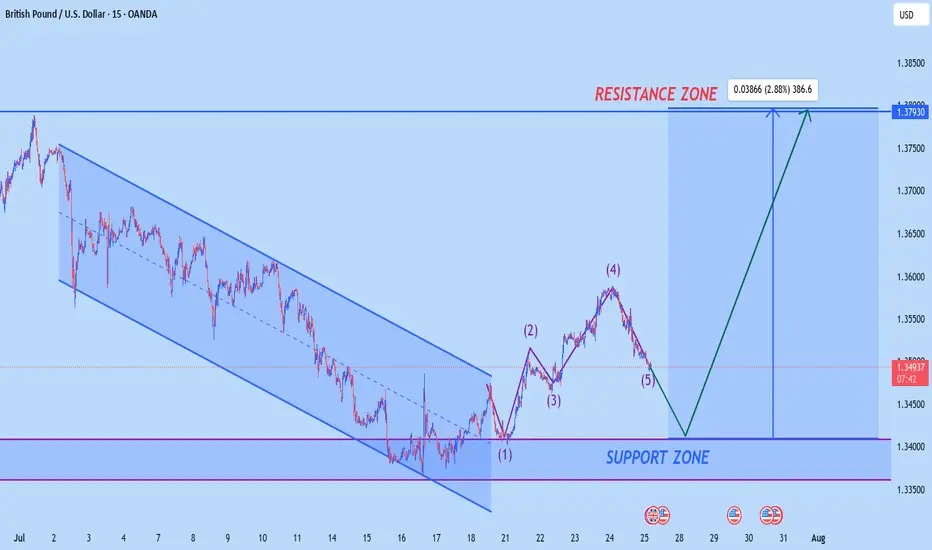
GBPUSD NEW BULLISH LOOKAccording to M15 analysis gbpusd market is near to touch support zone
it is very best chnace for buyer to buy from support level
dont be greedy use money managment
TRADE AT YOUR OWN RISK
REGARD ALBERT
LINK your Idea! Its time!Buying at the right time is the best thing you can do and selling at the right time too! aint it?
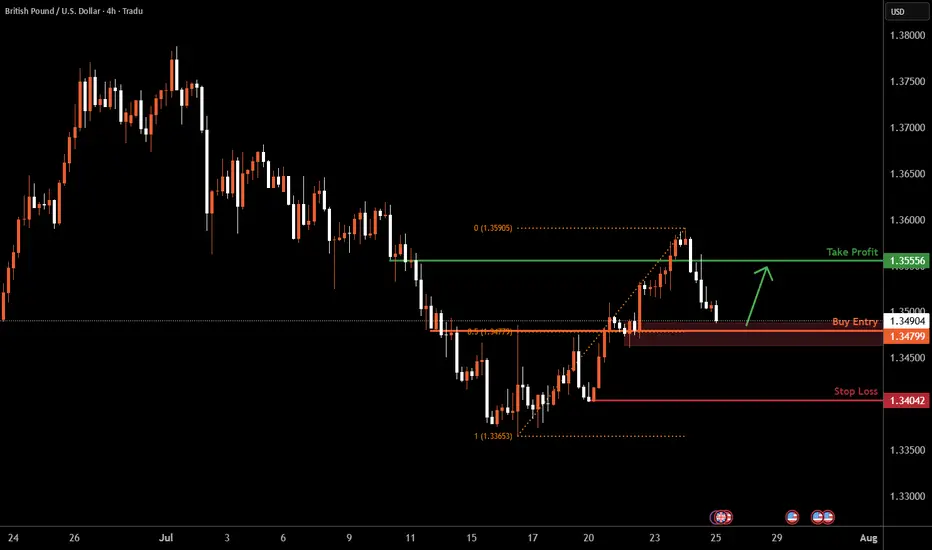
GBPUSD H4 Bullish Reversal Based on the H4 chart analysis, the price is approaching our buy entry level at 1.3404, a pullback support that aligns with the 50% Fib retracement.
Our take profit is set at 1.3555, a pullback resistance.
The stop loss is placed at 1.3404, a swing low support.
High Risk Investment Warning
Trading Forex/CFDs on margin carries a high level of risk and may not be suitable for all investors. Leverage can work against you.
Stratos Markets Limited (tradu.com ):
CFDs are complex instruments and come with a high risk of losing money rapidly due to leverage. 63% of retail investor accounts lose money when trading CFDs with this provider. You should consider whether you understand how CFDs work and whether you can afford to take the high risk of losing your money.
Stratos Europe Ltd (tradu.com ):
CFDs are complex instruments and come with a high risk of losing money rapidly due to leverage. 63% of retail investor accounts lose money when trading CFDs with this provider. You should consider whether you understand how CFDs work and whether you can afford to take the high risk of losing your money.
Stratos Global LLC (tradu.com ):
Losses can exceed deposits.
Please be advised that the information presented on TradingView is provided to Tradu (‘Company’, ‘we’) by a third-party provider (‘TFA Global Pte Ltd’). Please be reminded that you are solely responsible for the trading decisions on your account. There is a very high degree of risk involved in trading. Any information and/or content is intended entirely for research, educational and informational purposes only and does not constitute investment or consultation advice or investment strategy. The information is not tailored to the investment needs of any specific person and therefore does not involve a consideration of any of the investment objectives, financial situation or needs of any viewer that may receive it. Kindly also note that past performance is not a reliable indicator of future results. Actual results may differ materially from those anticipated in forward-looking or past performance statements. We assume no liability as to the accuracy or completeness of any of the information and/or content provided herein and the Company cannot be held responsible for any omission, mistake nor for any loss or damage including without limitation to any loss of profit which may arise from reliance on any information supplied by TFA Global Pte Ltd.
The speaker(s) is neither an employee, agent nor representative of Tradu and is therefore acting independently. The opinions given are their own, constitute general market commentary, and do not constitute the opinion or advice of Tradu or any form of personal or investment advice. Tradu neither endorses nor guarantees offerings of third-party speakers, nor is Tradu responsible for the content, veracity or opinions of third-party speakers, presenters or participants.